Concept

Chromaticity — where it appears

What is left of a colour when its brightness is divided out, which is two numbers and is not enough to say what anything looks like. It is also a projection, so a diagram of it flattens the third dimension entirely and makes areas on the page mean much less than they appear to.

Named by 32 essays across 7 fields — each of them below, with the objects they name alongside it.
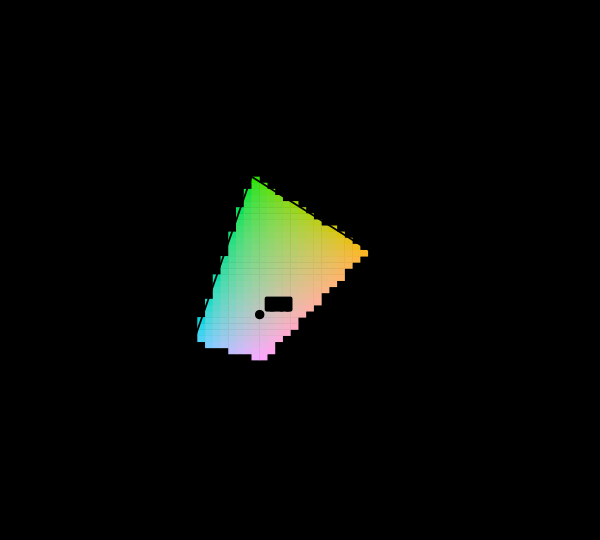
The CIE 1931 chromaticity diagram with its unreachable region marked. The spectral locus encloses every chromaticity a human eye can see. Cells inside the sRGB triangle are drawn in their own colour; the 85 per cent outside it are hatched, because no value this display accepts is the colour belonging there.

Most of this diagram cannot be shown

The chromaticity horseshoe is the canonical illustration of colour science, and nearly every printed copy is filled edge to edge with colours the page cannot produce. The honest version marks them, and the marking covers most of the picture.

matching · Gamut
The CIE 1931 colour-matching functions. The three functions that turn a spectrum into three numbers. They are all positive, which is why XYZ exists — the RGB functions they were derived from are not. ȳ is by construction the luminous efficiency function, which is why luminance comes out of Y.

Seventeen observers in 1931

The standard observer that governs every colour specification in industrial use is an average over seventeen young British men, measured with equipment from the 1920s. It is known to be wrong in the blue, the correction has existed since 1951, and it has never been adopted.

limits · Limits
Blackbody spectra from Planck's law, 2000 to 10000 K. Each curve is computed from Planck's law and normalised to its own peak. The peak moves toward shorter wavelengths as temperature rises. Only two of these radiators peak inside the visible band at all — a 2000 K source peaks at 1449 nm, far into the infrared, and merely rises toward the red across everything shown here.

Blackbody and the colour of temperature

Heat something and it glows, in a colour fixed by its temperature alone. Planck's law gives the whole spectrum from one number, and the Planckian locus is the only curve in colour science derived from physics rather than from measurements of people.

light · Light
MacAdam's discrimination ellipses, drawn 10 times actual size. Twenty-five ellipses of colours indistinguishable from their centres. They are drawn at 10× because at true scale most are thinner than a line. Their areas vary by a factor of 74, which is the whole result: a step of the same size in xy means very different things in different places.

MacAdam measured it

In a perceptually uniform space the just-noticeable-difference contours would be circles of equal size. MacAdam's ellipses are neither, by a factor of eighty — and transforming them into each candidate space settles which spaces improved matters and by how much.
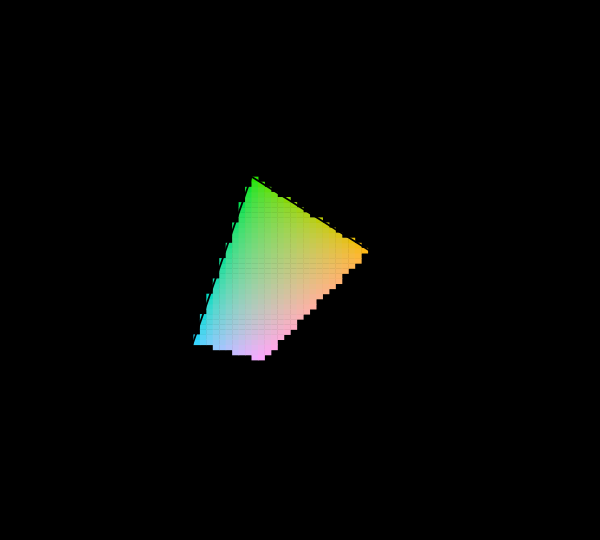
difference · Metric
sRGB, Display P3 and Rec. 2020 compared on the chromaticity diagram. Three nested triangles inside the horseshoe. sRGB covers 74 per cent of the area P3 covers. Rec. 2020's red and green primaries sit on the spectral locus itself, within 0.000 and 0.002 of it, meaning they are monochromatic.

What a gamut costs

Three primaries reach a triangle and the visible region is not a triangle, so something has to give. Widening the primaries helps, has a price in precision and compatibility, and runs into a limit that is geometric rather than technological.

matching · Gamut
Threshold and suprathreshold contours, normalised to the same size. At five of MacAdam's centres: the measured just-noticeable-difference ellipse in grey and the ΔE2000 = 1 contour in gold, each scaled to the same mean radius so that only shape and orientation are being compared. A scale change preserves orientation exactly, so any rotation between the pair settles the question. They differ by 24° on average and by 70° at worst, and the ratio between their sizes varies 4.8-fold across the diagram — so no single factor turns one into the other.

A threshold is not a unit

MacAdam measured the smallest difference anyone could detect. ΔE2000 was fitted to how far apart plainly different colours look. The two are quoted interchangeably, and the contours they produce are not even the same shape.
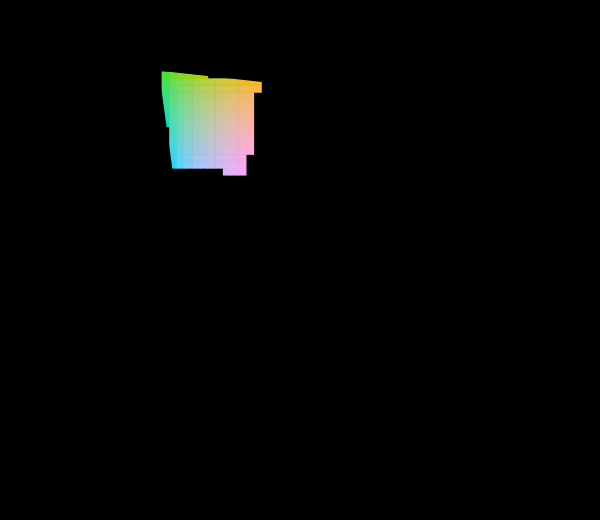
difference · Metric
The 1976 uniform chromaticity diagram, with the unreachable region marked. The u′v′ diagram: the same spectral locus and the same sRGB primaries as the 1931 picture, projectively transformed. Straight lines stay straight, so mixtures and the gamut triangle survive; what changes is the distribution of area, and the green region that dominates the 1931 diagram is much reduced. 8% of the cells sampled inside the locus are reachable at Y = 0.55; the rest are hatched.

The diagram was replaced in 1976

The CIE knew the 1931 diagram was badly distorted and published a better one. Half a century later almost every chromaticity plot in print is still the old one, and both are still printed filled edge to edge with colours no display can show.
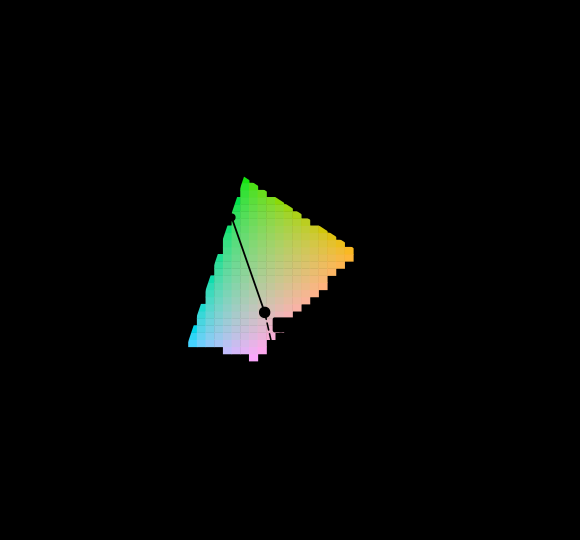
matching · Gamut
Dominant wavelength as a construction on the diagram, against equal-energy E. A ray is drawn from the white point through each sample and continued until it leaves the diagram. The sample at (0.28, 0.52) leaves through the spectral locus at 537 nm, at excitation purity 0.43. The sample at (0.36, 0.19) leaves through the line of purples, so it has no dominant wavelength at all and is written 544c nm — the crossing on the opposite side, marked with a c. The hatched region is colour this display cannot show and is not drawn as though it could.

Not every colour has a wavelength

The question every reader arrives with is which wavelength a colour is. For close to a third of the directions on the chromaticity diagram the honest answer is that there is none, and the construction colorimetry offers instead is a statement about a diagram rather than about light.

matching · Gamut
Chromaticity-triangle area against CIELAB volume, both relative to sRGB. Two ratios for each space, both against sRGB. The upper bar is the area of the primary triangle on the CIE 1931 diagram; the lower is the volume of the gamut solid in CIELAB, computed by tetrahedral decomposition of the RGB cube at 24 cells per axis. Display P3 is 1.36× sRGB by area and 1.50× by volume; Rec. 2020 is 1.89× sRGB by area and 2.26× by volume. The chromaticity diagram divides luminance out, so its triangle is a projection along the axis the eye is most sensitive to — and a coverage percentage quoted on it is a statement about the shadow.

The triangle is a shadow

A display's gamut is drawn as a triangle on the chromaticity diagram, and coverage is quoted as a percentage of that triangle's area. Chromaticity has luminance divided out, so the triangle is a projection along the axis the eye cares most about — and the ratios computed on the solid are not the ratios computed on its shadow.
limits · Limits
A spectrum after 2 bounces off the same surface. The lamp's spectrum at the top, then the same spectrum multiplied by a reflectance peaking at 530 nm once for each bounce. Interreflection is elementwise multiplication, so light that reaches the eye by the long way round carries ρ raised to the number of surfaces it met. Each row's swatch is drawn at fixed luminance so only the chromaticity changes, and the distance from the D65 white point, printed at the right, rises from 0.000 to 0.235. The spectrum narrows every time, which is why a room painted in one colour is more saturated in its corners than on its walls.

A bounce is a multiplication

Colorimetry multiplies an illuminant by a reflectance once and integrates. A surface in a room is lit by every other surface the lamp reached first, so the spectrum arriving at the eye has been multiplied several times — and the second multiplication is where the whole apparatus of matching starts to come apart.
scene · Scene
The two components of daylight, computed from one radiator and one scattering law. A 5800 K radiator through the atmosphere at air mass 1. The direct beam is the radiator times e^{−τm}; the sky is what that extinction removed, so the two are complements and neither needs its own model. The sky is steeply blue because τ ∝ λ⁻⁴, and a surface in shadow is lit by that component alone. Open ground and shadowed ground therefore sit under two illuminants differing by ΔE00 = 21.4 — which is why a photograph of snow has blue shadows and why no single white balance fixes both halves of it.

A shadow has its own illuminant

Outdoors there are two lights, not one. The direct beam is a radiator reddened by the atmosphere; the sky is precisely the power that reddening removed. A shadow is lit by the second alone, so shadowed ground and sunlit ground sit under illuminants 21 units of ΔE apart — before any surface, any eye or any opinion is involved.

scene · Scene
A glossy surface returns two spectra, and only one of them is the paint. The dichromatic reflection model, computed rather than assumed. Light that enters a dielectric binder, scatters off pigment and comes back carries the reflectance — the body component, ΔE00 = 33.7 from the lamp. Light reflected at the interface never entered, so it carries the lamp's spectrum with only Fresnel's slight dispersion on it: ΔE00 = 1.06. The interface term is computed from Fresnel's equations on a Cauchy index at 55°, so its near-neutrality is a result here rather than an assumption. This is why a highlight is the one region of a photograph that tells a white balancer what the light was, and why removing highlights removes the evidence.

The highlight is the lamp

Light reflected at the surface of a glossy material never entered it, so it never met a pigment. Fresnel's reflectance varies by 5.5% across the visible band and the paint underneath varies by a factor of twenty — which makes a highlight the one region of a photograph that reports what the light was rather than what the object is.

scene · Scene
How far three channels drift from eighty-one, per bounce. One room, one geometry, one reduction to three channels, and the only thing changing is how many bounces of the Neumann series are kept. At one bounce the two agree to 2.5e-13 — the only reflectance in that path is the floor's, which is flat, and a flat reflectance is one of the few three numbers carry exactly. Every bounce after it multiplies another non-flat reflectance into the spectrum, and three numbers cannot carry a product they were never given the factors of. The curve levels off at ΔE00 = 2.38 because the light has run out, not because the disagreement has.

Rendering in three numbers

Almost every renderer ever shipped bounces red, green and blue rather than a spectrum. The error that costs is exactly zero at the first product and grows at every one after it — because three numbers cannot carry a product they were never given the factors of, and each bounce is another product.
scene · Scene
The interreflection gain of a room, band by band. A closed cavity of reflectance ρ returns 1/(1 − ρ) times the light that entered it, and because that is computed per band it amplifies the wall's colour along with its brightness. The wall here is only 5% off neutral — a paint anybody would call white — and at albedo 0.9 the room's white point has moved by ΔE00 = 50.7 against the lamp it was lit with. The gain is a geometric series, so the last few percent of albedo cost far more than the first: 1.64× at ρ = 0.4 against 8.41× at ρ = 0.9.

What a white wall costs

A closed room returns 1/(1−ρ) times the light that entered it, computed band by band — so a paint that is five percent off neutral becomes a strongly coloured illuminant once the room has finished bouncing. The gain amplifies the tint along with the brightness, and the last few percent of albedo cost far more than the first.
scene · Scene
Every face of the solved room. The red room after the transport is solved in all 81 bands. Only the ceiling emits; the other five faces are lit entirely by what the ceiling and each other send them, so their colour is the lamp multiplied by every reflectance along every path that reached them. The ceiling itself comes out 1.05× brighter than it emits, because a closed room returns light to its own source. The two chromaticities under each swatch are the spectral solve and the three-channel one, and the faces furthest from the lamp — the ones the light reached by the most bounces — are where they disagree most.

The room is the illuminant

Colour bleeding is usually described as an aesthetic phenomenon of rendered images. It is better described as a measurement. In a room with one lamp, five of six surfaces emit nothing at all, so their light is entirely a product of other surfaces' reflectances — and the bleeding saturates rather than running away, for a reason worth deriving.

scene · Scene
Mixing two paints and stacking two filters are different operations. The same two reflectances combined two ways. Stacking them as filters multiplies the transmittances, which is right for gels in front of a lamp and wrong for pigment stirred into pigment: a stirred mixture is one scattering layer, not two in series, and light meets whichever particle is nearest rather than passing through both. Kubelka–Munk handles it by moving to K/S = (1 − R)²/2R, in which absorption and scattering add by concentration, and inverting afterwards. The two answers differ by ΔE00 = 15.0, and the filter model is the darker of the two because it charges every photon for both pigments.

Paint is not a filter

Stacking two filters multiplies their transmittances. Stirring two pigments together does not multiply their reflectances, because a mixture is one scattering layer rather than two in series — light meets whichever particle is nearest. Treating the two as the same operation is a 15-unit error, and which way it errs turns out to depend on whether the comparison holds the amount of pigment fixed.

scene · Scene
Why blue and yellow make green. 7 mixtures between a blue and a yellow pigment, mixed in Kubelka–Munk — K/S summed by concentration and inverted back to reflectance — and plotted against the straight line joining the two endpoints. The path bows towards green by 0.099 in chromaticity, and the reason is in the spectra rather than in the eye: the blue reflects below about 520 nm and the yellow above about 500, so the only band both return is the overlap between them. Mixing lights adds spectra and lands on the chord; mixing pigments intersects them and does not.

Why blue and yellow make green

The oldest fact in colour, and the usual explanations are wrong. It is not because green sits between blue and yellow, and it is not a fact about the eye at all — it is that the only band both pigments return is their overlap, and the overlap of a blue and a yellow reflectance is green. Computed, the mixing path bows away from the straight line by a measurable amount.
scene · Scene
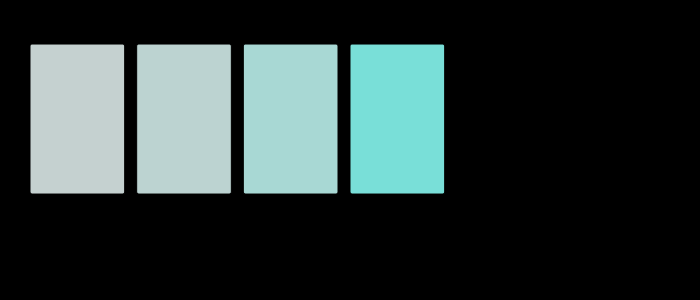
The same medium at six path lengths. Beer's law at 6 depths of one absorbing medium. The absorption coefficient is a single spectrum and the only thing changing is how far the light travelled, yet the patches differ in hue by 7.8° as well as in lightness — because absorption is exponential in depth and the observer is linear, so the bands that survive at d = 8 are not a scaled copy of the ones that survive at d = 0.25. Path length belongs to the geometry, not to the substance, which is why this sits in a field about scenes.

The colour is in the thickness

Transmittance is exponential in path length and the observer is linear, so doubling the depth of an absorbing medium squares the transmittance rather than halving the colour. A translucent object therefore has no one colour — its thin edge and its thick middle are different spectra of the same substance, and the hue moves between them.

scene · Scene
One film, five viewing angles. The same 340 nm film seen from 5 directions. Nothing about the object has changed — not the light, not the material, not the thickness — and the colour swings by ΔE00 = 42. A pigment's spectrum contains no path length and no angle, so it cannot do this; a film's contains both. This is the clean separation between structural and pigmentary colour, and it is geometric rather than chemical.

A colour that moves with the viewer

A thin film has no pigment in it. Its reflectance spectrum is an interference condition containing a path length and an angle, so tilting the sample moves every maximum to a shorter wavelength and changes the colour by 40 units of ΔE. A pigment's spectrum contains neither, and cannot do this at all — which is the cleanest separation between the two kinds of colour there is, and it is geometric rather than chemical.

scene · Scene
What no surface can be more colourful than. The MacAdam limits at 4 lightnesses under D65, each computed by sweeping two-transition reflectances over the whole band and keeping those that land at the target luminance factor. This is a physical bound rather than a gamut: a reflectance above 1 is a surface that emits, so no pigment anybody invents will ever put an object colour outside these curves. The boundary shrinks steeply as the surface lightens, from 0.310 at Y = 0.1 to 0.028 at Y = 0.9 — a very light surface has almost no room to be colourful, and that is physics rather than pigment chemistry. Drawn against it is sRGB at the same luminance factor rather than as a primary triangle, because a triangle is what a display can reach at some luminance and the bound is what a surface can reach at one; matched properly, sRGB covers 36% at Y = 0.1, 40% at Y = 0.3, 40% at Y = 0.6, 21% at Y = 0.9. The faint triangle is the familiar figure, kept only to show how much it misleads.

No surface can be that colourful

There is a hard bound on object colour that no pigment will ever move, and it follows from a reflectance being at most 1. Its boundary is generated by two numbers, it shrinks by a factor of eleven from dark to light — and measured against it properly, sRGB reaches 40% of what a surface could be at mid lightness while Rec. 2020 reaches 106%.
scene · Scene
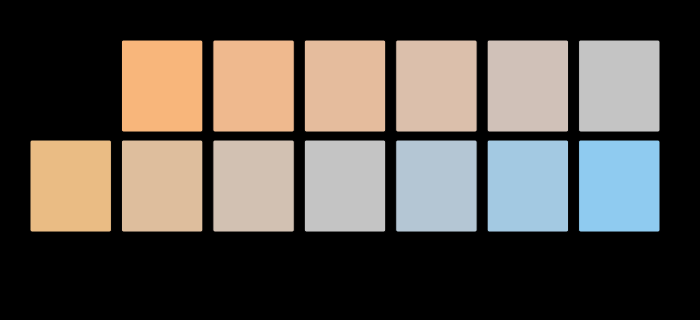
One white balance across a scene lit by two lamps. A neutral surface of albedo 0.6 under 7 mixtures of A and D65, corrected by one diagonal transform chosen for the middle of the run — which is what a camera does when it estimates a single illuminant. The middle patch comes out neutral to ΔE00 = 0.00 and both ends do not: 19.8 at the A end and 16.9 at the D65 one. The failure is structural rather than a matter of a better estimator: white balance is one transform for the whole image, and a scene with two lamps in it has no single answer for that transform to be. Every patch here is the same surface.

A scene has no white point

White balance is one transform applied to a whole image, and a scene lit by two lamps has no single answer for that transform to be. The failure is structural rather than a matter of a better estimator — and every colour-managed workflow in existence takes exactly one white point as an input, with no field in which to say there were two.

scene · Scene
Colour temperature, and the number nobody quotes beside it. The Planckian locus in the 1960 UCS diagram — the only diagram on which correlated colour temperature is well defined — with four sources and the perpendicular from each to its nearest point. The temperature is where the foot of the perpendicular lands; Duv is how long the perpendicular is. halophosphate sits 0.0246 off the locus at 4513 K, which is a visible green cast that its colour temperature does not mention.

White is a region

A lamp is not sold as a chromaticity. It is sold as 4000 K, and what that means is that its chromaticity fell inside a quadrangle — which two lamps can occupy at opposite corners, eleven ΔE00 apart. In a room with either of them, the same twelve surfaces differ by one unit.

light · Light
What a fourth primary actually buys. All three displays are floating-point-exact matches for the reference observer, so no colorimeter can tell them apart. The bars are the 95th percentile of what two hundred other eyes report. Held to the same gamut floor of 1.4× sRGB, the four-primary design leaves the population 2.6 times closer together than the three-primary one. That is what the extra emitter is worth, and it is not more colour — the gamut is held fixed while it is measured.

A fourth primary is a design

A display's fourth emitter is sold as more colour. Optimised instead against how far apart two hundred eyes are about its white — with the gamut held fixed so it cannot cheat — it buys agreement, and two and a half times closer together than three primaries reaching the same area, and the wavelengths it chooses are not the ones anybody would pick.

matching · Gamut
Which of these paints the display can show, and to how many people. Each row is a real surface under D65, and the bar is the share of 120 observers for whom a non-negative mixture of this display's three primaries reproduces it. The question has no observer-free answer: the paint is a reflectance, the primaries are emission spectra, and whether one matches the other is a fact about somebody's cones. A dot marks the rows the 1931 observer calls displayable. 2 of them are rows some real people cannot see, and 4 more go the other way.

A gamut has a population

Whether a display can reproduce a paint is a fact about somebody's cones, so the boundary of a gamut is not a curve but a band. On a laser projector, ten of twenty-eight boundary surfaces are ones the standard observer calls displayable and some real people cannot see — and the wider the gamut, the wider the band.

matching · Gamut
How much of a whiteness figure is the sheet, and how much is the lamp. Each bar is how many points of CIE whiteness a stock has above an unbrightened sheet of the same base, measured with an ultraviolet-included instrument. The dark part is what survives when the ultraviolet is removed — the part that is a property of the paper. On average 82 per cent of the scale is the pale part, which is a property of the instrument's lamp. A whiteness figure without a measurement condition beside it is therefore not a measurement of a sheet; it is a measurement of a sheet and a lamp, quoted as though it were the first.

Whiteness is mostly the lamp

The CIE whiteness formula ranks white samples the way people do, which is what it was built for and is not in question. What is in question is what it is a measurement of — take the ultraviolet out of the instrument and 82 per cent of the scale collapses, because the part that separates a premium sheet from an ordinary one was contributed by the lamp.

difference · Metric
The locus and the triangle, drawn on one of the diagrams. The spectral locus and the sRGB triangle in CIE xy (1931) — the default of the discipline, and the default used here. The triangle covers 33.6% of the enclosed area here. Nothing about the observer or the display has changed between this picture and any other in the family; the coordinates have, and the coordinates are what an area is measured in.

The diagram has no area

A chromaticity diagram is a projective picture of a three-dimensional space, and the freedom colour matching leaves in the observer acts on it as a projective map. Straight lines and mixture ratios survive that; area, distance and angle do not — so half of what the diagram is used to say is a statement about the paper.

matching · Gamut
Three published primary sets, and a fourth chosen for how it adapts. The spectral locus with four triangles inside it. sRGB covers 33.5% of the diagram and leaves an adapted observer 2.36 ΔE00; Display P3 covers 45.4% at 1.22; Rec. 2020 covers 63.3% at 1.09. The fourth triangle is the best adaptation basis available to a display asked to cover 63.5% of the diagram, at 1.02 — and it is a different triangle from Rec. 2020's rather than a smaller one. The largest triangle that fits at all covers 73.9%, which is where the axis of this argument ends.

Primaries chosen for their inverse

Moving a display's white point is a gain on its R, G and B, so a display adapts in the inverse of its own primary matrix — a basis chosen by committees for gamut coverage and phosphor availability. Pose the design problem properly and the answer costs one per cent of the gamut argument and reaches within two per cent of the best basis there is.

applied · Delivery
A confusion point is about the pigments that remain. Three groups of three bars. Each group is one dichromat's confusion point; each bar is how far that point moves in chromaticity when one of the three cone pigments has its absorption peak shifted by eight nanometres. In every group the bar for the pigment that dichromat is missing has length zero — exactly zero, to machine precision, not merely small. The protanope's point does not move when the L pigment moves, the deuteranope's does not move when the M pigment moves, and the tritanope's does not move when the S pigment moves. The reason is algebraic rather than physiological: a confusion point is the direction that excites only the missing cone, which is the null space of the other two receptors' rows, and rescaling a row does not move where the other two are zero. So the point at which a protanope's confusion lines meet is not a fact about the pigment a protanope lacks, which is why the claim about it restates in nanometres of the M pigment.

A point about the pigments that remain

The chromaticity at which a protanope's confusion lines meet does not move at all when the long-wave pigment moves — not slightly, exactly not at all. It moves a great deal when the medium-wave pigment does. A dichromat's confusion point is a fact about the two receptors they have rather than about the one they lack.

eye · Cones
Two primaries mixed, and the line a reader assumes they take. The additive mixture of two sRGB primaries, walked in twenty steps, plotted in the a and b of CIELAB. The filled points are where the light actually goes, which is exactly straight in tristimulus values because that is Grassmann's second law. The open points are the straight line between the two readings. They part company by 26.7 ΔE₀₀ at their furthest, at 60 per cent of the way along, and the half-and-half mixture misses the midpoint by 21.1.

The mixture line bows

Grassmann's second law says an additive mixture is exactly linear in tristimulus values, and tested here it is exact to floating point. Nothing downstream of the three numbers preserves it. The physical half-and-half mixture of two colours sits a median of 5.5 colour differences from the midpoint of their two readings and up to thirty; on a green and a blue display primary it is twenty-one, which is a quarter of the distance between them.

matching · Gamut
What survives holding the lightness still. For each of five groups of rooms sorted by how much light the wall returns, the rank correlation of the finish's share with three properties of the paint, taken with the wall's luminance factor held. The wall's chroma runs from -0.90 among the darkest walls to 0.81 among the palest, crossing zero in the middle — the reversal. The band's width, which was the predicted mechanism, never leaves the range -0.15 to 0.22, and the census already contains four families whose bands are all the same width.

The finish adds the room's own colour

Among dark walls a more saturated paint loses a smaller share of its colour to a gloss finish, and among pale walls a larger one. The mechanism proposed for that reversal was spectral concentration — a narrow tall band — and the census that found it already contained four families of paints whose bands are all the same width. Holding lightness still, the band's width orders the losses at a rank correlation of 0.01. What does order them is that the light a finish adds has already bounced off the walls.

scene · Scene
Where chroma stops protecting a wall, in five rooms. The seventy-two paints in each of five rooms, sorted by how much light the wall returns and read in overlapping windows of eighteen: the rank correlation of the share of colour a satin finish takes with the wall's chroma, lightness held. Below zero a more saturated paint loses less; above, more. The dots are where each room's curve crosses: cube at 0.36, corridor at 0.37, low room at 0.38, one wall open at 0.29, two walls open at 0.24. Solid lines are closed rooms of three shapes; dashed are the cube with one and two walls opened.

An open room hands over sooner

A gloss finish takes the least colour from a saturated dark wall and the most from a saturated pale one, and in a closed cube the sign changes at a wall returning about a third of the light. The prediction was that a less enclosed room would move that point up the lightness scale and that a room with a window would have no pale end. Opening one wall moves it down, from a luminance factor of 0.36 to 0.29, and opening a second to 0.24; stretching the room into a corridor or flattening it nudges it slightly up. The ambient does whiten, as predicted. A whiter ambient does not delay the colour term — it weakens it, so the other term takes over sooner.

scene · Scene
The lamp's white, six walls and the light arriving at each. On the 1976 chromaticity diagram, in the closed cube under daylight: the lamp's white (centre), six saturated walls with bands centred from 450 to 650 nm (open circles), and the light arriving at each wall from the rest of the room, lamp included (filled). Each ambient lies on the line from the white to its wall, a fraction of the way along it: 450 nm 10 per cent, 490 nm 12 per cent, 530 nm 19 per cent, 570 nm 19 per cent, 610 nm 13 per cent, 650 nm 5 per cent.

A probe at the wall prices the finish

The light arriving at a painted wall from the rest of its room is what a gloss finish hands back, and a small probe held against the wall reads it. It lies on the line from the lamp's white to the wall's own colour, a fraction of the way along, and the fraction is set by how much light the wall returns, not by how colourful it is — as predicted. It is not the fixed fraction the prediction said: it runs from 2 to 46 per cent across seventy-two paints in one room. That variation is what makes it useful. Read in the matt room, it orders what a satin finish would cost more tightly than the paint's own lightness does, in every room tried.

scene · Scene

Named alongside it

The objects these essays reach for when they reach for this one.

Standard observerReflectancePrimariesDisplay gamutGamutIlluminantInterreflectionColour managementΔERadiosityWhite pointCIELAB

All concepts