The collection

Every essay

One idea per essay, ordered so that the earlier ones set up the later ones — but nothing here depends on being read in sequence.

What light is What the eye does Matching and measuring Difference and uniformity What the brain does What a scene does What a camera does Where the model breaks What it takes to deliver it

SeriesObserversNamed objectsRefutationsSearch

What the brain does

Constancy, adaptation and simultaneous contrast — the reasons a patch of known radiance still has no determined appearance.

Two identical grey patches on different surrounds. Both inner squares are #818181. The one on the dark field looks lighter. The values are checked to be equal before the figure is drawn, so the claim is a fact about the drawing rather than a promise.

These two patches are identical

It is the most repeated and least checkable sentence in visual perception, because the whole point is that it does not look true. Every instance here is computed, and checked before the figure is drawn.
7 figures
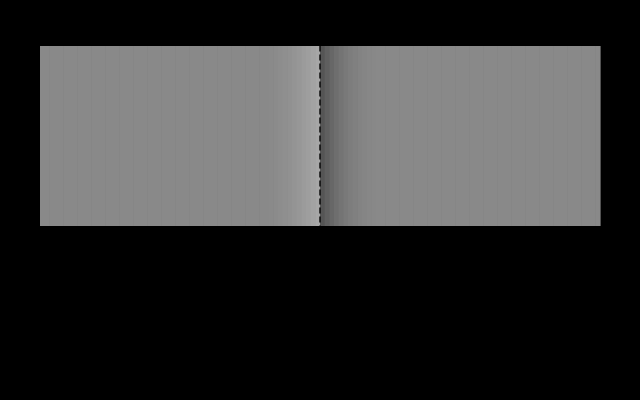
The Cornsweet edge, with its luminance profile. The two plateaux are both #898989 and are flat to exactly — the profile below shows that everything which differs lies within a narrow band at the boundary. Cover the centre line and the two halves become obviously identical.

Brightness is inferred from edges

The Cornsweet effect makes two identical regions look different by altering nothing except a narrow band at the boundary between them. Cover the boundary and the difference vanishes, which says the visual system is reconstructing surfaces rather than reading off intensities.

8 figures
One reflectance, two illuminants, two colours. A reflectance peaking near 580 nm, and the colours it produces under D65 and A. The object has not changed. The light has, and colour is a property of the pair.

Constancy is the default

A sheet of paper looks white in daylight and white under a tungsten lamp, although the light reaching the eye differs enormously. The visual system is solving one equation with two unknowns, and it solves it by assumption.
9 figures
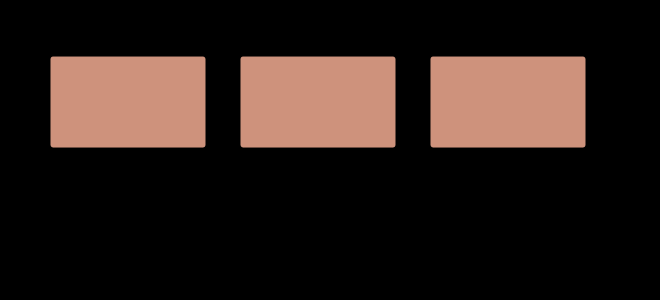
One stimulus, three rooms, three appearances. The same XYZ in a dark, a dim and an average surround. The stimulus does not change and is drawn identically in all three panels; what changes is what CIECAM16 says it looks like. Predicted lightness runs from 65.6 to 57.5 — a spread of 8.1 — with chroma and colourfulness moving too. Colorimetry returns one answer here because it has nowhere to put the room.

A viewing condition is an argument

An appearance model takes a stimulus and a situation. The second argument is not a refinement of the first — it is the content of the claim, and a model that returns an appearance from a colour alone has assumed a room without saying which.

7 figures
Colourfulness rises with light level; apparent contrast does not. Predicted colourfulness M for one stimulus across four decades of adapting luminance, and the exponent of the lightness curve over the same range. M rises by a factor of 2.24 — the Hunt effect, which the model does predict. The lightness exponent changes by -2.2%, and in the wrong direction — the Stevens effect, which it does not.

Brighter looks more colourful

Colourfulness rises with light level and the model predicts it. Apparent contrast is supposed to rise too, and the model does not — which turns out to be right, because the thing that actually carries contrast is the surround.

6 figures
Four adaptation transforms, measured against CAT16 (D65 to D50). Twenty-seven colours moved from D65 to D50 by each transform, compared with the current recommendation. Bars are the worst disagreement in CIELAB, the number beside each is the mean. Plain XYZ scaling — still shipping, still called von Kries by people who have not read von Kries — misses by up to ΔE 13.7, which is many times any tolerance a supplier would be held to.

Four ways to move a white point

Every chromatic adaptation transform is the same three lines with a different matrix. The matrices disagree by more than any tolerance a supplier is held to, and the oldest one — still shipping, still called von Kries — is not a cone basis at all.
5 figures
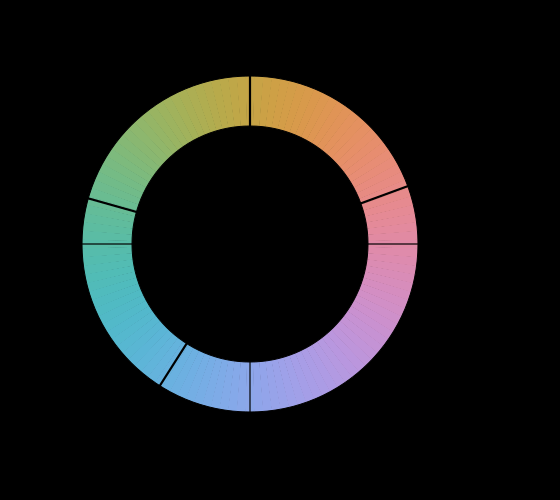
The four unique hues, and the axes they are said to define. A constant-lightness, constant-chroma ring in CIECAM16, with the four unique hue anchors marked and CIELAB's a and b axes drawn through the same circle. If a* really were the red-green axis the anchors would fall on the crosshairs. Unique red sits 25° off, and the four are not 90° apart in any case. Hatched sectors are hues this display cannot reach at this chroma.

Why there are four unique hues

Observers agree that four hues are elementary and that no colour is reddish green. Nothing in the three receptors predicts either fact, and the axes of every standard colour space miss the four by tens of degrees.

5 figures
five greens, no neutral, under D65 — four guesses at the illuminant. The scene's surfaces as they reach the eye, and each estimator's angular error in degrees against the illuminant that actually lit them. Grey-world 43.1°, Max-RGB 27.7°, Shades-of-grey (p = 6) 31.4°, Grey-edge 34.4°. The best here is Max-RGB, which is best because this scene happens to satisfy its assumption — something reflects fully in every band — and not because it is the better algorithm. Any hatched patch is a surface this display cannot show under this light.

The algorithms that guess the light

What reaches a sensor is an illuminant multiplied by a reflectance, and no arithmetic separates a product into its factors. Every white-balance algorithm therefore works by assuming something about the world — and the interesting content of each is not its formula but the assumption, because a scene can violate it.
9 figures
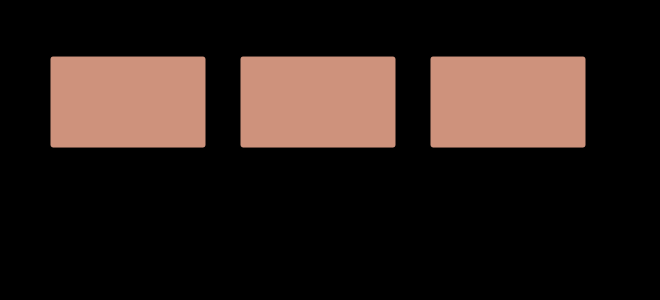
One stimulus, three rooms, three appearances. The same XYZ in a dark, a dim and an average surround. The stimulus does not change and is drawn identically in all three panels; what changes is what CIECAM16 says it looks like. Predicted lightness runs from 65.6 to 57.5 — a spread of 8.1 — with chroma and colourfulness moving too. Colorimetry returns one answer here because it has nowhere to put the room.

A patch is not a scene

A paint chip is the wrong size, on the wrong background, at the wrong luminance, in the wrong surround. Every one of those is a term in an appearance model, and the model says how much each of them moves the answer — which is the difference between a caution and a prediction.
7 figures
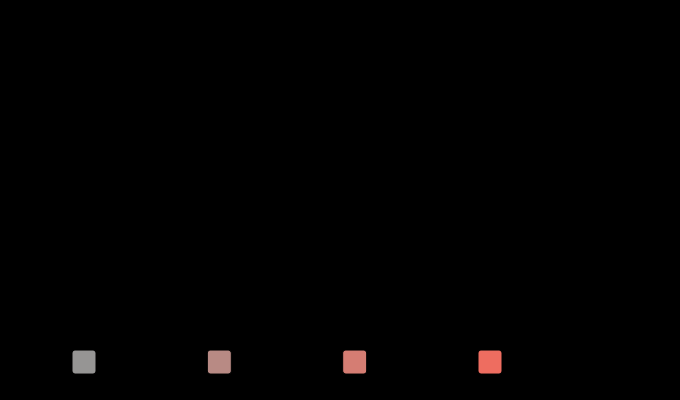
Brightness against chroma, at exactly constant luminance. Seven stimuli of identical luminance and rising chroma at hue 25. The model's brightness moves by 2.2 per cent across the whole sweep, and at some hues it moves the other way. The Helmholtz–Kohlrausch effect — measured repeatedly, by several methods — is that a saturated colour looks as bright as a neutral of 1.3 to 2 times its luminance, shown as the band. The gap is the model's, and nothing here closes it: the term that would is not in CIECAM16 and is not invented for the occasion.

Brightness is not luminance

Photometry is additive because the CIE defined it that way. Brightness is not, and a saturated colour looks as bright as a neutral of one and a half times its luminance — an effect this site's appearance model moves by two per cent, in a direction that depends on the hue.
9 figures
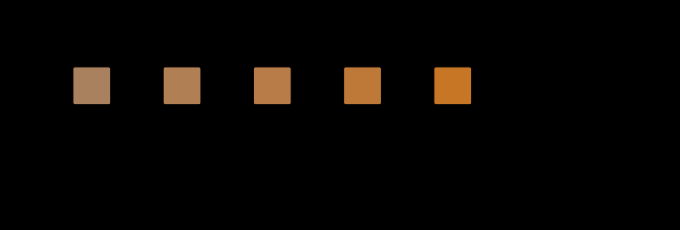
One light, seven rooms. The same stimulus — fixed in XYZ, unchanged throughout — shown against whites from 12 to 800 candelas per square metre. Its lightness falls from 152 to 16 and its brightness rises, because one of those is a ratio to the white and the other is not. Brown is the low-lightness end: a colour that exists only when something brighter is present, which is why no lamp is brown and no star is.

There is no brown light

Brown is dark orange, dark is a ratio to a white, and a light in a dark room has no white to be dark against. The same stimulus, unchanged in XYZ, runs from lightness 152 to lightness 16 as the surround is raised — and only the bottom of that range has a name.

8 figures
One adapting colour, two answers. The left patch is what was stared at. The middle is the afterimage the cone-gain arithmetic predicts at 15 per cent adaptation; the right is the inverted code values. They are 22.1 ΔE00 apart. The gains that produced the middle patch are 0.95, 1.06, 1.69 on the long, medium and short cone classes — the reciprocal of what each class had been receiving, taken 15 per cent of the way.

An afterimage is an adaptation

The demonstration everybody gives is an inverted image, which is a statement about a file format. Running the receptoral arithmetic instead puts the afterimage of a saturated red sixty degrees of hue away from the inverse — and outside what any display can show.

8 figures