Field

Matching and measuring

CIE XYZ, chromaticity, and gamut — a system for predicting when two lights match, frequently mistaken for a system that predicts how they look.

52 essays. Read in order: Gamut · Cones.
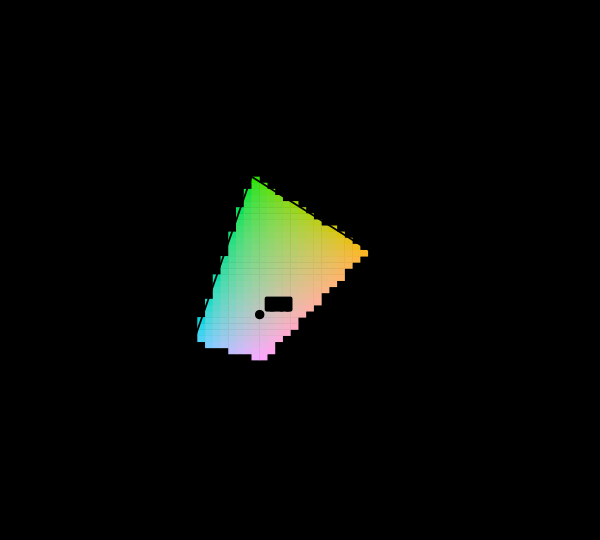
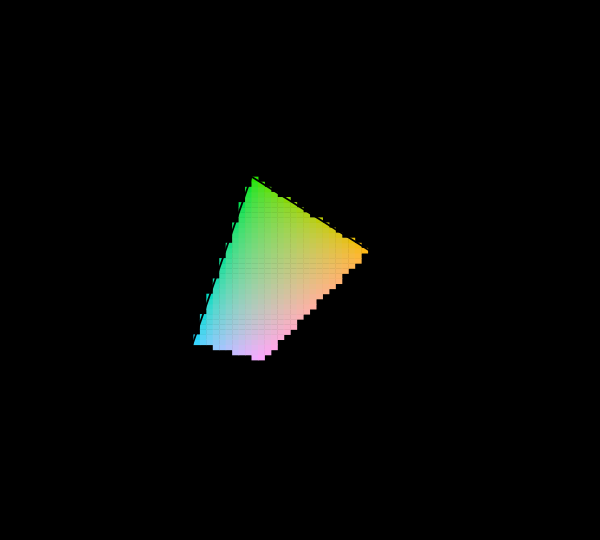
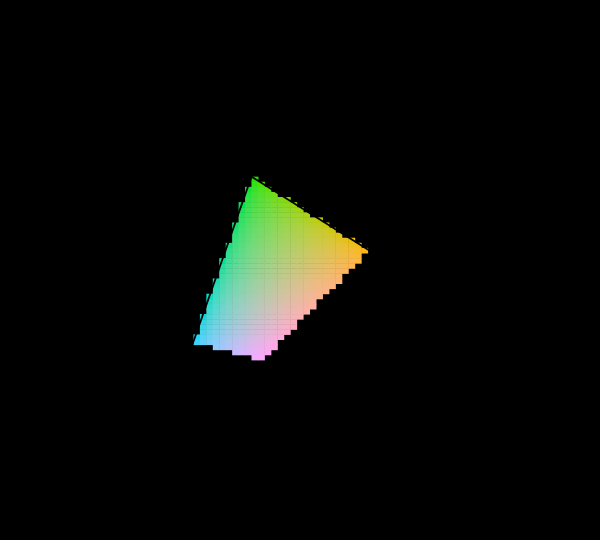
The CIE 1931 chromaticity diagram with its unreachable region marked. The spectral locus encloses every chromaticity a human eye can see. Cells inside the sRGB triangle are drawn in their own colour; the 85 per cent outside it are hatched, because no value this display accepts is the colour belonging there.

Most of this diagram cannot be shown

part 1
Two identical grey patches on different surrounds. Both inner squares are #868686. The one on the dark field looks lighter. The values are checked to be equal before the figure is drawn, so the claim is a fact about the drawing rather than a promise.

Matching is not appearance

part 2
sRGB, Display P3 and Rec. 2020 compared on the chromaticity diagram. Three nested triangles inside the horseshoe. sRGB covers 74 per cent of the area P3 covers. Rec. 2020's red and green primaries sit on the spectral locus itself, within 0.000 and 0.002 of it, meaning they are monochromatic.

What a gamut costs

part 2
The sRGB transfer function, and the gamma 2.2 curve it is not. Code value against relative luminance. The sRGB function is piecewise — a short linear segment near black, then a 2.4 power law with an offset — and it is close to but not the same as a plain 2.2 power law. Half-way along the axis of stored values sits at 21 per cent luminance, and half the luminance of white is at code 188.

A hex code is not a colour

part 2
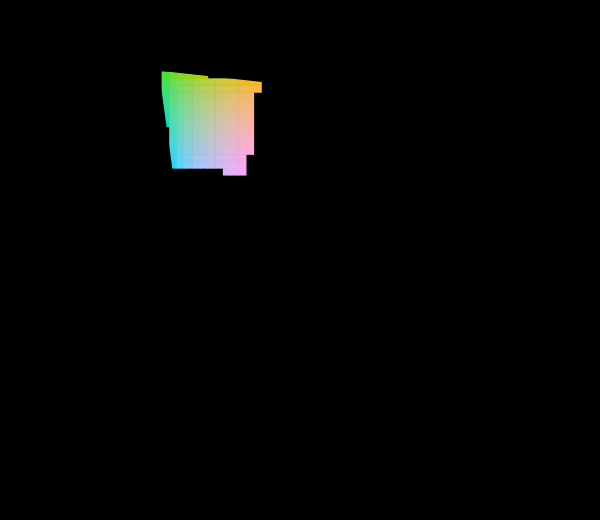
The 1976 uniform chromaticity diagram, with the unreachable region marked. The u′v′ diagram: the same spectral locus and the same sRGB primaries as the 1931 picture, projectively transformed. Straight lines stay straight, so mixtures and the gamut triangle survive; what changes is the distribution of area, and the green region that dominates the 1931 diagram is much reduced. 8% of the cells sampled inside the locus are reachable at Y = 0.55; the rest are hatched.

The diagram was replaced in 1976

part 3
Three lightness scales, seventy years apart. Munsell value, CIELAB's L* and CIECAM16's J against luminance, all rescaled to run 0 to 100. Each is somebody's answer to how evenly spaced lightness steps map onto light. They put the midpoint of the scale at 19.8%, 18.4% and 28.0% of the white's luminance respectively — close enough to be three measurements of one thing, far enough apart to be three measurements rather than one restated twice.

Colour by catalogue

part 3
A 20 nm bandpass, and what it does to the sample. The true reflectance, the same reflectance as a 20 nm instrument reporting every 20 nm returns it, and the slit function responsible, drawn at its own scale around 550 nm. The reconstruction is what every calculation downstream will use, and it differs from the truth by ΔE 2.97 under D65. Nothing in the file the instrument writes marks which values were measured and which were interpolated.

What the instrument reports

part 3
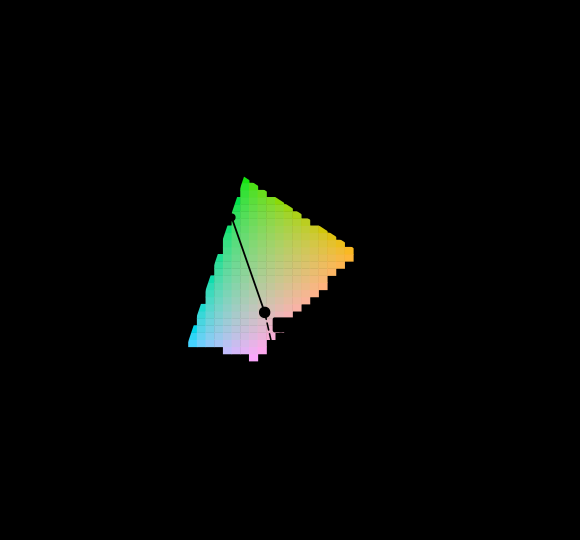
Dominant wavelength as a construction on the diagram, against equal-energy E. A ray is drawn from the white point through each sample and continued until it leaves the diagram. The sample at (0.28, 0.52) leaves through the spectral locus at 537 nm, at excitation purity 0.43. The sample at (0.36, 0.19) leaves through the line of purples, so it has no dominant wavelength at all and is written 544c nm — the crossing on the opposite side, marked with a c. The hatched region is colour this display cannot show and is not drawn as though it could.

Not every colour has a wavelength

part 4
sRGB, Display P3 and Rec. 2020 compared on the chromaticity diagram. Three nested triangles inside the horseshoe. sRGB covers 74 per cent of the area P3 covers. Rec. 2020's red and green primaries sit on the spectral locus itself, within 0.000 and 0.006 of it, meaning they are monochromatic.

Six numbers make a space

part 5
What a coarse wavelength grid costs, by source. Colour error against grid size, for four sources through one reflectance. Daylight survives every grid tested: 0.67 ΔE00 even at 40 nm. A source with lines in it does not — the narrowband source reaches 16.2. The grid is not a property of the arithmetic; it is a claim about what the light has in it.

Five nanometres is a choice

part 4
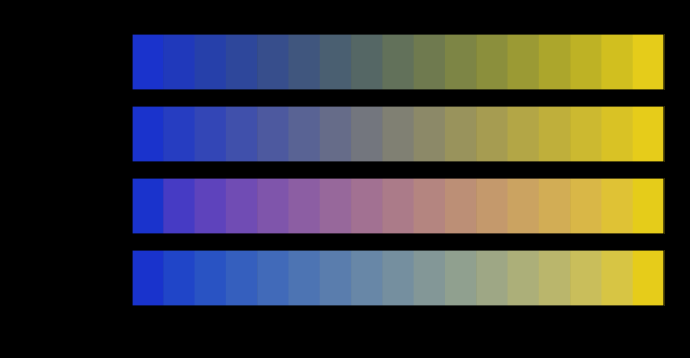
One pair of colours, blended in four spaces. Every row starts and ends at the same two colours and visits different ones in between. The chroma of the middle falls furthest in linear light, by 83 units below the straight line between the endpoints' chromas — the grey dead zone that every blue-to-yellow gradient has and that no endpoint mentions. Any colour a route visits that this display cannot show is hatched rather than clipped.

A gradient is a path

part 3
Grassmann's four laws, exact — and the two things that break them. For a linear observer every one of the four is exact and the residual is floating point, which is the control that makes the two failures below measurements rather than artefacts. Rods break a cone-metameric match by 23 per cent of a rod excitation at dusk; bleaching breaks it by 0.59 per cent of a cone excitation in the sun. Both are stated as fractions of a receptor's own response, so they can be put on one scale.

The laws that make colour add up

part 5
One match, and what it says about the observer making it. The anomaloscope: a monochromatic 589 nm yellow set against a mixture of 545 and 670 nm. Only two cone classes respond at those wavelengths, so the match is two equations in two unknowns and has one solution for any observer whose two pigments differ. The bar is the fraction of the accepted band; the mark is the solution. A normal observer accepts 0.7 per cent of the scale; an observer whose two pigments are the same accepts all of it, because their two equations are one equation twice. Nothing here is fitted to clinical data: the pigments are the same template used for every observer here, at stated peaks, and the match is the solution of the linear system.

One match names the observer

part 4
A colour-order system's chips, sorted by what they would be called. A regular lattice in lightness, chroma and hue — the idealisation of a swatch book, and regular by construction because a person has to be able to find a page. Named, it comes apart: 1320 chips inside the gamut divide into 198 for grey and 66 for blue. And 22 per cent of one-step moves in the lattice change the name, so a page of a swatch book is not a page of a vocabulary.

A catalogue is not a vocabulary

part 4
A fourth primary, swept — every setting an exact match, none of them the same. Four primaries matching three numbers leave one degree of freedom. Along the horizontal axis it is the fourth primary's share of the white's luminance; at each value the other three powers are solved exactly, so every point on this plot is a floating-point-exact match for the reference member — worst residual 1.3e-15 — and no colorimeter can tell them apart. What the population sees runs from 13.7 ΔE00 at the ninety-fifth percentile to 17.3, a factor of 1.26. The best setting is the largest share the arithmetic admits, so what stops it is not colour but the requirement that four powers stay positive.

Four primaries have a choice

part 5
What a fourth primary actually buys. All three displays are floating-point-exact matches for the reference observer, so no colorimeter can tell them apart. The bars are the 95th percentile of what two hundred other eyes report. Held to the same gamut floor of 1.4× sRGB, the four-primary design leaves the population 2.6 times closer together than the three-primary one. That is what the extra emitter is worth, and it is not more colour — the gamut is held fixed while it is measured.

A fourth primary is a design

part 6
Which of these paints the display can show, and to how many people. Each row is a real surface under D65, and the bar is the share of 120 observers for whom a non-negative mixture of this display's three primaries reproduces it. The question has no observer-free answer: the paint is a reflectance, the primaries are emission spectra, and whether one matches the other is a fact about somebody's cones. A dot marks the rows the 1931 observer calls displayable. 2 of them are rows some real people cannot see, and 4 more go the other way.

A gamut has a population

part 7
The same twenty-four samples, measured two standard ways. How far apart a 45°/0° instrument and a sphere with its gloss port closed are, on samples running from three per cent reflectance to seventy. The whole of the difference is the interface reflection — four per cent of the light, returned without ever meeting a pigment, thrown away by one geometry and collected by the other. It is the same four points in every row, which is why the disagreement is a property of how dark the sample is rather than of what colour it is: ΔE00 8.7 on the darkest samples against 1.93 on the lightest.

An instrument has a geometry

part 7
A radiance factor, split into the part that was reflected and the part that was not. The two components of what leaves a heavily brightened sheet under M₁ — D50 including its ultraviolet. The lower band is the reflected component, which is what a reflectance curve means and is everything a reflectance-based model can hold. The band above it is light emitted at wavelengths it did not arrive at, and its total is decided by how much ultraviolet the source had rather than by anything about the sheet's colour. The line at one is the boundary a reflecting surface cannot cross; the sum reaches 1.21 at 430 nanometres.

The eye weights where the light is not

part 7
The locus and the triangle, drawn on one of the diagrams. The spectral locus and the sRGB triangle in CIE xy (1931) — the default of the discipline, and the default used here. The triangle covers 33.6% of the enclosed area here. Nothing about the observer or the display has changed between this picture and any other in the family; the coordinates have, and the coordinates are what an area is measured in.

The diagram has no area

part 8
What share of the diagram the sRGB triangle covers, in twelve published coordinate systems. Each row is a chromaticity diagram somebody has printed, and each bar is the fraction of the enclosed visible area that the sRGB triangle covers in it. Every row describes exactly the same observer and exactly the same gamut. The answer runs from 8.5% to 38.4%, a factor of 4.52, because area is not preserved by the projective maps that carry one of these diagrams to another. The familiar "about a third" is a fact about CIE xy.

Two thirds is not a property of the eye

part 9
A display's primaries, scored as the adaptation basis they are. Four primary sets ranked by the mean ΔE00 an adapted observer is left with when the white point moves — which for a display is a gain on R, G and B, and so a von Kries adaptation in the inverse of its own primary matrix. sRGB leaves 2.36, as much as scaling XYZ directly and therefore as much as having no cone basis at all. Rec. 2020 leaves 1.09, better than every published adaptation transform fitted to corresponding-colour data. Nobody chose that: it is what wanting a wider gamut does to a primary's spectral selectivity.

The gamut race chose the basis

part 10
The bowl the eigenvalues describe and the bowl a sample found. Six points on a logarithmic vertical axis — the distance from the optimum of the adaptation residual to a 5 per cent rise along each of the six directions the objective can see — with a shaded band behind them showing the whole range 24 random directions reported. The eigen-radii run from 1.2e-2 to 3.6e-1, a factor of 29.8. The band runs from 2.2e-2 to 1.8e-1, a factor of 8.0, and sits entirely inside the ends of the true range: a random direction in nine dimensions carries a share of every eigenvector and so reports the middle of the bowl, never an end of it.

How long is the bowl

part 11
How far a fitted transform is from anybody's eyes. Five groups of three bars: for each published adaptation transform, the distance from the population's own cloud to the confusion point that transform is committed to, measured in the population's standard deviations on that point. On the protanope's point every one of them is between 2.2 and 14.4 out, and on the deuteranope's between 3.7 and 11.8. On the tritanope's, 5 of the five are within three standard deviations — indistinguishable from a member of the population. The claim that these matrices are not cone responses is safe, and the evidence for it is two points out of three.

Two points out of three

part 11
What a display's red primary is allowed to be, under four requirements at once. A close view of the chromaticity plane around one designed primary, 0.101 units across. Four outlines: the set of positions the primary can take before each of four requirements gets one per cent worse — how well a gain in the display's own basis undoes a change of light, how much of the diagram the three primaries enclose, how many real surfaces fall inside them, and whether a light of that colour exists at all. The shaded region is where all four hold. It is 5% of the smallest outline's area, because the outlines are long and thin and cross at an angle rather than nesting. adaptation holds 42% of its boundary, gamut holds 10% of its boundary, realisable holds 48% of its boundary.

A primary is chosen for four things

part 10
The same tolerance, in the two numbers somebody actually sets. The plane a maker of a single-peak emitter works in: peak wavelength across, full width at half maximum up. Each marker is a candidate emitter whose chromaticity falls inside the colorimetric tolerance drawn for this display's green primary. They occupy a narrow band — peaks from 528 to 535 nanometres, a span of 7, against widths from 25 to 45 — so a tolerance stated as a region in chromaticity becomes ±3.5 nanometres of peak and a great deal of latitude in width. 2.0% of the 2501 candidates land inside at all: most of a region drawn in chromaticity is a colour no single-peak emitter makes.

A tolerance in the wrong coordinates

part 11
Exactly flat everywhere, and eigenvectors at one point only. Two columns over the same nine places. On the left, how far from zero the objective's second derivative is along a row-scaling direction, on a logarithmic axis — it is between 10⁻⁹ and 10⁻⁶ of the largest eigenvalue at every one of them, which is a numerical zero. Scaling a row of the basis is a straight line along which the cost does not change, and that is true at every point, not only at the optimum. On the right, the angle between those three directions and the Hessian's own three smallest eigenvectors: 0.025 degrees at the optimum and up to 88 away from it. An invariance is a property of the function; being an eigenvector is a property of the function at a minimum, and the two coincide only where everybody computes.

Only the flat directions keep their names

part 11
A published residual is a mean, and the worst object in the room costs twice it. Three bars for each of the 14 changes of light in the adaptation census, ordered by how uneven the change is across surfaces. The first bar is the published mean residual. The second is the worst single surface in the audit's published test set. The third is the worst surface anywhere in the region that set is drawn from, found by search rather than by reading a maximum off a lattice. The mean-to-worst ratio runs from 1.90 to 4.02 and averages 2.43, so every published adaptation number has a worst case about twice it that no essay had ever quoted. The gap between the second and third bars is the other finding: a maximum over 125 sampled points understates the region's own maximum by up to 34 per cent.

An extremum is still not a sample

part 12
What six of this collection's published numbers do when the unit changes. Six quantities, from six calculations that share nothing: a change of light after an observer has adapted, a camera profile's error, the gap between the two standard observers, a metameric pair under the lamp that breaks it, the same image on two papers, and an observer two seconds into a new room. Each is recomputed under all six units and every unit is calibrated onto ΔE2000's scale first, so the bar is not a change of units in the ordinary sense. The bar is the ratio of the largest reading to the smallest, and it runs from 1.71 to 2.30. Five of the six are printed in ΔE2000 by the essays that report them; the sixth is printed in CAM16-UCS, because the model it comes out of defines that unit.

The observers differ by a unit's worth

part 12
MacAdam's twenty-five ellipses, measured in each unit. The uniformity instrument used here, applied to units rather than to spaces. The upper bar is anisotropy — the mean over the twenty-five of the largest radius divided by the smallest, where 1 would be a circle. The lower is spread — the largest mean radius divided by the smallest across all twenty-five, which asks whether a step of the same size means the same thing in different parts of the diagram. Reading down the three CIELAB-based formulae in the order they were published, the anisotropy falls 3.42 → 2.89 → 2.74 and the spread rises 3.24 → 3.59 → 4.12: the weighting divides a difference by the chroma it was measured at, which equalises directions at a point and unequalises magnitudes between points. Neither number is scaled, so no calibration is applied here. CAM16-UCS is ahead on both.

A unit rests on a space that was ranked

part 13
Two slabs with one reflectance, and two colours through an aperture. Two constructed media whose bulk reflectance agrees at every wavelength to fifteen figures, and whose diffusion lengths differ by a factor of four. The upper curve is that shared reflectance — both slabs lie on it exactly. The two patches on the right are what a 4 millimetre radius returns from each, and they are 6.3 ΔE₀₀ apart. This is a metamerism with no observer in it: the two samples are the same colour to anybody under any light, and the instrument separates them because it is measuring a kernel through a hole rather than measuring a reflectance.

A pair the aperture separates

part 12
What this collection's grid does to its own observer audit. Two bars per light: the mean departure of the observer computed on this collection's five-nanometre grid, and the same computation on a quarter-nanometre one. For five of the six lights the two agree to two decimal places, which is what a well-sampled spectrum looks like. For the laser projector the coarse answer is exactly zero and the fine one is 1.80 — the largest in the table. On a five-nanometre grid a three-line spectrum with lines at 465, 532 and 638 nanometres is a one-line spectrum, and a single wavelength is a stimulus every observer agrees about to the last bit. The two departures do not compound here; the first conceals the second.

One wavelength is everyone's colour

part 13
The same white, matched at six primary widths. At every width the three primaries are solved to match D65 exactly for the reference member; the bands are what the population sees. A broad primary integrates the observer differences over a band and averages them away; a narrow one samples them at a point and passes them straight through. From 40 nm to 2 the ninety-fifth percentile rises from 11.3 to 17.9 ΔE00, monotonically, and the technology has been moving from left to right for thirty years.

A narrow primary buys a disagreement

part 14
One surface dimmed sixteen times, and the two things that happen to it. A single surface, dimmed by successive halvings, with the lens age departure measured on it at every level. The tristimulus deviation falls by exactly the dimming factor — 16 times over the sweep, to the last bit, because the colour integral is linear in the stimulus. What a unit of that deviation is worth rises by 8.2 times over the same sweep. The colour difference the audit reports is the product of the two, and it falls by only 1.95.

A deviation is not a difference

part 15
The angle between two departures, which nothing in the audit records. Every pair of the six departures on every surface — 2520 pairs — binned by the angle between their two deviations in the local metric. The distribution reaches both ends: 440 pairs sit under thirty degrees and point almost the same way, and 615 sit above a hundred and fifty and point almost opposite. On 1095 of the 2520 the two together cost less than the larger of them alone. A table of magnitudes cannot say which case it is in.

A size is not a direction

part 16
The straight piece under the cube root, and where it stops. CIELAB's lightness against relative luminance, over the bottom 5.0 per cent of the range. Below Y = 0.008856 it is a straight line of slope 7.787; above it, a cube root. The two meet at L* 8 in value and in slope, exactly — the CIE's two constants are chosen to make that true. The dashed curve is the pure cube root, which reaches negative lightness before it reaches zero luminance and has an infinite slope there. The break is marked, and the axis runs to Y = 0.050.

The straight piece under the cube root

part 16
What one tolerance accepts, around four colours. The surface in tristimulus values that ΔE₀₀ 1.0 draws around four colours, each outline scaled to its own size so the shapes can be compared. The volumes they enclose differ by a factor of 1.0e+5 across the sRGB cube, and the longest axis of one shell is between 3.3 and 29.9 times its shortest. A tolerance is written as one number and is a different set of samples at every colour it is applied to.

What one number accepts

part 17
What a code lattice costs, and where. Twelve thousand colours quantised to 8 bits per channel through the sRGB transfer function and read back, with lightness across the bottom and the colour difference the rounding cost up the side. The mean is 0.191 and the worst case is 1.15, a factor of 6.0. The bars are band means, and they rise: the encoding spends its codes in the shadows, so the top of the ramp is where the lattice is coarsest against a metric that does not compress as hard.

A lattice has no derivative

part 17
Two primaries mixed, and the line a reader assumes they take. The additive mixture of two sRGB primaries, walked in twenty steps, plotted in the a and b of CIELAB. The filled points are where the light actually goes, which is exactly straight in tristimulus values because that is Grassmann's second law. The open points are the straight line between the two readings. They part company by 26.7 ΔE₀₀ at their furthest, at 60 per cent of the way along, and the half-and-half mixture misses the midpoint by 21.1.

The mixture line bows

part 18
Which way each tolerance is tightest, colour by colour. Sixty-four colours on a lattice through the sRGB cube, with lightness across the bottom. For each, the tolerance ΔE₀₀ 1 is pulled back into tristimulus values and its shortest and longest axes are found. The filled points are the angle between each colour's shortest axis and the direction common to all of them: a median of 15 degrees, ninety per cent within 32. The open points are the same for the longest axis, at 23. The common short axis is 3.1 degrees from X up and Y down, which is the direction of a*.

A tolerance has a grain

part 18
What a small neutral deviation costs as the grey darkens, in two lightness scales. The price of a fixed fraction of deviation on a neutral — how much lightness it is worth per unit of luminance — from L 40 down to L 0.25, both axes logarithmic. CIELAB's L is a straight line below L 8 and its price there is exactly flat. The appearance model's J′ has no straight piece: its price keeps rising, by a factor of 5.0 across the same range, as the luminance to the power -0.442 — the derived exponent is -0.441 in an average surround.

The appearance model has no straight piece

part 17
Four mixtures of display primaries, bowing by different amounts in two units. The half-and-half mixture of each pair of sRGB primaries, measured from the midpoint of the two readings as a share of the pair's own separation. The upper bar is ΔE₀₀ and the lower is the appearance model's J′a′b′. In ΔE₀₀ green and blue bows most, at 25 per cent; in the model it is red and blue, at 20, and blue and yellow falls from 22 to 12. The right-hand column gives the model's distance with its power correction, which is smaller than the Euclidean one for every pair here.

Which mixture bows most depends on the ruler

part 19
Where a press's variation lies, and where the tolerance charges for it. Each printed patch's sheet-to-sheet variation under four stated mixes of press variation, split along the three axes of a one-unit ΔE₀₀ tolerance at that patch, tightest first. The upper bar of each pair is the share of the variation along each axis and the lower the share of the price, averaged over 29 patches. For an even mix the tightest axis holds 1.5% of the variation and pays 29% of the price, and the loosest holds 83% and pays 36%. For inking alone the tightest axis holds 2.0% of the variation and pays 34% of the price, and the loosest holds 79% and pays 28%. For a gain-led press the tightest axis holds 1.8% of the variation and pays 29% of the price, and the loosest holds 83% and pays 39%. For a trap-led press the tightest axis holds 1.6% of the variation and pays 29% of the price, and the loosest holds 82% and pays 35%.

A press is charged for the direction it barely moves
part 19
The straight line between two colours, and the formula's own shortest path. Five gradients seen from above, in the a and b plane of CIELAB: the straight line between the two colours in grey, and the shortest path under ΔE₀₀'s own local metric in colour. The lightness coordinate bows too and is not drawn. red to green saves 3.6 per cent and leaves the straight line by 13; blue to yellow saves 7.5 per cent and leaves the straight line by 21; cyan to magenta saves 3.9 per cent and leaves the straight line by 10; black to white saves 0.0 per cent and leaves the straight line by 0; red to blue saves 0.3 per cent and leaves the straight line by 4 CIELAB units at the widest. Black to white is the flat case: its shortest path is the straight one.

The straight line is not the shortest gradient

part 20
The metamerism index, computed three ways, as the reference match loosens. The special metamerism index of 6 metameric pairs under an incandescent test light, against how well each pair matches under the reference light. Uncorrected, the index absorbs the reference mismatch and rises from 2.86 to 3.76. Corrected multiplicatively it rises to 3.31 and additively to 3.87. All three are the same number when the pair matches exactly, which is the only case the definition covers.

The metamerism index has two corrections

part 20
Two uniform spaces, two answers: cyan to magenta. The gradient from above, in the a and b plane. The grey line is the straight path in CIELAB; the two coloured curves are the shortest paths under ΔE₀₀'s own local metric and under CAM16-UCS's. They are 15.7 CIELAB units apart at their furthest, against bows from the straight line of 9.9 and 12.2. Both spaces are published as uniform and both are used to decide what lies between two colours; they do not agree.

Two uniform spaces disagree about between

part 21
What a gamut charges a gradient, against what the relaxation's noise is. For each gradient, how much longer the best path that stays inside sRGB is than the free shortest path, as a percentage of the free one. The shaded band is the relaxation's own noise, measured by relaxing the same free path from two different starting points: 0.42 per cent at its worst. Every excess is inside it. So holding a gradient inside a display's gamut costs nothing measurable in the metric's own units, on any of these pairs — including the ones whose free path is outside at most of its points.

A gamut charges a gradient nothing

part 21
How often the choice of correction changes a pair's grade. Eighteen metameric pairs walked to each of eleven reference mismatches, with the share whose index falls in a different band under the two corrections the standard allows. At an exact match the share is zero and must be: there is nothing for either correction to correct. It rises to 44 per cent at a reference mismatch of 2, which is the quality a dyehouse reaches rather than the quality a laboratory constructs. The banding is a five-step convention at 0.5, 1, 2 and 3, stated here rather than quoted, and how much the count depends on it is drawn separately.

The ambiguity is largest where the index is used

part 21
Three uniform spaces, three answers: red to blue. The gradient from above, in the a and b plane: CIELAB's straight line, and the shortest paths under ΔE₀₀'s local metric, under CAM16-UCS's and under Oklab's, whose shortest path is its own straight line carried back into CIELAB. They bow from CIELAB's line by 14.4, 42.5 and 42.6 units. ΔE₀₀'s and CAM16-UCS's paths run 28.3 apart at their furthest, Oklab's runs 29.0 from ΔE₀₀'s and 5.6 from CAM16-UCS's, and the space furthest from the other two here is ΔE₀₀.

A third space breaks the tie only once

part 22
Six starts for every held gradient, and where each one lands. Each row is one gradient held inside a gamut, relaxed from six starts: the straight line, the free shortest path, and the straight line bent towards and away from the neutral axis and up and down in lightness. Each dot is how much longer than the free shortest path that start's result is, on a logarithmic scale from a hundredth of a per cent to a thousand; the ring marks the best. The first 10 rows are gradients between colours on a coated CMYK press's boundary whose straight line leaves the press: their best routes cost a median of 0.12% and at most 1.1%, and on 5 of them some start lands at more than twice the free length. The next 3 are the display gradients held inside sRGB, whose best cost at most 1.3% and whose starts spread by at most 4.2%. The last 6 are press gradients that never leave, where no start is trapped.

A press makes the cheap route a search

part 22
The same gradients, priced by a penalty and by a projection. Each row is one gradient held inside a coated press from six starts. The pale dots are the penalised relaxation — a free step, with a price for leaving the press — and the dark ones are the projected relaxation, which takes the free step and then moves each point to the nearest printable colour. Across is how much longer than the free path each result is, logarithmic. On the 10 gradients whose straight line leaves the press, the penalty leaves 9 starts at more than twice the free length and the projection leaves none. The projection's best route costs a median 0.02% against the penalty's 0.13%, and its spread across starts is 0.95% against 132.5%.

A projection has no reason to detour

part 23
How much of a coated press is left at each margin inside its boundary. The share of a coated press's printable volume in CIELAB that lies at least a given distance inside its boundary, for margins from half a unit to 32. A margin of one unit keeps 88%, two keep 80%, four 66% and eight 45%. At every margin up to 30 what is left is a single connected piece; at 31 units, with 0.14% of the volume left, it first splits, into a core of 623 cells and 2 fragments of one or two cells — the deepest point is 32.7 units inside, so what splits is the last crumb of the core, not a waist.

A margin costs a press its corners

part 24

All essays