A gamut has a population
Assumes A fourth primary is a design and What a gamut costs.
Every gamut on this site so far has been computed for one observer, and there is only one of him. The primaries are chromaticities the 1931 observer produced, the solid is a volume in a space built on his matching functions, and the number that comes out — 1.357 times sRGB by area, 2.261 by volume — is a fact about a set of tables published in 1931.
That is fine as long as the question is how big. It stops being fine the moment the question is the one a gamut is actually asked in practice, which is: can this screen show this paint?

The claim
Whether a colour is inside a display’s gamut has no observer-free answer, so a gamut boundary is a band whose width is set by the primaries.
- The question is well posed per observer and only per observer. The paint is a reflectance, the primaries are emission spectra, and whether a non-negative mixture of the second reproduces the first depends on whose cones are integrating them.
- On an LCD, six of twenty-eight boundary surfaces are disputed. Two of those are ones the standard observer calls displayable — including one that only a quarter of the population can be shown.
- The narrower the primaries, the wider the band. An LCD disputes 21 per cent of the boundary set, an OLED 43 per cent and a laser projector 46 — and the number the standard observer calls displayable-but-not-for-everyone goes 2, 6, 10.
- So a wider gamut is a weaker claim about everybody, which is the same trade the multi-primary work found from the other side, arrived at here with no search and no optimisation.
- And it goes both ways: four surfaces the standard observer calls out of gamut are inside it for part of the population.
Why the question is per-observer
A gamut is usually drawn as a triangle on a chromaticity diagram, and a triangle is a region of a plane that exists independently of anybody. That is what makes the observer’s role easy to miss.
The triangle’s corners are where the display’s three emission spectra land, and where a spectrum lands is the result of integrating it against three matching functions. Change the functions and the corners move. So the same screen, unchanged in every physical respect, has a different triangle for every person looking at it.

The target moves too, and not by the same amount. A paint’s chromaticity is the same integral applied to a different spectrum, so a surface and a primary do not move together — which is exactly why the containment question, rather than the position question, is the one that has no shared answer.

What is measured, and how a surface is decided
The test is the definition rather than a proxy. For each observer, take the tristimulus values of the target surface and of the three primaries, solve the 3×3 for the primary weights, and ask whether all three come out non-negative. Inside the gamut means a non-negative solution exists; outside means it does not.
The surfaces are constructed rather than sampled — coloured reflectances at seven centre wavelengths and four widths, so the set runs from comfortably inside any gamut to well outside all of them, and the interesting members are the ones near the edge. A narrow reflectance is a saturated one, and it is the narrow ones that fall near the boundary. Real surfaces are broader than the narrowest of these, which is why most things cannot be very colourful.
The disputed rows
An LCD disputes six of the twenty-eight, and the two that matter most are the ones the standard observer approves.
One is a 600 nm reflectance 30 nm wide, which 94 per cent of the population can be shown: an ordinary saturated orange, displayable for almost everybody and not for one person in sixteen. The other is a 600 nm reflectance 70 nm wide — a broader, less saturated orange — which only 25 per cent of the population can be shown while the standard observer calls it displayable without qualification.
That second row is the one worth pausing on, because it is the wrong way round. The naive expectation is that disagreement concentrates on the most saturated samples, and it does not: a broad reflectance near the boundary sits where the display’s red primary and the observer’s L fundamental interact most sensitively, and a small difference in the fundamental moves the surface across the edge.

The wider the gamut, the weaker the claim
Across the three display technologies the ordering is strict and it is the uncomfortable one.

An LCD, with primaries averaging 52 nm wide, disputes 21 per cent. An OLED at 31 nm disputes 43. A laser projector at 2 nm disputes 46, and has five times as many rows the standard observer calls displayable and part of the population cannot see.
The mechanism is the one the population essays established: a narrow emitter samples a steep part of the cone fundamentals, so the between-observer variation in where the fundamental sits translates directly into variation in what is caught. A broad emitter averages over that variation.
So the marketing quantity and the engineering quantity move in opposite directions. Rec. 2020’s primaries are chosen to enclose more of the chromaticity diagram; enclosing more of it requires narrower primaries; narrower primaries mean the enclosure is a statement about the standard observer that fewer real people share.

The four rows going the other way
Four surfaces are outside the LCD’s gamut for the standard observer and inside it for part of the population, and they deserve mentioning because they show the effect is a band and not a bias.
A gamut computed for one observer is not systematically optimistic or systematically pessimistic. It is a line drawn through the middle of a distribution, and for surfaces on one side of it some people are more capable than the standard and on the other side some are less. Reporting only the standard observer’s answer discards the width, and the width is larger than most of the differences between competing display standards.
The band does not merely widen — it becomes one-sided
The three technologies are compared on how much of the boundary set they dispute, and that column tells only half of what the three tables contain. Splitting each dispute count by which way it runs:
| display | primary width | disputed | standard observer says yes | says no | share running his way |
|---|---|---|---|---|---|
| LCD | 52 nm | 6 | 2 | 4 | 33% |
| OLED | 31 nm | 12 | 6 | 6 | 50% |
| laser | 2 nm | 13 | 10 | 3 | 77% |
On an LCD the standard observer is optimistic about a third of the disputes and pessimistic about two thirds; on a laser projector he is optimistic about three quarters of them. The band is not symmetric about him and it becomes less so as the primaries narrow.
That qualifies the section on the four rows going the other way, which is written from the LCD’s numbers and concludes that a single-observer gamut is not systematically optimistic or systematically pessimistic. On the LCD it is not. On the laser projector it is: ten rows where he approves and part of the population cannot be shown the colour, against three where the reverse holds.
The mechanism follows from what the population model varies. A narrow primary lands on a steep part of a fundamental, and most of the population’s variation moves a fundamental’s peak — so most observers catch less of a narrow primary than the standard observer does, in whichever direction their peak has moved, because the standard observer’s peak sits where the mean is and the primary is placed against it. Losing catch on a primary shrinks a triangle. A population’s triangles are mostly smaller than the mean observer’s, not scattered evenly around it, and the effect grows as the primaries narrow.
Almost all of the disagreement arrives before the lasers do
The dispute rate rises 21 → 43 → 46 across the three, and the widths fall 52 → 31 → 2 nanometres. Those two sequences are very unevenly matched.
The first step narrows the primaries by a factor of 1.7 and adds 22 points of dispute. The second narrows them by a factor of 15.5 and adds 3. Eighty-eight per cent of the total rise happens in the first, much smaller narrowing.
So the boundary the essay’s argument turns on is not between ordinary displays and exotic ones. It is between an LCD’s colour filters at about fifty nanometres and an OLED’s emitters at about thirty — two technologies both sold as ordinary consumer displays, differing by less than a factor of two in primary width, with twice the boundary disagreement between them. A laser projector is a dramatic example of an effect that has already substantially happened by the time a panel is an OLED.
The saturation at the narrow end is worth reading as well. Going from thirty-one nanometres to two buys almost no further total dispute, which suggests the boundary set has a limited number of members near enough to any edge to be disputable at all, and that an OLED has already found most of them. What the laser adds is not more disputes but a change in their character, which is the previous section’s finding: it converts pessimistic disputes into optimistic ones.
The broader orange is worse by a factor of four
The two rows the essay singles out deserve their ratio stated. At 600 nanometres, the reflectance 30 nanometres wide reaches 94 per cent of the population and the one 70 nanometres wide reaches 25 — a factor of 3.8, with the less saturated sample being the one nearly three quarters of observers cannot be shown.
That is the observation the essay calls the wrong way round, and its size is what makes it more than a curiosity. A rule of thumb that saturated colours are the risky ones would rank these two exactly backwards and would be wrong by a factor of four on the quantity that matters.
It also has a practical edge the essay does not draw. A designer choosing a safe colour by moving away from the gamut boundary is moving along the wrong axis: desaturating a boundary orange moved this pair from 94 per cent of observers to 25. Whether that generalises is not established by two rows, and it is enough to say that the naive direction is not reliably the safe one — which is the only advice a single-observer gamut is incapable of giving, since for the standard observer both of these are simply inside.
What a display standard would have to say
A display standard states a set of primary chromaticities and a white point, and everything downstream treats those as the definition of the device’s capability. The measurement here says the definition is incomplete in a way that is not a matter of tolerance.
Two panels can hit the same nominal primaries with different spectra — a quantum-dot backlight and an OLED emitter can land on the same point in the diagram with bands of very different widths — and they are then the same display to the standard and different displays to a population. The narrower one disputes twice as much of its own boundary. Nothing in the specification distinguishes them, because chromaticity is the only thing it records and chromaticity is exactly the quantity that has been averaged over the observer.
The fix is the one this site keeps arriving at from different directions: state the spectra. A display characterised by three emission spectra can have all of this computed for it; a display characterised by three chromaticities cannot, and no amount of care with the chromaticities recovers it. That is the same argument the fourth-primary work made about designing a display, applied to describing one.
It is also the same argument as the metamerism index in surfaces, where the industry did eventually accept that a colorimetric specification of a pair is not enough and added a spectral one. Displays have not made that move.
What it does not say
It is worth being explicit about what this measurement does not establish, because the obvious over-reading is available and would be wrong.
It does not say that a quarter of people cannot see an orange. Every observer here can see every one of these surfaces perfectly well — what is at issue is whether a particular display can reproduce it for them, which is a statement about a manufacturing decision and not about anybody’s vision. A surface outside somebody’s gamut still has a nearest reachable colour, and for a boundary surface that colour is close.
Nor does it say the standard observer is wrong. He is a mean, he behaves like one, and the four rows going the other way are the evidence for that. What the measurement says is that a mean reported without its width, used to answer a question decided at a boundary, produces a binary answer that is right for the mean and wrong for a stated fraction of everybody else.
Doubling the number of members drawn is the check that the band’s width is the population rather than the sample.

What a buyer could ask for instead
A display is bought against a coverage number: ninety-eight per cent of P3, seventy-five per cent of Rec. 2020. Those are areas of a chromaticity diagram computed for one observer, and everything in this essay says they are the wrong shape of quantity.
The right shape is available and costs nothing extra to compute. For a stated set of surfaces, report the share of a population the display can reproduce each of them for — which is exactly the figure this essay’s first picture draws. It is a distribution rather than a percentage, it degrades gracefully as primaries narrow rather than improving misleadingly, and it can be computed from the three emission spectra a manufacturer already measures.
Two things follow that a coverage number cannot express.
The first is that two panels with identical coverage numbers can differ substantially on it. A quantum-dot backlight and an OLED can hit the same nominal primaries with bands of very different widths; they are the same display to a coverage figure and different displays to a population, and the narrower one disputes roughly twice as much of its own boundary.
The second is that the quantity has a natural threshold where coverage has none. Reproducible for ninety-five per cent of observers is a sentence a specification can contain and a purchaser can check. Ninety-eight per cent of P3 is a sentence about an area, and an area has no observers in it at all.
None of that requires a new measurement, a new instrument or a new standard observer — only the three spectra and a population model, both of which exist. What it requires is agreeing that the question a gamut answers is can this be shown to somebody, and that a number reported without the somebody has answered a different question.
Who found it, and when
Observer metamerism has been a known problem for wide-gamut displays since the first laser and narrow-LED projectors were built, and the CIE published a set of individual colour matching function models partly in response. The standard treatment computes a metamerism index for a display: how far apart two observers see the same nominal white or the same nominal colour.
The framing here is different in one respect. A metamerism index asks how far apart two people are on a colour both can see. This asks whether they agree on the containment question, which is a binary and which is the question that governs whether a colour appears in a product at all. Those two are different because containment is decided at a boundary, and a small disagreement at a boundary is a total disagreement about the answer.
What was computed, and how
A hundred and twenty observers are drawn from this site’s population model, which varies five measured quantities — lens age, macular density, photopigment optical density and the peak wavelengths of the three pigments — around a reference member. Each observer’s tristimulus values come from their own cone absorptances through one fixed cone-to-XYZ matrix, so a difference between two members is a difference in what their cones caught and never a difference in bookkeeping.
The display primaries are Gaussian emission bands at the centres and widths this site’s three display technologies are defined by. The surfaces are coloured reflectances under D65.
The gate requires at least two surfaces to be disputed and at least one of them to be a surface the standard observer approves, and separately requires the narrowest-primary display to dispute more of the set than the widest — so a change to the population model that quietly removed the effect, or reversed the ordering, would stop the build.

Where it stops
The population model is a construction. Its five parameters are measured, but a real population differs in ways this model does not carry — colour vision deficiency of any degree is not in it at all, and neither is any correlation between the parameters.
The surfaces are constructed too, and the specific percentages are properties of that set. What is not a property of the set is the ordering across display technologies, which follows from the width of the primaries and would hold for any boundary-crossing set.
And the containment test assumes a display can be driven to any non-negative mixture of its three primaries at the luminance the surface requires. Real displays have a peak luminance and a black level, so the practical boundary is tighter than this one and depends on the room as well.
Where the ladder goes next
If a gamut boundary is a band, then so is every quantity computed from it — the volume, the count of distinguishable colours — which already depends on which metric asks — and the coverage percentage a display is sold on. None of those has been recomputed here, and each would come out as a distribution rather than a number.
The other direction is the instrument. This essay puts a population inside a gamut; the next puts a geometry inside a measurement, and finds that two standard ways of measuring the same sample disagree by eight units on a dark one — which is larger than anything the observer population contributes.
Where this goes next
 A fourth primary is a design
A display's fourth emitter is sold as more colour. Optimised instead against how far apart two hundred eyes are about its white — with the gamut held fixed so it cannot cheat — it buys agreement, and two and a half times closer together than three primaries reaching the same area, and the wavelengths it chooses are not the ones anybody would pick.
A fourth primary is a design
A display's fourth emitter is sold as more colour. Optimised instead against how far apart two hundred eyes are about its white — with the gamut held fixed so it cannot cheat — it buys agreement, and two and a half times closer together than three primaries reaching the same area, and the wavelengths it chooses are not the ones anybody would pick.
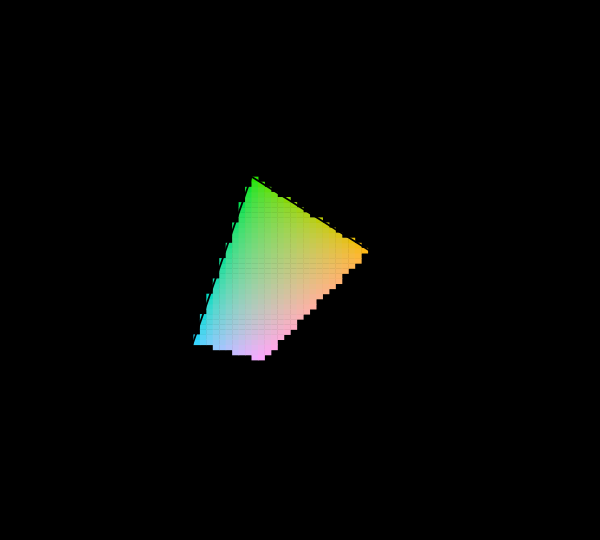 What a gamut costs
Three primaries reach a triangle and the visible region is not a triangle, so something has to give. Widening the primaries helps, has a price in precision and compatibility, and runs into a limit that is geometric rather than technological.
What a gamut costs
Three primaries reach a triangle and the visible region is not a triangle, so something has to give. Widening the primaries helps, has a price in precision and compatibility, and runs into a limit that is geometric rather than technological.
 One match names the observer
A yellow at 589 nanometres set against a mixture of 545 and 670 is two equations in two unknowns. It has one solution for a normal observer, a solution somewhere else for an anomalous one, and no unique solution at all for a dichromat — whose two equations are one equation twice.
One match names the observer
A yellow at 589 nanometres set against a mixture of 545 and 670 is two equations in two unknowns. It has one solution for a normal observer, a solution somewhere else for an anomalous one, and no unique solution at all for a dichromat — whose two equations are one equation twice.
What this makes readable
Essays that name this one as a prerequisite.
Named alongside this one
Essays reaching for the same objects. Nobody chose these; they are what the index of named objects makes visible.
- Four primaries have a choice cone fundamentals · display gamut · individual variation · observer metamerism · primaries · standard observer
- The peaks move the flanks display gamut · individual variation · narrow band displays · observer metamerism · primaries · standard observer
- Whose eyes gamut · individual variation · narrow band displays · observer metamerism · primaries · standard observer
- Not every colour has a wavelength chromaticity · display gamut · gamut · primaries · standard observer
- Seventeen observers in 1931 chromaticity · cone fundamentals · observer metamerism · primaries · standard observer
- The triangle is a shadow chromaticity · display gamut · display p3 · gamut · primaries
What links here
The 8 essays that link to this one and share the most of its objects, of 15 that link here.
The objects this essay names
Each one links to every other essay that touches it.
AssertionChromaticityCone fundamentalsDisplay gamutDisplay P3GamutIndividual variationNarrow band displaysObserver metamerismPrimariesReflectanceStandard observer