Not every colour has a wavelength
Assumes Most of this diagram cannot be shown and A spectrum is not a colour.
A rainbow has no magenta in it. Nobody finds this odd until it is pointed out, and then it is very odd indeed, because magenta is not a rare colour or a subtle one — it is a colour anybody can pick out of a shop window at forty paces.
The reason is that magenta has no wavelength. Not “a wavelength that is hard to measure”, not “a mixture of wavelengths”: no wavelength at all, in the precise sense that no monochromatic light anywhere in the spectrum matches it, at any intensity, mixed with any amount of white.
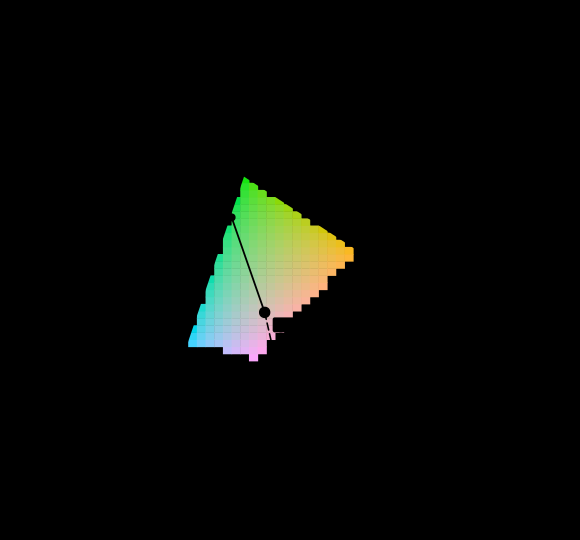
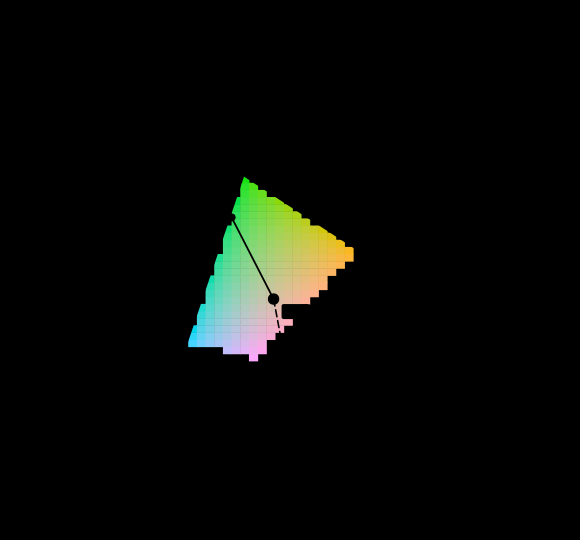
The white point is an argument to that construction, and moving it moves the answer without touching either sample.
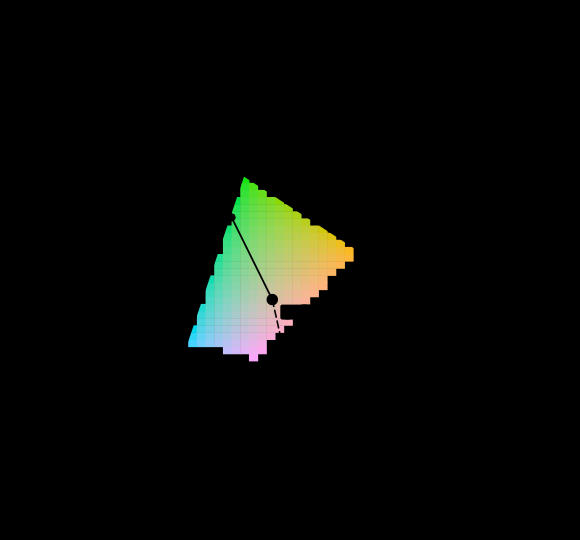
The observer is the second convention the construction rests on, and changing it redraws the locus the ray is supposed to leave through.
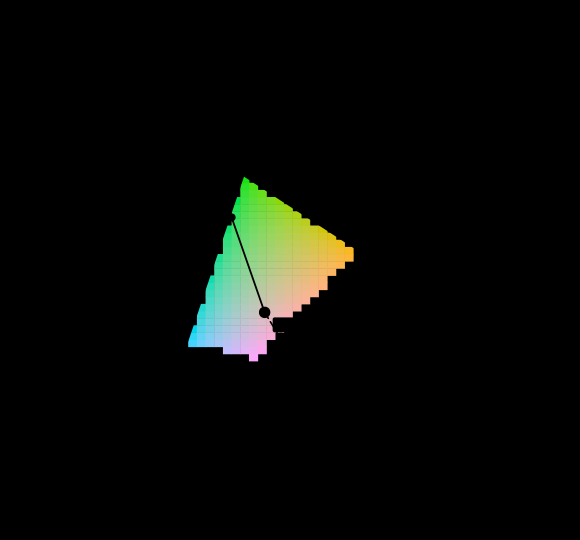
Only the third argument is a measurement, and choosing two different samples changes which of them has an answer at all.
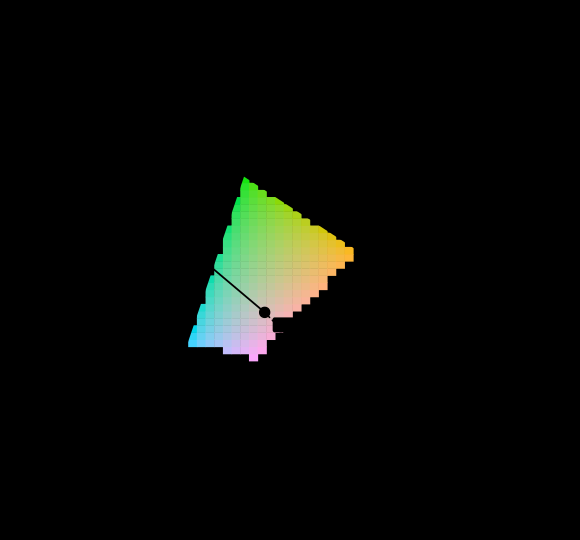
What the construction actually is
Colorimetry does have an answer to “what wavelength is that colour”, and the answer is a piece of geometry rather than a measurement.
Fix a white point. Draw the ray from the white through the sample’s chromaticity, and continue it until it leaves the diagram. If it exits through the spectral locus, the wavelength at the exit is the dominant wavelength: the monochromatic light which, mixed with that white in the right proportion, matches the sample. How far along the ray the sample sits is the excitation purity — 0 at the white, 1 at the boundary.
That is a complete and useful answer, and every part of it is contingent on a choice. The white point is a choice. The observer that puts the locus where it is, is a choice. The diagram itself is a projection that has already thrown luminance away. What comes back is not a property of the light; it is a coordinate in a space somebody built.
The construction fails outright in one region, and the failure is not an edge case.
Reading along that strip is the fastest way to see what is missing. It runs from violet through blue, green, yellow and orange to red, and it never passes through magenta, pink or purple, because those are not in it. The strip is the whole of what has a wavelength.
The wedge with no answer
The spectral locus is not a closed curve. It runs from the deep violet end to the deep red end and stops, and the two ends are joined on the diagram by a straight segment — the line of purples, which is not part of the locus because no monochromatic light lies on it. Every point on that line is a mixture of the two spectral extremes.
A ray from the white that exits through the purples has therefore exited through a boundary made of mixtures. There is no wavelength there to report.
106.3° of 360. Just under thirty per cent of all the directions a colour can lie in from the white point, and the whole of it is a region where the standard construction returns nothing.
That number deserves suspicion, since it is the kind of figure that sounds larger than it should. It is an angle at the white point, and it is the right quantity precisely because the diagram is projective: areas on it are meaningless, but the directions from a fixed interior point are exactly what the construction sorts colours by. Two samples in the same direction from the white differ only in purity and share a dominant wavelength, so directions are the natural unit for asking how often the construction succeeds.
Convention fills the gap with a complementary wavelength. The ray is run backwards through the white, the locus crossing on that side is found, and the result is written with a c — 520c, never 520. It says: this colour is what remains when 520 nm is removed from the white, rather than anything that can be added to it. It is a real and useful construction and it is a different construction, which is why the suffix is not optional. A caption that prints 520 where the arithmetic produced 520c has stated something false.
What the picture cannot show
The hatched region on both diagrams above is the part of the chromaticity plane that this display cannot reach, and it is most of it.
This matters more here than in most figures on this site, because the argument is about the boundary. The spectral locus is where the dominant wavelength lives, and no display can put a pixel anywhere near it — a monochromatic light is the most saturated stimulus there is, and three primaries inside the locus cannot mix to anything outside their own triangle. So every wavelength label on the diagrams above sits in territory the reader’s screen is incapable of illustrating.
The purity ladder makes the same point by running into it.
Two things are visible at once, and only one of them was intended. The intended one is that the ladder stops being solid well before purity 1: the display runs out of gamut. The other is that the steps are not perceptually equal — the low end crawls and the high end lurches — which is a statement about the diagram rather than about purity, and is the reason the 1931 diagram was supplemented in 1976.
The answer moves when the white does
The construction takes a white point as an argument, so it returns a different answer for different whites. That is easy to say and hard to feel until it is measured.
Take a fixed chromaticity — a real paint chip, whose reflectance has not changed — and ask for its dominant wavelength under D65 and under illuminant A. The answer moves by 60.7 nm: 563.3 nm under daylight, 502.6 nm under tungsten. That is not a small correction; 563 nm is a yellow-green and 503 nm is a blue-green, and they are not the same colour by any account.
The chip did not change. The light did not change either, in the sense that matters — the sample’s chromaticity is being held fixed here, so this is not about the illuminant altering what reflects off the surface. The only thing that moved is the point the ray is drawn from.
This is the strongest available demonstration that a dominant wavelength is not a property of a colour. It is a coordinate, it is defined relative to an origin, and quoting one without saying which white it was computed against is like quoting a bearing without saying which north.
The practical consequence turns up in specifications. Dominant wavelength is a standard way of binning LEDs on a production line, and it is quoted to a tenth of a nanometre in datasheets that frequently do not say which white point the binning used — which is tolerable only because everyone in that industry has silently agreed on one. The agreement is a convention, not a measurement, and it is the same class of silent agreement that makes a hex code readable: three numbers mean something because a document nobody reads says what they mean.
The observer moves it as well
The same argument runs a second time on the other choice buried in the diagram.
The spectral locus is the set of chromaticities of monochromatic lights, and those chromaticities are integrals of a delta function against the colour-matching functions. Different functions, different locus. Under the 1964 10° observer the locus sits in a measurably different place, and the same sample chromaticity exits it at a different wavelength: 529.5 nm under the 2° functions, 523.5 nm under the 10°, a shift of 6.0 nm.
Six nanometres is much smaller than sixty, and it is not nothing. It is larger than the wavelength resolution of most of the instruments that would be used to report such a number, which means the observer choice is above the noise floor of the measurement it is being quoted alongside. A dominant wavelength given to a tenth of a nanometre without an observer named is a number reported to a precision the construction does not have.
The wedge is not an artefact of the 1931 diagram in particular. A projective transformation takes straight lines to straight lines, so the line of purples is still a chord on the 1976 diagram and still bounds a region with no spectral exit. What changes is the angle it subtends, because the white and the locus have both moved. The phenomenon is a fact about the spectrum having two ends, and no re-drawing of the plane can remove it.
The wedge barely moves, and the answer moves a great deal
Two of this essay’s numbers respond to the same choice in opposite ways, and putting them beside each other says what the white point is actually doing.
Recomputing the wedge from four whites, on this collection’s own locus:
| white | wedge | share of all directions |
|---|---|---|
| equal energy, E | 106.2° | 29.5 % |
| D65 | 104.6° | 29.0 % |
| D50 | 102.4° | 28.4 % |
| illuminant A | 97.9° | 27.2 % |
The whole range is 27.2 to 29.5 per cent, and the 1964 10° observer at equal energy gives 107.9° rather than 106.2°. So how many colours have no wavelength is nearly independent of the white point, while which colour gets which wavelength moves by sixty nanometres under the same change. The wedge is a statement about the spectrum having two ends; the dominant wavelength is a bearing from a chosen origin, and only the second is at the mercy of the choice.
The worry about the 106.3° being an angle rather than a count can also be settled rather than argued. Taking the sRGB triangle — the colours a reader could actually be shown — 28.5 per cent of its area lies inside the wedge seen from D65, against 29.0 per cent of directions. The two measures agree to half a point on the one gamut that matters, so the near-a-third figure is not an artefact of the measure it was taken with.
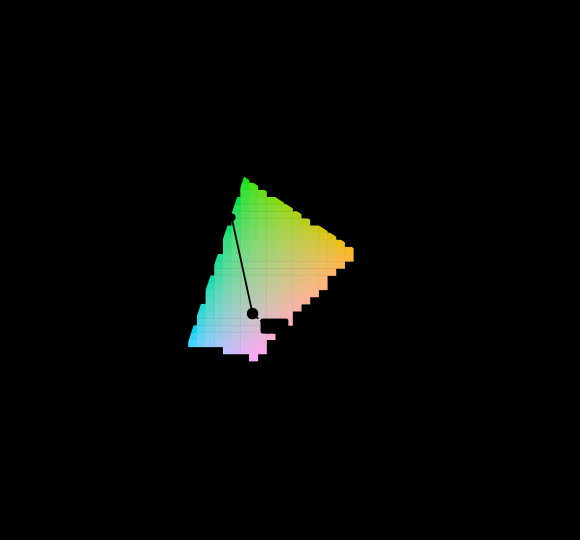
Against D65 rather than equal energy the construction moves, and D65 is the white a display argument would actually be made against.
Sixty nanometres is a purity-0.44 number
The 60.7 nm shift is quoted as though it were a property of the construction, and it is a property of one sample. The sample can be recovered: the ray from D65 exiting at 563.3 nm and the ray from A exiting at 502.6 nm meet at (0.350, 0.450), which is an ordinary yellow-green, at an excitation purity of 0.444 from D65 and 0.221 from A.
Sliding that chromaticity along its own D65 ray and recomputing gives the sensitivity as a function of purity:
| excitation purity | shift, D65 to A |
|---|---|
| 0.10 | 75.5 nm |
| 0.30 | 68.0 nm |
| 0.444 | 60.7 nm |
| 0.60 | 47.8 nm |
| 0.80 | 11.3 nm |
| 1.00 | 0.0 nm |
The shift is not a constant, it is a function that goes to zero at the locus — a monochromatic light is its own dominant wavelength from any white, which is one of the assertions this essay already carries, so the last row of the table is guaranteed rather than measured. What was not obvious is how fast it collapses: three quarters of the swing is gone by purity 0.8.
The mechanism is a distance. The chip sits 0.127 from D65 and 0.106 from A, while the two whites are 0.156 apart — so the sample is nearer to each origin than the origins are to each other, and the two rays leave it at 83.6°, very nearly a right angle. A bearing taken from two places twice as far apart as the target is a bearing with no stability in it, and that is the whole of the sixty nanometres.
This makes the LED-binning case stronger rather than weaker. A binned emitter sits close to the locus at purities well above 0.9, where changing the white from daylight to tungsten costs a few nanometres rather than sixty. The industry’s silent agreement on a white point is tolerable there for a stateable reason, and the datasheet’s tenth of a nanometre is defensible against the white point while remaining indefensible against the observer — six nanometres between the 2° and 10° functions, which does not shrink with purity, because it moves the locus itself rather than the origin the ray is drawn from.
So the honest form of the warning is conditional. A dominant wavelength quoted without a white point is unusable below about purity 0.6 and nearly harmless above 0.9, and the samples people quote them for are mostly in the second group — which is why the practice survives, and why it fails exactly when it is applied to a paint chip.
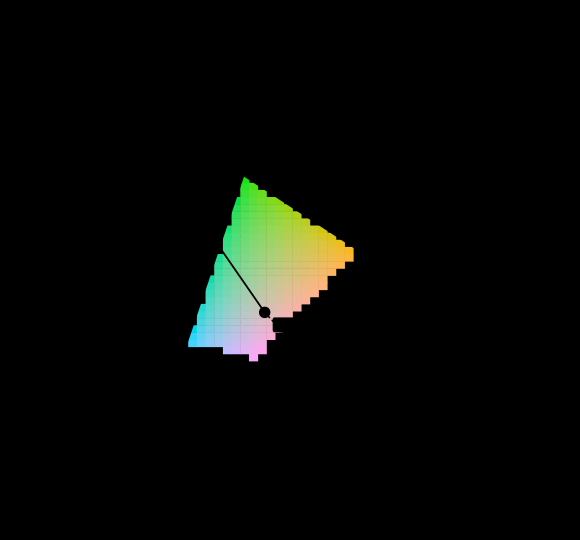
Moving both samples changes both answers, which is the point: the construction reports a property of a ray and not of a colour.
What was computed, and how
The geometry is a ray-boundary intersection, computed at 1 nm resolution along the locus. Every wavelength quoted above is interpolated linearly between two locus samples at the exact crossing parameter, not snapped to the nearer of two grid points.
Three properties are asserted, and one of them found a real bug.
A monochromatic light is its own dominant wavelength, at purity 1. Swept across the locus rather than checked at one point, because an off-by-one in the wavelength array is invisible in the middle and obvious at the ends. Worst disagreement across the sweep: 0.000 nm.
The white point has no dominant wavelength. This is asserted separately because the tempting implementation returns one anyway — the direction of a zero-length vector is whatever the floating point happens to produce, and it is a perfectly plausible wavelength that a caption would print without complaint. The code returns null and the label reads “no dominant wavelength”.
The purples occupy a substantial wedge, between 20° and 120°, which is a structural claim rather than a stored number.
The bug the assertions caught was in purity, and it is worth recording because the wrong version looked entirely correct. The ray was being extended by a large factor before intersecting — the obvious way to write “a ray, not a segment” — which rescaled the intersection parameter by that same factor, so every purity came out as one ten-thousandth of its true value and was then clamped to 1. Every sample read as fully saturated. The ladder figure would have shown nine identical patches and the captions would have quoted purity 1.00 nine times, and nothing in any gate on this site asks whether nine numbers that should differ are different. The fix was to parameterise the ray in units of the sample’s own offset, which is what makes purity exactly the reciprocal of the exit parameter.
Where the model stops
The construction says nothing about appearance, and the gap is wider than usual.
Two samples with the same dominant wavelength and the same purity, at different luminances, look substantially different — and the diagram cannot represent that at all, having divided luminance out to become two-dimensional in the first place. Two samples with the same dominant wavelength at different purities differ in a way that is not perceptually uniform in either direction.
More sharply: dominant wavelength and purity are not hue and saturation, and treating them as though they were is the most common misuse of the pair. Hue and saturation are appearance correlates and belong to a model that takes a viewing condition; dominant wavelength and purity are ratios of distances in a projective diagram nobody claims is uniform. The two agree in ordering often enough to be dangerous and disagree in magnitude everywhere.
There is also nothing here about what the sample is made of. Two spectra that match under one illuminant and separate under another have the same dominant wavelength under the first and different ones under the second, and the construction gives no hint that the pair was ever a pair. It works on chromaticities, and a chromaticity is three numbers with one divided out — it has no memory of the function it came from.
Who found it, and when
The line of purples is as old as the diagram, but the practice of writing complementary wavelengths with a c was formalised by the CIE well after 1931, and the notation still varies: some sources write 520c, some −520, some 520C.
The deeper history is that Newton’s colour circle already had the problem and already had the answer. Closing the spectrum into a circle — joining red back to violet through a region that is in no rainbow — is precisely the acknowledgement that the purples exist and are not spectral. Newton drew them in 1704 and the chromaticity diagram is, in this one respect, a more careful drawing of the same observation: the ends of the spectrum are perceptually adjacent and physically as far apart as the visible band goes.
What 1931 added was that the joining segment is straight, which is not obvious and is a consequence of the additivity of colour matching: any mixture of two lights lies on the segment between them, so the set of mixtures of the two spectral extremes is exactly the chord. The straightness is Grassmann’s laws made visible.
It is worth noticing how much that one word carries. If colour mixing were not additive — if two lights combined into something other than the sum of their tristimulus values — the set of mixtures of the spectral extremes would be some curve, the diagram would not be a diagram in which mixtures lie on segments, and the entire dominant-wavelength construction would collapse, because it depends on a mixture of white and a monochromatic light lying on the line between them. The construction and the straight purple boundary are the same fact seen from two sides, and both are consequences of an empirical law about lights adding, discovered by Grassmann in 1853 and holding to a precision nobody has managed to embarrass.
Where this goes next
The wedge is a fact about the observer’s locus, so it is a different wedge for a different observer, and asking what the observer choice costs across the whole site is the argument this ladder is climbing towards.
The other direction is downward, into what the diagram threw away. Everything here is geometry on a plane that exists because luminance was divided out, and the shape of the solid that projection came from is a separate question with a separate answer — one where the numbers quoted about display gamuts turn out to be about the shadow rather than the object.
Where this goes next
 Most of this diagram cannot be shown
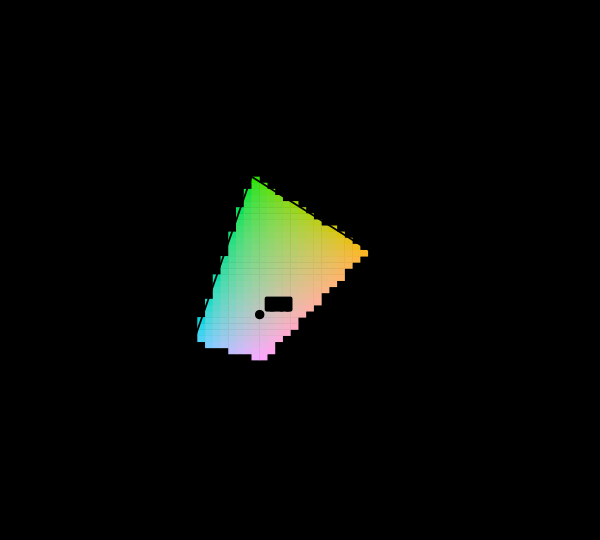
The chromaticity horseshoe is the canonical illustration of colour science, and nearly every printed copy is filled edge to edge with colours the page cannot produce. The honest version marks them, and the marking covers most of the picture.
Most of this diagram cannot be shown
The chromaticity horseshoe is the canonical illustration of colour science, and nearly every printed copy is filled edge to edge with colours the page cannot produce. The honest version marks them, and the marking covers most of the picture.
 A spectrum is not a colour
What arrives at the eye is a function of wavelength. What the eye reports is three numbers. Keeping the two apart is the single most useful habit in the subject, and almost every confusion in applied colour comes from letting them merge.
A spectrum is not a colour
What arrives at the eye is a function of wavelength. What the eye reports is three numbers. Keeping the two apart is the single most useful habit in the subject, and almost every confusion in applied colour comes from letting them merge.
 Two spectra, one colour
Metamerism is usually described and almost never demonstrated. It does not have to be — the metameric black space is enormous, so a matching pair can be constructed to order, verified, and then made to come apart by changing the light.
Two spectra, one colour
Metamerism is usually described and almost never demonstrated. It does not have to be — the metameric black space is enormous, so a matching pair can be constructed to order, verified, and then made to come apart by changing the light.
Named alongside this one
Essays reaching for the same objects. Nobody chose these; they are what the index of named objects makes visible.
- A fourth primary is a design chromaticity · display gamut · gamut · primaries · standard observer
- A gamut has a population chromaticity · display gamut · gamut · primaries · standard observer
- A screen is a poor lamp display gamut · gamut · illuminant · primaries · white point
- No surface can be that colourful chromaticity · display gamut · gamut · primaries · standard observer
- The triangle is a shadow chromaticity · display gamut · gamut · primaries · white point
- What a gamut costs chromaticity · display gamut · gamut · primaries · spectral locus
What links here
The 8 essays that link to this one and share the most of its objects, of 9 that link here.
The objects this essay names
Each one links to every other essay that touches it.
ChromaticityDisplay gamutGamutIlluminantNamingPrimariesSpectral locusStandard observerWhite point