Seventeen observers in 1931
Every colour specification in industrial practice — every paint standard, every display profile, every image file on the web — traces back to a set of three curves. Those curves are an average of measurements made on seventeen people in England in the 1920s.
That is not a criticism of the work, which was careful and difficult. It is a statement about what the foundation of the subject actually rests on, and it is worth knowing before quoting a chromaticity to four decimal places.
What was measured
Wright, at Imperial College, used monochromatic primaries at 650, 530 and 460 nm and ten observers. Guild, at the National Physical Laboratory, used broadband filtered sources and seven. Both ran the colour-matching experiment: a bipartite field, a test wavelength on one side, three adjustable primaries on the other, adjusted until the halves matched.
The two datasets were transformed to a common basis and averaged. The agreement between two independent laboratories using different primaries was good, which is the main reason the result was trusted, and it remains a genuinely impressive piece of experimental work.
The observers were, so far as the record shows, young, male, and drawn from the two laboratories and their surroundings. Nobody was screening for anything except normal colour vision as then understood.
The field size, and why it is in the name
The matches were made on a field subtending two degrees — about the width of a thumbnail at arm’s length.
That choice was deliberate and has consequences. The central retina is covered by the macula, a yellowish pigment layer that absorbs strongly in the blue. A two-degree field falls entirely within it, so the 1931 observer includes macular absorption in its short-wavelength behaviour. A larger field extends beyond the macula and recruits retina with much less of it.
This is why the CIE added a ten-degree observer in 1964, measured on a much larger sample — 49 observers rather than 17 — and why the two differ most in the blue.
Which observer applies depends on how large the thing being matched is. Most industrial colour work uses fields larger than two degrees, so the 1964 functions are arguably the more appropriate ones — and 1931 is used anyway, almost universally, because everything else is built on it.
The known error
The 1931 functions are wrong in the short-wavelength region, and this has been known since 1951.
The problem lies in the transformation rather than the measurement. Converting Wright’s and Guild’s RGB data into XYZ required knowing the luminous efficiency function , since was to be set equal to it. The available in 1931 substantially underestimated sensitivity below about 460 nm, and that error propagated into the matching functions.
Deane Judd published a corrected version in 1951. Johan Vos refined it in 1978. Both corrections raise the short-wavelength response considerably, and both are regarded as more accurate representations of an average human observer than the 1931 functions are.
Neither has been adopted as the standard.
Why the correction was never adopted
The reasons are institutional rather than scientific, and are worth setting out because they explain a good deal about how the field works.
Everything is built on the original. Every colour space, every device profile, every published measurement, every industrial standard. Changing the observer would invalidate the numerical content of the entire accumulated record.
The error is small where most work happens. The discrepancy is largest in the deep blue and violet, where few surface colours live and where the eye is least sensitive. For the great majority of practical colours the 1931 functions are perfectly adequate.
Consistency beats accuracy for a standard. A standard’s job is to let two parties agree. If both use the same slightly wrong functions they agree exactly; if one upgrades, they disagree. For a communication standard that is a worse outcome than a shared small error.
So the CIE publishes the Judd and Vos corrections, recommends them for research where blue accuracy matters, and leaves the 1931 functions as the standard. That is a defensible position and it means the standard observer is knowingly not the best available model of human vision, which is not what most people assume when they use it.
The CIE has since published a physiological observer, CIE 170, parameterised by field size and age. It has not displaced the 1931 functions either.
How much real observers vary
The standard observer is an average, and averages conceal spread. Four sources of variation are substantial and none is exotic.
Macular pigment density varies several-fold between individuals and affects short-wavelength sensitivity directly.
Lens yellowing increases steadily with age. An eighty-year-old lens transmits markedly less blue than a twenty-year-old one, so the effective observer changes over a lifetime. This is why CIE 170 takes age as a parameter.
Pigment polymorphism. The L cone pigment comes in variants differing by a few nanometres in peak sensitivity, and which variant a person carries is genetic. This is common rather than rare.
Rod intrusion at lower light levels shifts effective sensitivity, since rods peak between the S and M cones.
The consequence is observer metamerism: two stimuli matching for one normal trichromat can be distinguishable to another. This is a real problem in practice, and it has become worse rather than better as displays have changed. A tungsten lamp and a paint sample have broad spectra, and broad spectra are forgiving of observer differences. A modern display with narrow-band primaries — particularly laser or quantum-dot — is much less forgiving, so two people can genuinely disagree about whether a screen matches a print.
What this means for the numbers on this site
Every chromaticity quoted here is a chromaticity for the 1931 two-degree standard observer, and that is why every figure names its observer in the corner rather than leaving it implicit.
It also means the precision implied by four decimal places is misleading about accuracy. D65 sits at for this observer exactly, because that is a definition; where a real person’s white point sits is a different question with a different and wider answer.
The same applies to the spectral locus. The horseshoe is not a property of light. It is the boundary of a particular tabulated model, and a different observer traces a slightly different curve — which means the boundary between “reachable” and “not reachable” is itself observer-dependent, though far less so than the gamut limitation it is being compared against.
What the two observers disagree about
Carrying both the 1931 and 1964 functions makes the disagreement computable rather than a matter of assertion.
The practical guidance is that the two-degree observer applies to fields smaller than about four degrees and the ten-degree observer to larger ones. Most industrial colour matching involves fields larger than four degrees, which makes the 1964 functions arguably more appropriate for the majority of real work.
They are not what gets used. The 1931 observer is the default in essentially every instrument, standard and piece of software, and the reason is that everything else was built on it.
The correction that exists and is not used
Judd’s 1951 correction and Vos’s 1978 refinement both raise the short-wavelength response substantially, and both are regarded as better models of an average observer than the 1931 functions.
The error they correct is not in the measurements. It is in the transformation. Converting Wright’s and Guild’s data to XYZ required the luminous efficiency function , since was defined to equal it, and the 1931 version of substantially underestimated sensitivity below 460 nm. That error propagated into all three functions.
The CIE publishes the corrections and recommends them for research where blue accuracy matters. It has not adopted them, on the grounds that a communication standard’s value lies in everyone using the same one — a shared small error is better than an unshared correction. That is a defensible position and it means the standard observer is knowingly not the best available model, which is not what most users assume.
Why narrow-band displays made this worse
Observer variation used to be a laboratory concern and has become a practical one, and the reason is a change in display technology.
A broad, smooth spectrum is forgiving of observer differences. Two observers with slightly different matching functions integrate a smooth curve to nearly the same result, because the differences average out across the width of the curve.
A narrow-band spectrum is not forgiving. Laser and quantum-dot displays emit in narrow peaks, and a small shift in an observer’s sensitivity curve changes the response to a narrow peak considerably. The consequence is that two people with normal colour vision can genuinely disagree about whether a modern display matches a print, in a way that was rare with older technology.
This is observer metamerism, it is getting worse rather than better, and it is the reason the CIE has been working on standard observer sets — several functions describing the spread — rather than a single average.
How much narrower makes it worse
That a broad spectrum is forgiving and a narrow one is not is a statement with a factor of twenty in it.
Comparing what the 1931 and 1964 observers report for the same Gaussian source — each normalised against its own D65, so that both have adapted to the same white — and taking the worst centre wavelength at each width:
| source width | worst disagreement | at |
|---|---|---|
| 200 nm | 1.73 | 580 nm |
| 100 nm | 2.80 | 580 nm |
| 60 nm | 9.87 | 420 nm |
| 40 nm | 15.28 | 445 nm |
| 25 nm | 23.58 | 465 nm |
| 15 nm | 30.82 | 470 nm |
| 10 nm | 33.60 | 470 nm |
| 5 nm | 34.66 | 470 nm |
A factor of twenty between the broadest and the narrowest, with the growth steepest between a hundred and forty nanometres — which is exactly the range display primaries have moved through in twenty years.
Two other features are worth reading off. The worst wavelength migrates. At broad widths the disagreement is largest near 580 nm and modest; as the source narrows it moves to 470 and grows fivefold, which is the blue where the macular pigment and the known 1931 error both live. So a narrow source does not amplify the disagreement evenly. It exposes one particular disagreement.
And the ordinary sources land where they should. D65 itself gives exactly 0.00, because both observers are normalised against it. Illuminant A gives 1.49. A three-emitter white built from peaks of 12, 22 and 18 nanometres gives 2.46 — already past a coating tolerance, from a lamp that looks white to everybody, after both observers have adapted to the same white.
That last number is the practical form of this whole essay. Two standard observers, no individual variation at all, one white balance between them, and two and a half units of disagreement about a modern display’s white.
What was computed here
The matching functions are tabulated data. They are measurements of people, this site’s rule is that measurements are quoted and derivable results are not, and these are squarely measurements.
Everything downstream is computed, and two checks confirm the table has not been corrupted. Equal-energy illuminant must land at exactly one third, one third, and does to — a definitional target that fails immediately if the three functions are scaled inconsistently. D65 must land at and does to .
Both observers are carried, so any figure can be drawn under either, and the difference between them is a computation rather than an assertion.
What follows for anyone quoting a number
Three practical consequences, none of which is usually stated alongside a chromaticity.
Precision is not accuracy. D65 sits at exactly, because that is where the definition puts it. Where a particular person’s white point sits is a different question with a wider answer, and the four decimal places describe the standard rather than the observer.
The observer is part of the specification. Two laboratories quoting chromaticities under different standard observers are not directly comparable, and the difference is largest in exactly the region where the 1931 functions are known to be wrong.
The boundary of the visible region is model-dependent. The spectral locus is the boundary of a tabulated model, not a property of light. A different observer traces a slightly different curve.
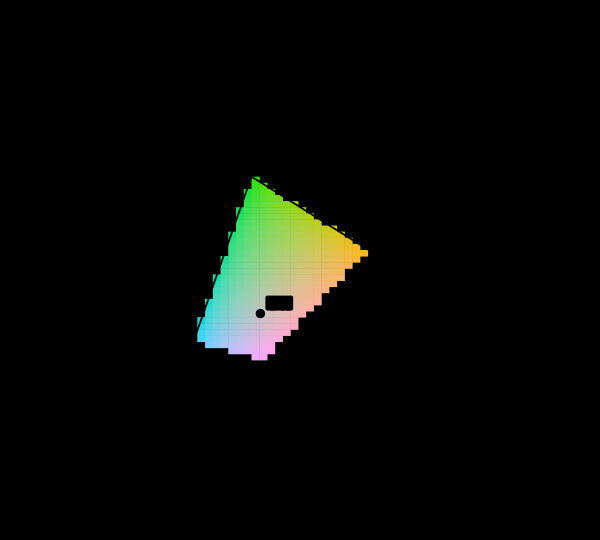
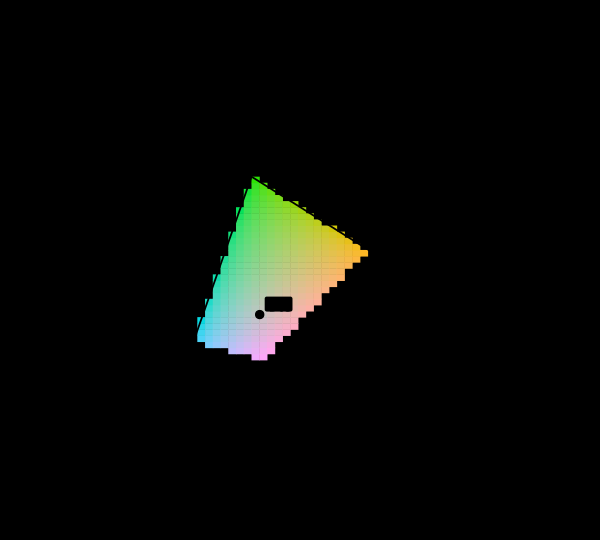
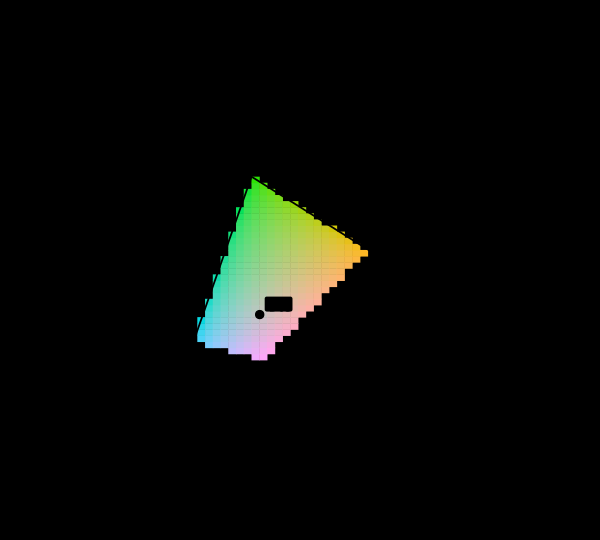
Which of the two is used decides where a display’s own triangle lands, and by more than a specification’s tolerance.
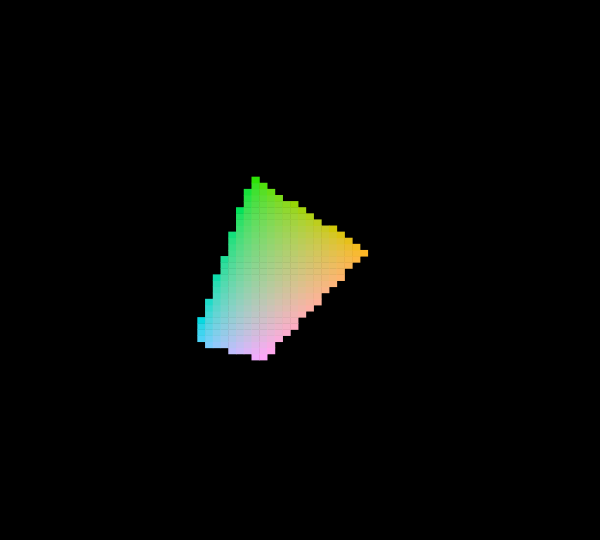
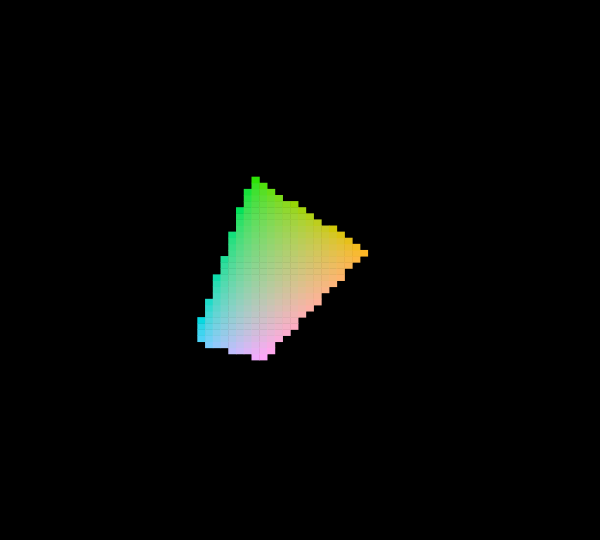
Fixing the luminance factor as well as the observer is the last of the diagram’s free arguments, and it shrinks the reachable region again.
The value of a wrong standard
It would be easy to read all of this as a case for abandoning the 1931 observer, and that is not the conclusion.
A communication standard’s value is that everyone uses the same one. Two parties using identical slightly-wrong functions agree exactly; two parties using different better functions do not. For the purpose the system was built for — specifying colours so that a manufacturer and a customer mean the same thing — consistency dominates accuracy, and the CIE’s refusal to change is a defensible reading of its own remit.
What is not defensible is using the standard without knowing it is a standard. The numbers are conventional, they descend from seventeen people, and treating them as measurements of human vision rather than as an agreed reference is the error worth avoiding.
Two layers of convention
The functions are behavioural data. The cone fundamentals derived from them add a second modelling choice — which transformation matrix — and different choices are in use.
There is a general lesson here about standards that is worth extracting. A standard is an agreement, not a discovery, and its value comes from adoption rather than from accuracy. That means a standard can be knowingly imperfect and still be the right thing to use — and it also means anyone relying on one should know which parts are measurement and which parts are agreement. For the CIE observer, the data is measurement and the coordinate system is agreement.
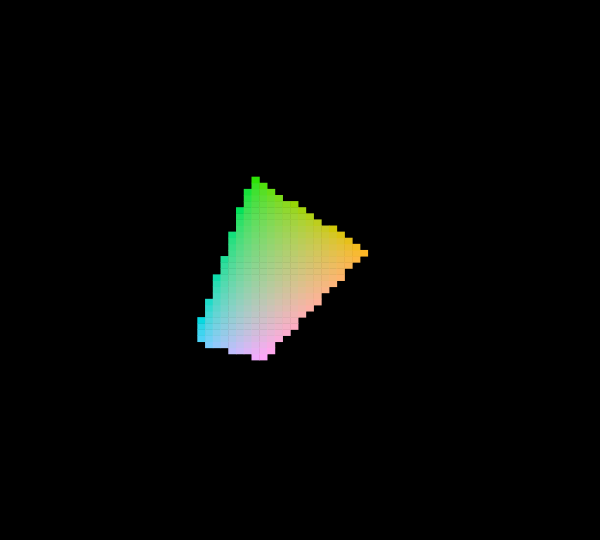
The diagram itself changes with the observer, and putting a wide gamut on the ten-degree locus is the cleanest way to see by how much.
Most of the variation is in front of the retina
The seventeen observers differed, and the temptation is to attribute the differences to their brains. Almost none of it is neural.
Two filters sit between the cornea and the photoreceptors, and both absorb selectively in the blue. The crystalline lens has an absorption that rises steeply toward short wavelengths, and it darkens throughout life: an eighty-year-old lens transmits roughly a third of the 440 nm light a twenty-year-old lens does. The macular pigment is a carotenoid screen over the central retina, peaking near 460 nm, and its optical density varies between individuals by a factor of three for reasons that are partly dietary.
Neither is a property of the visual system in any interesting sense. They are coloured glass, and they are the largest single source of disagreement between observers who all have entirely normal colour vision.
The consequence for the 1931 standard is uncomfortable. A standard observer is an average over people, and the thing being averaged varies systematically with age and idiosyncratically with pigment density. The CIE’s functions have no age. They describe a hypothetical person of no particular years, assembled from seventeen who each had some, and any individual reader of this page is matching colours through their own filters rather than through the average of somebody else’s.
This is also why the disagreement is worst exactly where it matters most for modern displays. The filters absorb in the blue, the blue is where individual variation is largest, and a narrow-band blue primary samples the region where two observers are least likely to agree.
What the pictures cannot show
The variation between real observers cannot be drawn here, because this site carries only the two CIE averages and not the distribution around them. Showing the spread would require the individual observer data, which for the 1931 functions is largely lost — the published record is the average.
Nor can the Judd and Vos corrections be shown as a difference in appearance. They change computed chromaticities in the deep blue, and the deep blue is almost entirely outside the display gamut, so the region where the correction matters most is precisely the region this page cannot show at all.
Who found it, and when
Wright published his results in 1928 and 1929, Guild in 1931. The CIE adopted the combined and transformed data at its 1931 meeting in Cambridge, along with the XYZ coordinate system and the chromaticity diagram.
Judd published his correction in 1951, Vos his refinement in 1978. Stiles and Burch measured a much larger and more carefully documented dataset in 1955 and 1959, which underlies the modern cone fundamentals of Stockman and Sharpe and the CIE 170 physiological observers.
The 1931 functions remain the standard, ninety-five years after the measurements, and are likely to remain so indefinitely.
Where this goes next
The variation between observers taken to its extreme is simulating what cannot be simulated, which deals with colour vision deficiency. The coordinate system built from this data is why colour is exactly three-dimensional. And the other large unknown in the chain is the display is an unknown.
Where this goes next
 Why colour is exactly three-dimensional
Matching every wavelength with three primaries requires, for some wavelengths, a negative amount of one of them. That physical awkwardness is why the colour-matching functions were transformed into XYZ, and why the horseshoe is curved.
Why colour is exactly three-dimensional
Matching every wavelength with three primaries requires, for some wavelengths, a negative amount of one of them. That physical awkwardness is why the colour-matching functions were transformed into XYZ, and why the horseshoe is curved.
 Three numbers
A spectrum has as many degrees of freedom as anyone cares to give it. The eye reports three. Everything colour science can do, and every way it fails, follows from that one collapse.
Three numbers
A spectrum has as many degrees of freedom as anyone cares to give it. The eye reports three. Everything colour science can do, and every way it fails, follows from that one collapse.
 Simulating what cannot be simulated
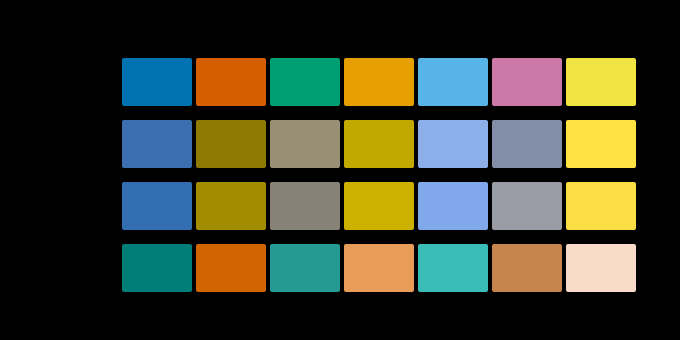
A colour-blindness simulation cannot show what anybody sees. What it can show is which discriminations survive, and that is a narrower claim, a checkable one, and the only one worth making.
Simulating what cannot be simulated
A colour-blindness simulation cannot show what anybody sees. What it can show is which discriminations survive, and that is a narrower claim, a checkable one, and the only one worth making.
What this makes readable
Essays that name this one as a prerequisite.
Named alongside this one
Essays reaching for the same objects. Nobody chose these; they are what the index of named objects makes visible.
- A gamut has a population chromaticity · cone fundamentals · observer metamerism · primaries · standard observer
- Four primaries have a choice colour-matching functions · cone fundamentals · observer metamerism · primaries · standard observer
- One person is two observers colour-matching functions · cone fundamentals · macular pigment · observer metamerism · standard observer
- A cone absorbs its own light colour-matching functions · cone fundamentals · observer metamerism · standard observer
- The third factor is a construction colour-matching functions · cone fundamentals · macular pigment · standard observer
- A field size is two changes cone fundamentals · macular pigment · standard observer
What links here
The 8 essays that link to this one and share the most of its objects, of 35 that link here.
The objects this essay names
Each one links to every other essay that touches it.
ChromaticityColour-matching functionsCone fundamentalsThe Judd–Vos correctionMacular pigmentObserver metamerismPrimariesStandard observerXYZ