Series

Limits — the series

51 essays on one idea, from the one that introduces it to the one that assumes the rest.
  1. The CIE 1931 colour-matching functions. The three functions that turn a spectrum into three numbers. They are all positive, which is why XYZ exists — the RGB functions they were derived from are not. ȳ is by construction the luminous efficiency function, which is why luminance comes out of Y.

    Seventeen observers in 1931

    The standard observer that governs every colour specification in industrial use is an average over seventeen young British men, measured with equipment from the 1920s. It is known to be wrong in the blue, the correction has existed since 1951, and it has never been adopted.

    part 1 · limits
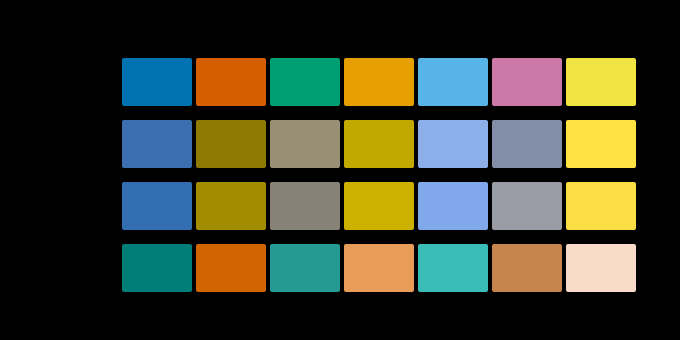
  2. One palette under normal vision and three dichromacies. The same 7 colours simulated by the Brettel–Viénot–Mollon construction at severity 1.0. protanopia and deuteranopia collapse the red-green distinctions, and tritanopia leaves them and collapses blue against yellow instead. This shows which discriminations survive, not what anybody sees.

    Simulating what cannot be simulated

    A colour-blindness simulation cannot show what anybody sees. What it can show is which discriminations survive, and that is a narrower claim, a checkable one, and the only one worth making.

    part 2 · limits
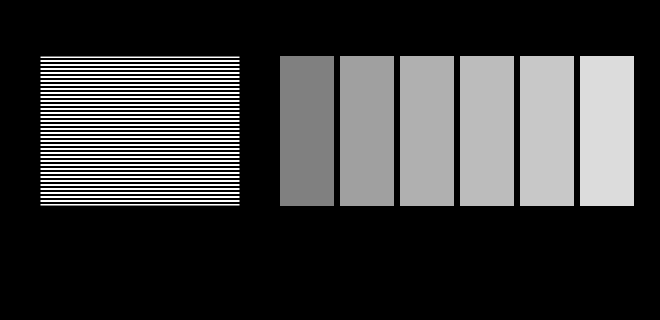
  3. A gamma probe: which grey matches a half-white dither?. The striped block on the left is half white and half black, so it carries half the luminance of white. Stand back until the stripes blur and find the patch that matches it. On an sRGB display the answer is code 188, not 128 — code 128 has only 22 per cent of white's luminance.

    The display is an unknown

    This site is displayed on the very apparatus it is about, and it knows almost nothing about that apparatus. Two figures here stop assuming and ask instead — a probe for the transfer function and a probe for the gamut.

    part 2 · limits
  4. How far a match comes apart when the observer changes. A broad source and a three-primary source, solved at each primary width so the pair is an exact tristimulus match for the CIE 1931 observer. The pair is then handed to the 1964 observer, and the gap between them is plotted. For the observer they were built for the gap is arithmetic noise at every width. For the other it grows as the primaries narrow, reaching 0.012 at 10 nm — and displays have been getting narrower for twenty years.

    Whose eyes

    The standard observer is an average over seventeen people, and no reader is it. What that costs was small when displays were broad and grows every time the primaries get narrower.

    part 3 · limits
  5. Three ways to spend a thousand code values. Normalised code value against luminance, for PQ, HLG and a conventional gamma curve, all covering 0.001 to 10000 cd/m². PQ spends 51% of its range below 100 cd/m² — roughly where a picture lives — and the gamma curve spends 15%, leaving the rest for highlights. A PQ code is the only one of the three that names a luminance rather than a fraction of whatever the display can manage.

    How bright is white

    An sRGB value says a pixel is some fraction of whatever the display can manage. A PQ value says it is two hundred candelas. The change is the largest in display encoding since gamma, and what it removed was the honest admission that nobody knew.

    part 3 · limits
  6. Chromaticity-triangle area against CIELAB volume, both relative to sRGB. Two ratios for each space, both against sRGB. The upper bar is the area of the primary triangle on the CIE 1931 diagram; the lower is the volume of the gamut solid in CIELAB, computed by tetrahedral decomposition of the RGB cube at 24 cells per axis. Display P3 is 1.36× sRGB by area and 1.50× by volume; Rec. 2020 is 1.89× sRGB by area and 2.26× by volume. The chromaticity diagram divides luminance out, so its triangle is a projection along the axis the eye is most sensitive to — and a coverage percentage quoted on it is a statement about the shadow.

    The triangle is a shadow

    A display's gamut is drawn as a triangle on the chromaticity diagram, and coverage is quoted as a percentage of that triangle's area. Chromaticity has luminance divided out, so the triangle is a projection along the axis the eye cares most about — and the ratios computed on the solid are not the ratios computed on its shadow.

    part 4 · limits
  7. A 8-bit ramp from 0.0008 to 0.006 of white, 12° wide. The top strip is the ramp as delivered: 16 distinct levels, each a step of one code value. Below it is the quantisation error as a Weber contrast against the local luminance, filtered by the luminance sensitivity function. The largest response is 8.51 per cent contrast against a threshold of 0.3, which is 28.4 times over — and it occurs at 0.09 per cent of white, at the dark end, because a code step is a Weber contrast and the same step is a larger fraction of less light.

    Banding is not a bit depth

    Eight bits bands at thirty times threshold in the shadows and at under three at mid grey, on the same ramp with the same encoding. What decides is where in the tone scale the gradient sits, how sharp each step's edge is, and how far away the reader is — and a bit count contains none of the three.

    part 4 · limits
  8. How far a judgement is from the settled one, second by second. The light changed from one white to another at t = 0 and nothing else moved. The model has one degree of adaptation and no clock, so the distance plotted is what a clock adds: 3.6 CAM16-UCS units half a second in, still 1.3 after a minute, and 0.11 after five. Every appearance number on this site is the value at the right-hand end.

    The model has no clock

    An appearance model takes a stimulus and a situation and returns what it looks like. It does not take a time, and adaptation is not instantaneous — half a second after the light changes a judgement is three and a half CAM16-UCS units from the settled one, and a minute later it is still 1.3.

    part 4 · limits
  9. How far a match comes apart when the observer changes. A broad source and a three-primary source, solved at each primary width so the pair is an exact tristimulus match for the CIE 1931 observer. The pair is then handed to the 1964 observer, and the gap between them is plotted. For the observer they were built for the gap is arithmetic noise at every width. For the other it grows as the primaries narrow, reaching 0.012 at 10 nm — and displays have been getting narrower for twenty years.

    Two degrees or ten

    This site names the observer on every figure it draws, which was supposed to be the point. Measuring what it had actually done found two hundred and four figures naming the same observer, three naming the other, and sixty-two of sixty-four generators printing a string that had never once varied.

    part 5 · limits
  10. The colourfulness the sRGB cube reaches, against the light in the room. The display is the same display throughout and the signal is the same signal. What moves is the adapting luminance, which enters the appearance model and nothing else. The furthest colourfulness the cube reaches falls from 131 to 57, a factor of 2.29. A gamut in CIELAB cannot show this at all, because CIELAB has no light level in it — which is why every gamut percentage in circulation is quoted without one.

    The gamut shrinks in the dark

    Every gamut number here is a property of a device and of nothing else, which is why the same display has the same gamut in a studio and in a cinema. It does not. Turn the room down four decades and the solid loses a fifth of its reach and two thirds of its volume, with the signal unchanged.

    part 5 · limits
  11. One light, two eyes. The same stimulus through two sets of ocular media differing only in macular pigment (0.35 and 0.41) and lens age (55 and 55 years). Compared under one white the two differ by ΔE00 1.00; compared with each eye adapted to its own long-run white — which is what the visual system does — by 0.00. The second number is why nobody notices, and the first is why a person who has had one lens replaced reports that the other eye has turned yellow.

    Nobody here has two eyes

    One person's two eyes differ in macular pigment and lens density, so the same light produces two colours — a whole ΔE00 apart for an ordinary pair, seven for one replaced lens. Adaptation hides it exactly, which is why nobody notices and why nothing in colorimetry has a term for it.

    part 5 · limits
  12. What a dither mask is worth, read as components, in two dimensions. Five luminance ramps, each quantised to 8 bits with and without a high-passed mask of the same power. The bars are the most visible single sinusoidal component of the error, as a multiple of the contrast that component needs to be seen: above the line at one it is visible. The mask lowers it by 20–22×, on every ramp — which the one-dimensional model on this site says it does not, and that disagreement is the finding.

    Every threshold was measured with a grating

    An earlier essay here claimed that the model cannot explain why dither works, and named two missing pieces. One of them was real and worth thirteen times the guess; the other was not needed. The piece nobody named was the detector — and reading the same model two ways changes the answer by a factor of fifty.

    part 5 · limits
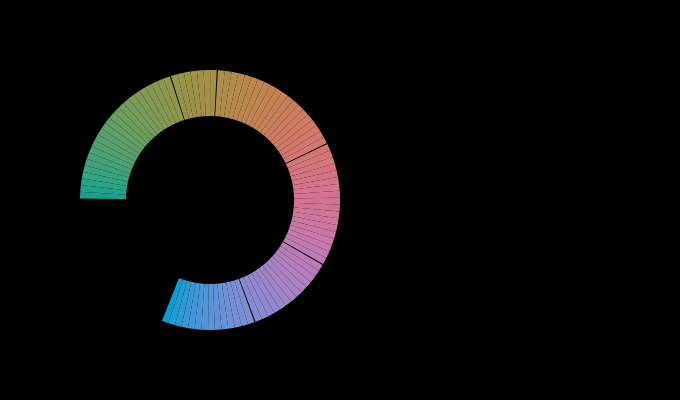
  13. The hue circle cut into names, at L 60 and C 40. Left, the arcs each name claims, drawn at the colour of their midpoints; right, the same arcs measured in ΔE00 by integrating the difference along the ring rather than in degrees. The widest is 5.3 times the narrowest in degrees and 4.5 times in colour difference, so the metric accounts for 15 per cent of the inequality and no more. Only the eight chromatic terms compete on this ring: at this chroma the achromatic three would otherwise take the region where no basic English term sits, which is a defect of the model and is named in the essay.

    There is no word for that colour

    The naming model built this phase gives a saturated cyan the name green, calls part of a chromatic ring grey, and puts one of the eleven focal colours outside what a display can show. Each failure is a measurement rather than a disclaimer, and together they say what a vocabulary is that eleven points and a distance are not.

    part 5 · limits
  14. How much colour a display delivers, against how bright the room is. The appearance solid of the whole code cube, with the room's reflected light added to every code value and the surround ratio computed from the room's own white against the display's. A 300 cd/m² panel delivers most at 200 lux, and the curve falls on both sides: darker costs the surround, brighter costs the black. At the 32 lux the softproofing standards specify, the solid is 89 per cent of its best — which is not a criticism of the standard, since it is written for matching a screen to a print viewing booth rather than for delivering the most colour.

    A display in a room is a smaller display

    Two results here turn the room's light in opposite directions and neither knows about the other. A room has one light level and does both at once — so there is a brightness at which a display delivers the most colour, it is not at either end, and it scales with the panel.

    part 6 · limits
  15. Every filtered claim in these essays, read at a point and read as components. Each row is a comparison one of the essays makes. The bar is the ratio between the two readings — how many times larger the component answer is than the point answer, or the reverse — on a logarithmic scale. 5 of 7 disagree by more than half again, and 4 disagree about the direction of the effect rather than merely its size. The three marked as noisy are the ones with a noise field on one side of the comparison, and they are the three largest.

    The list nobody made

    The last phase found that reading a filtered signal at a point asks a question its thresholds were never fitted to, made it a standing rule, and admitted that nobody had gone back through the site to see which claims it touched. Here is the list. Every claim with noise on one side of it moves — and so do two that have no noise in them at all, which the rule said would not.

    part 6 · limits
  16. Every claim here that was computed with one model, recomputed with two. Each row is a claim one of these essays makes. The bar is how many times the two-model answer differs from the one-model answer, on a logarithmic scale. 3 of 13 have no bar at all: the first model's answer for them is exactly zero, not because it computed zero but because it has no variable for the quantity. Those are the rows where a second model did not correct an answer — it supplied one.

    What a second model changed

    Thirteen claims here, each computed with one model and recomputed with two. Ten of them move by half again or more. Three of them do not move at all in the ordinary sense — the first model's answer is exactly zero, not because it computed zero but because it has no variable for the quantity — and every one of those three is a join that supplied a state or a device rather than a spread.

    part 7 · limits
  17. Every change of light this site models, and how much of it a gain removes. Each row is a change of illumination. The pale bar is how far it moves an ordinary surface for an observer who does not adapt; the solid bar at its left end is what is left after the observer has applied the one gain adaptation gives them, which is the ratio of the two whites in the CAT16 basis and is not fitted to anything. Sorted by the fraction left rather than by the size of the change, because the two orderings are different: the largest change here is removed almost entirely and the worst row is a change less than a third its size.

    What no adaptation can remove

    A change of light is exactly a 3×3 matrix on tristimulus values, and adaptation is a diagonal one. Putting every change of illumination this site models through that distinction sorts them by how much of themselves they leave behind, and the smallest residual in the census belongs to a filter inside the eye.

    part 8 · limits
  18. Four devices, and what each of them can do about a change of light. The mean over the census of what each device is left with. A press has no mechanism, so its number is the whole change — a printed sheet does not adapt to the room it is read in. A display can move its white point, which is a gain in its own primaries. A camera applies a gain in whatever basis its filter dyes happen to give it. And the sensor that satisfies the Luther condition exactly is worse than the silicon one — satisfying the condition means its channels are the matching functions, and a per-channel gain on the matching functions is the transform this site calls the oldest mistake still shipping.

    Only one of these devices adapts

    An eye, a camera, a display and a press all meet the same changes of light, and each has at most one thing it can do about them. The press has nothing at all, so its column is the whole change; and this collection's sensor built to satisfy the Luther condition exactly is the one that adapts worst.

    part 8 · limits
  19. A whiteness measurement has a date on it. A brightener is consumed by the ultraviolet that makes it glow: the molecule that absorbs a photon occasionally does something other than re-emit it, and what it does is break. So the loading falls with accumulated dose and the sheet's whiteness falls with it, from W 123 to 88 — most of the way back to the unbrightened base. The fall is steepest at the start because the absorption saturates, so the first molecules lost are the ones that were doing the least work and the curve is convex from the beginning. The dose axis is in arbitrary units whose half-life is stated; what is not arbitrary is the shape.

    The brightener is being used up

    The molecule that absorbs an ultraviolet photon occasionally does something other than re-emit it, and what it does is break. So a sheet's whiteness has a half-life, the fall is steepest at the start, and a specification quoting a whiteness figure without a date is quoting a property of a sheet that no longer exists.

    part 8 · limits
  20. What each fitted thing in these essays carries, what its data fix, and what is left. Three columns per row: how many numbers the model has, how many the stated data determine, and the difference — the dimension of the family that fits equally well. The third column is the one nobody publishes. A zero there does not mean the model is right; it means it is determined, which is a much weaker property and is compatible with being determined badly, as the camera row is.

    A fit can be exact and empty

    Every fitted object here reports one number, the residual on the data it was fitted to, and every one of them has two more that nobody publishes — how many of its parameters the data actually determine, and how large the family of equally good answers is. The third column is where the failures live.

    part 9 · limits
  21. Which of this collection's own claims survive a change of basis, and which are about the paper. Nine sentences this site says, sorted by whether they mean the same thing after the observer's three curves are replaced by a nonsingular combination of themselves. 5 of the nine do. The four that do not are not thereby wrong — they are statements about a chosen set of coordinates, and they are true of those coordinates. What they cannot be is statements about the eye, which is how every one of them is usually read.

    Which of these is a convention

    Nine ordinary sentences from this collection, put through one test — do they mean the same thing after the observer's three curves are replaced by a nonsingular combination of themselves? Five survive and four do not, and none of the four is wrong, because each is a statement about a set of coordinates being read as a statement about an eye.

    part 9 · limits
  22. The same optimum, along its narrowest direction and its widest. The adaptation objective along two straight lines through its own minimum, both of unit length in the nine coefficients. Along one of them the cost rises steeply; along the other the same step costs 8.0 times less, and a design constrained to move that way gives up almost nothing. That is why restricting the nine numbers to be the inverse of three realisable primaries — three degrees of freedom gone — costs about one per cent, while requiring them to hit the three dichromat confusion points costs seventy. Counting what a constraint removes predicts neither number; what matters is which way it points.

    A constraint costs what it points at

    Three primary chromaticities remove three of the nine numbers in an adaptation basis and cost one per cent. Three dichromat confusion points remove six and cost seventy. Counting what a constraint removes predicts neither, because an optimum is a long bowl and what matters is which way the constraint points.

    part 10 · limits
  23. The points a ratio needs are proportional to the ratio. A scatter of 133 points on logarithmic axes, one per MacAdam ellipse under each of six coordinate systems. The horizontal position is that ellipse's true axis ratio; the vertical is the smallest sample size, from a sequence of doublings, at which the sampled ratio comes within one per cent and stays there. A line of slope 0.94 runs through them, against a predicted 1 — the minimum's notch is 0.88 σ₂/σ₁ radians wide, so resolving it takes a number of points proportional to σ₁/σ₂, and nothing about the basis or the ellipse enters beyond that. An ellipse with a ratio of two needs seventeen points and one with a ratio of twenty-six needs a hundred and ninety-two.

    An extremum is not a sample

    Three separate measurements in this collection took a maximum or a minimum over a sample of a set — forty-eight points round an ellipse, twenty-four directions out of an optimum, fourteen changes of light off a list. All three are wrong, all three are wrong in the same direction, and the error in each grows with the very quantity being measured.

    part 11 · limits
  24. What a constraint costs is how far it pushes, in the directions that are seen. A scatter of every constraint imposed here on the nine free numbers. The horizontal axis is the length of the displacement from the optimum measured only in the six directions the objective can see; the vertical, on a logarithmic scale, is the excess cost that displacement actually carries. Requiring the basis to be the inverse of three realisable display primaries sits at the bottom left, at 0.068 and 0.022 ΔE00 — it removes three degrees of freedom and moves the answer almost nowhere. Requiring it to hit the three dichromat confusion points removes six and pushes 13 times as far, for 0.68. The vertical spread at similar horizontal positions is the part a count of parameters cannot predict.

    A constraint is a direction and a distance

    Four restrictions on the same nine numbers cost nothing, nothing, two per cent and seventy. How many parameters each removes predicts none of it. What does is the quadratic form evaluated along the displacement — and showing that it does means walking in towards the optimum rather than arguing at the edge, because at the edge the prediction is out by a factor of three.

    part 11 · limits
  25. A quadratic is believed least far at the one place anybody takes one. One bar per basis: the radius, in the nine coefficients, within which the second-order model predicts the objective to within ten per cent in every one of eighteen directions. The shortest bar is the objective's own optimum, at 2.3×10⁻², and the longest is XYZ scaling at 1.1×10⁻¹ — several times further. The reason is not that the model is worse at a minimum but that it has less to do there: away from one the linear term is exact and carries most of the change, so a ten per cent error in the prediction takes longer to accumulate. It does not make a Hessian at a minimum wrong; it says the picture drawn from it describes the smallest neighbourhood in the table.

    How far a quadratic can be believed

    A second-order model has a radius inside which it describes a surface and outside which it does not, and that radius can be measured. Measured at eight places on one objective, it is smallest at the optimum — the one place anybody ever takes a Hessian.

    part 11 · limits
  26. A published residual is a mean, and the worst object in the room costs twice it. Three bars for each of the 14 changes of light in the adaptation census, ordered by how uneven the change is across surfaces. The first bar is the published mean residual. The second is the worst single surface in the audit's published test set. The third is the worst surface anywhere in the region that set is drawn from, found by search rather than by reading a maximum off a lattice. The mean-to-worst ratio runs from 1.90 to 4.02 and averages 2.43, so every published adaptation number has a worst case about twice it that no essay had ever quoted. The gap between the second and third bars is the other finding: a maximum over 125 sampled points understates the region's own maximum by up to 34 per cent.

    A mean is not a worst case

    Every adaptation number this collection publishes is an average over objects, and the reader asking whether adaptation will fail them is asking about the object it fails on. That object costs between 1.9 and 4.0 times the published figure, and how uneven a change of light is across objects turns out to be a property of the change rather than a constant.

    part 11 · limits
  27. What the confusion points charge, across a population. A histogram of 200 members of a population of eyes, each scored by what the adaptation basis their own confusion points determine leaves after the gain. It runs from 1.22 to 2.24 ΔE00 with a median of 1.78. Vertical marks show the unconstrained floor at 0.97, the published transforms, and the single observer this site quotes at 1.65. The distribution straddles Hunt–Pointer–Estévez and reaches below CAT16: 18 per cent of members are better served by their own receptors than by a matrix built to make a gain behave, and 2 per cent than by the current recommendation.

    The price is also the person

    The receptor construction costs seventy per cent above the unconstrained floor, which is a number usually quoted as a property of the construction. Propagated across a population of eyes it runs from a quarter above the floor to a hundred and thirty per cent above it, and the population's own spread is wider than the entire gap between the published transforms the seventy per cent was being compared against.

    part 12 · limits
  28. Room is not safety: two orderings of the same three claims. Three pairs of bars, one pair per published statement about the confusion points. The upper bar in each pair is the margin — how far the measured number is from the threshold that makes the statement true, as a ratio. The lower bar is the headroom — the factor by which one declared width of the population model would have to be wrong for the statement to fail. Both start at one, which is the line. Ordered by margin the three read the protan margin, the tritan margin, the deutan margin; ordered by headroom they read the protan margin, the deutan margin, the tritan margin, and the middle two change places. Every one of the three is inside a factor of two of failing, which the margins do not say.

    What would have to be wrong

    A great many statements here have thresholds written into them, which turns out to make an audit possible — for each one, the smallest change in a declared input that would stop it holding. Most are unreachable. One is inside a factor of one and a third.

    part 12 · limits
  29. Every census row under five constructions of the same test set. A slope chart with 5 columns — lattice, coarse, fine, uniform, natural — and one line per change of light in the census, each line joining that row's mean residual under each construction. Four of the five columns describe the same region of surfaces walked at different densities or against different measures; the last is the clamped, realistic family, which is not linear in its parameters and is therefore answering a slightly different question. The levels move: between the coarse and fine lattices every row shifts by seven to nine per cent, in the same direction, which is a common-mode factor no published residual here has ever carried. The order almost survives. Inside the region exactly one pair crosses, and it is the pair the standard error had already flagged; under the clamped set two more cross, including one the error separates by nearly nine standard errors. The crossing lines are drawn heavy.

    The instrument named the pair that moved

    A standard error over a test set flagged four steps of the adaptation census as unresolved. Rebuilding the set three different ways reversed exactly one pair, and it was one of the four. Rebuilding it to a different rule reversed a pair the error separated by nearly nine standard errors — which is not a failure of the instrument but a statement of what it is about.

    part 12 · limits
  30. How far each census row moves when the test set's own description does. A grid of bars, one row per change of light in the census and one bar in each row per number that describes the region the test surfaces are drawn from: how saturated they are, how bright, and how far the two modulations may go together. A bar's length is the elasticity — the proportional change in the published residual for a proportional change in that number. Saturation runs from 0.49 to 0.91 and brightness averages 0.104, so a test set's chroma range is nearly everything and its lightness range is nearly nothing. For scale, the largest elasticity found anywhere among this collection's five declared population widths is about a half — and those at least have declared ranges, while these three numbers have never been quoted with one.

    The input nobody declared

    An audit that swept every declared width in this collection found the largest elasticity anywhere to be about a half. The most elastic input turns out to be one that was never declared, never quoted with a range and never varied — and being undeclared is exactly why it escaped the audit that was looking for it.

    part 12 · limits
  31. Every census row under five constructions of the same test set. A slope chart with 5 columns — lattice, coarse, fine, uniform, natural — and one line per change of light in the census, each line joining that row's mean residual under each construction. Four of the five columns describe the same region of surfaces walked at different densities or against different measures; the last is the clamped, realistic family, which is not linear in its parameters and is therefore answering a slightly different question. The levels move: between the coarse and fine lattices every row shifts by seven to nine per cent, in the same direction, which is a common-mode factor no published residual here has ever carried. The order almost survives. Inside the region exactly one pair crosses, and it is the pair the standard error had already flagged; under the clamped set two more cross, including one the error separates by nearly nine standard errors. The crossing lines are drawn heavy.

    What the audit still cannot reach

    Two rounds have now swept every declared width in this collection and one of its structural choices. Three structural choices remain, none of them has a multiplier to sweep, and the reason each resists is different — which makes the list a description of where this kind of audit ends rather than a queue of work.

    part 12 · limits
  32. What six of this collection's published numbers do when the unit changes. Six quantities, from six calculations that share nothing: a change of light after an observer has adapted, a camera profile's error, the gap between the two standard observers, a metameric pair under the lamp that breaks it, the same image on two papers, and an observer two seconds into a new room. Each is recomputed under all six units and every unit is calibrated onto ΔE2000's scale first, so the bar is not a change of units in the ordinary sense. The bar is the ratio of the largest reading to the smallest, and it runs from 1.71 to 2.30. Five of the six are printed in ΔE2000 by the essays that report them; the sixth is printed in CAM16-UCS, because the model it comes out of defines that unit.

    A choice with no magnitude

    An audit can multiply a width by 1.25 and report an elasticity. It cannot multiply CIEDE2000 by anything. Auditing a structural choice needs a different instrument, and building one shows that six published numbers in this collection each carry a factor of about two of unit-choice — after the change of scale has been taken out.

    part 12 · limits
  33. Which steps of the census ranking a change of unit reverses. Every adjacent pair in the published census ranking that at least one unit puts the other way round. The bar counts how many of the five other units reverse it. The marker on the left says whether the test set had already declared the pair unresolved — a gap smaller than twice its own paired standard error, which is a statement about sampling over 125 surfaces and shares no arithmetic with a change of ruler. The two pairs every unit reverses are both flagged, which is the agreement. The pair at the bottom is the disagreement: the test set resolves it at 9.1 standard errors and four of the five units reverse it anyway, because a sampling error cannot see a change of ruler and a change of ruler cannot see a sampling error.

    Two instruments and one ranking

    A sampling error over a hundred and twenty-five surfaces and a change of colour-difference formula share no arithmetic at all, and they were asked the same question of the same table. Every adjacency the whole menu reverses had already been flagged as unresolved. And one the test set settles at nine standard errors is reversed by four of the five formulae, which is what makes them two instruments rather than one.

    part 13 · limits
  34. What six of this collection's published numbers do when the unit changes. Six quantities, from six calculations that share nothing: a change of light after an observer has adapted, a camera profile's error, the gap between the two standard observers, a metameric pair under the lamp that breaks it, the same image on two papers, and an observer two seconds into a new room. Each is recomputed under all six units and every unit is calibrated onto ΔE2000's scale first, so the bar is not a change of units in the ordinary sense. The bar is the ratio of the largest reading to the smallest, and it runs from 1.71 to 2.30. Five of the six are printed in ΔE2000 by the essays that report them; the sixth is printed in CAM16-UCS, because the model it comes out of defines that unit.

    Three choices reached

    Two rounds ago this collection named three things it rested on and could not audit — a unit, a diagonal and a template. All three are now reached, and the interesting part is not the three answers but that four of the round's own predictions were refused by the arithmetic and one of its measurements was wrong in a way only a cross-check caught.

    part 13 · limits
  35. The six arguments a surface's response has, and the one this model keeps. A surface's response to light is a function of six arguments: the wavelength, direction and place the light arrives with, and the wavelength, direction and place it leaves with. The model every colour here is computed from keeps one number per wavelength, which means it takes the diagonal of the first pair, integrates the second away, and assumes the third pair equal. Each departure drawn here restores one of them. The fourth departure is not on the diagram: the wavelength grid is the range of the index that was kept rather than an index that was dropped, which is why it is the cheapest of the four to fix and was still not fixed.

    The model has six arguments

    Every colour computed here is an integral of a reflectance against a light against three curves, and a reflectance is one number per wavelength. A real surface's response is a function of six arguments — the wavelength, direction and place light arrives with, and the three it leaves with — so the model keeps one of them, takes a diagonal, integrates two away and assumes two more equal.

    part 13 · limits
  36. Eight conditions under which the model equation is exact, and how exact each one is. Each of the four departures vanishes if either of its two factors is empty, which is eight conditions. The axis is logarithmic in the residual that is left when the condition is imposed. Three of the eight are identities: the fluorophore's loading is zero so the emitted term is an empty sum, and a Lambertian surface or a uniform field makes the pairing's second argument identically zero. The other five are limits — a Gaussian excitation band has no edge, an opaque sample still has a kernel a few microns wide, a four-metre aperture is still finite, and the observer is small rather than absent at 380 nanometres. Each limit is drawn with the sequence its residual falls along as the condition is pushed, because a small number is not evidence of a limit and a falling sequence is.

    Either factor being zero

    Four different departures from the colour integral turn out to have one algebraic form — each is an inner product of something the sample does that the model has no slot for with something the light does that the model assumed away. Either factor being zero makes the departure exactly zero, and the sizes of the two factors decide neither how large it is nor which way it goes.

    part 13 · limits
  37. Which of the collection's published quantities a departure can be pushed through. The six quantities the previous round recomputed under six different colour-difference units, and whether the same treatment works for a departure. Two do: the adaptation census and the metameric pair both take reflectances and a light, which is what a departure acts on. Four do not, and the reasons are different in each case rather than a single obstacle. A unit is a function applied to the answers, so it can be swapped at the end of any computation; a departure changes the object at the start, so it has to be accepted by every stage in between. That is the practical difference between auditing a convention and auditing a structure.

    A departure is not a unit

    The previous round audited six published quantities by swapping the unit they were quoted in — a function applied at the end of each computation. Nothing of that shape works here. A departure changes the object at the start, so every stage in between has to accept it, and only two of the same six quantities can take one at all. The fourth cannot even be expressed in the interface.

    part 13 · limits
  38. The six arguments a surface's response has, and the one this model keeps. A surface's response to light is a function of six arguments: the wavelength, direction and place the light arrives with, and the wavelength, direction and place it leaves with. The model every colour here is computed from keeps one number per wavelength, which means it takes the diagonal of the first pair, integrates the second away, and assumes the third pair equal. Each departure drawn here restores one of them. The fourth departure is not on the diagram: the wavelength grid is the range of the index that was kept rather than an index that was dropped, which is why it is the cheapest of the four to fix and was still not fixed.

    The audit that changed the object

    Three rounds audited this collection's numbers, its sets and its conventions, and each one ended by naming the same thing it could not reach — that a surface is a reflectance. This round reached it, found that four departures share one algebraic form, had two of its predictions refused, and discovered that its own hemisphere quadrature had been passing a convergence check by luck.

    part 13 · limits
  39. How far this collection's analytic observer is from the tabulated one. The construction every figure in this family uses is three pigment absorptances through one fitted 3×3, and this is the residual of that fit against the CIE's 1931 functions: root-mean-square error as a percentage of each curve's peak, and the colour difference it produces over forty-two surfaces. The short-wavelength function is the worst at 16.4 per cent, which is where a pigment template is weakest and where the ocular media are doing most of the work. The median colour difference is 1.42 ΔE₀₀, so this is an observer of the right shape rather than a copy of the table — and every departure in this family should be read beside that number rather than against zero.

    The reference had to be built

    A five-nanometre error cannot be measured with five-nanometre data. Interpolating the tables and integrating finely measures the interpolator, not the grid — so the audit of this collection's index had to be run against an observer made of formulae, and the price of that is a residual of 1.42 ΔE₀₀ that every number in the section is read beside.

    part 13 · limits
  40. What this collection's grid does to its own observer audit. Two bars per light: the mean departure of the observer computed on this collection's five-nanometre grid, and the same computation on a quarter-nanometre one. For five of the six lights the two agree to two decimal places, which is what a well-sampled spectrum looks like. For the laser projector the coarse answer is exactly zero and the fine one is 2.34 — the largest in the table. On a five-nanometre grid a three-line spectrum with lines at 465, 532 and 638 nanometres is a one-line spectrum, and a single wavelength is a stimulus every observer agrees about to the last bit. The two departures do not compound here; the first conceals the second.

    The grid hid the observer

    On this collection's five-nanometre grid a three-laser projector's observer disagreement is exactly zero. On a quarter-nanometre grid it is 2.34 ΔE₀₀ and the largest in the table. The two audits of this round meet here, and the first one does not compound with the second — it removes it.

    part 14 · limits
  41. The arguments a standard observer does not have. Seven choices inside a set of colour-matching functions, each with the shape it takes and what it is worth in ΔE₀₀ on a red pigment under a 6500 K radiator. Six are measurements: a field size, an age, a macular density, a cone optical density, three peak wavelengths and a rod contribution. The seventh is not — a change of basis is a change of curves and not a change of observer, and its entry is exactly zero because the space an experiment measures is what an observer is. Printing that zero beside the others is the clearest statement of what the other six are measurements of.

    An observer is a contract

    Six departures, all above a delivery tolerance, none dominant, and no reader matching the standard on any of them. That would be a demolition if the standard observer were a description of an eye. It is not — it is an agreement about what a number means, and an agreement is not falsified by being unlike anybody.

    part 14 · limits
  42. Where a point-sampled patch stops resolving a lobe. The horizontal axis is the wall's roughness, logarithmic; the vertical is how far the answer moves when the cone quadrature is refined from eight directions to sixteen, also logarithmic. A patch in a cube subtends a cone of angular radius 25.8° at the face opposite, and a microfacet lobe of roughness a is about a radians wide, so a lobe below about 0.15 is narrower than the quadrature that samples it. The movement at 0.05 is 21.2 ΔE₀₀ and at 0.3 it is 0.033. This is where the method stops, not where the paint does: matt, eggshell and satin finishes are inside it and a high-gloss varnish is not.

    Where a patch stops being a point

    A patch in a cube subtends a cone of 25.8° at the face opposite. A microfacet lobe of roughness 0.05 is about three degrees wide. Point-sampling the second inside the first returned a chroma of thirty-four thousand and a negative lightness, and the boundary between working and not working is measured rather than declared.

    part 14 · limits
  43. The pairing against the direct computation, for each departure that admits both. Each departure can be computed twice: directly, by taking the difference between the fuller model and the integral one, and as a pairing — an inner product of the sample's deviation with the light's. The bar is how far apart the two answers are, relative to the answer, on a logarithmic axis. The three directional rows agree to a part in a thousand billion, which is the arithmetic of one shared quadrature. The lateral row agrees to three parts in a hundred thousand, and the gap there is the radial quadrature rather than the identity: the two integrals are taken over different grids. The pairing is not an approximation to the departure. It is the departure, written so that its two factors are separate.

    Three audits and one shape

    The tabulation, the observer and the scene solver have nothing in common as subjects. Each turned out to hold a departure that is a pairing of two deviations, vanishes exactly when either is empty, and had been invisible because its parameter had no call site. Three subjects, one shape, and the shape is the round's result.

    part 14 · limits
  44. The conditions under which an observer's departure is exactly zero. A departure of the observer is the pairing of something belonging to the observer with something belonging to the stimulus, so emptying either factor empties the product. The axis is logarithmic in what is left when the condition is imposed. Six rows empty the stimulus's factor — a perfectly neutral sample is the same colour for every observer, at any age and any field size — and two empty the observer's, since a gain on each cone and a change of basis are both absorbed exactly. All eight are identities rather than small numbers. The last two are the same two conditions imposed in a published cone space rather than in the observer's own, and they are worth eight and thirteen units: the identity is about the eye, and the arithmetic everybody uses is in somebody else's coordinates.

    The conditions are the result

    The round measured about twenty departures and established ten conditions. The departures are numbers that depend on a sample, a light and a construction; the conditions are exact, they hold under every substitution tried, and they are what a reader can act on. A size is a measurement and a condition is a mechanism.

    part 15 · limits
  45. Which of the collection's published quantities a departure can be pushed through. The six quantities the previous round recomputed under six different colour-difference units, and whether the same treatment works for a departure. Two do: the adaptation census and the metameric pair both take reflectances and a light, which is what a departure acts on. Four do not, and the reasons are different in each case rather than a single obstacle. A unit is a function applied to the answers, so it can be swapped at the end of any computation; a departure changes the object at the start, so it has to be accepted by every stage in between. That is the practical difference between auditing a convention and auditing a structure.

    What this round could not reach

    Three audits, about twenty departures and ten conditions, and a longer list of things that were named and not measured. Every item on it is specific, most of them are an afternoon's work, and the reason none was done is the same in every case — the round ran out of round.

    part 15 · limits
  46. What a slope limit costs the object-colour solid, direction by direction. For each transition width, how much of its ideal reach the solid keeps: the median direction, the tenth percentile, and the worst. At twenty nanometres the median keeps 0.997 and the tenth percentile 0.985; at eighty they keep 0.946 and 0.766, and at 160 0.826 and 0.417. The worst direction falls from 1.00 at five nanometres to 0.20 at 160, with directions reaching under five units beyond black set aside. The cost is in a corner only at widths sharper than an ordinary pigment's.

    The limits assume a pigment that switches instantly

    The hardest boundary in colorimetry is reached by reflectances that jump between nought and one at a wavelength, and no material does that. Constrain the jump to take twenty nanometres — a sharp dye — and the median direction of the object-colour solid loses under half a per cent of its reach. Constrain it to eighty, an ordinary pigment, and the median loses five per cent, the tenth percentile nearly a quarter, and seven directions in ten lose more than one. The cost is in a corner only for chemistry sharper than paint.

    part 16 · limits
  47. How many directions a slope limit costs, under four lamps. For each transition width and each lamp, the share of the solid's directions that lose more than one per cent of their reach — each lamp's solid against its own ideal. Daylight, a tungsten lamp and a phosphor LED run close together. The three-emitter LED, whose power sits in lines at 455, 530, 625 nanometres, costs 62 directions at forty nanometres where daylight costs 183, and by eighty — about the spacing of its lines — it costs 214 against 218.

    Three lines spare a slow pigment

    A pigment that cannot switch faster than forty nanometres loses more than a per cent of its reach in 183 of the object-colour solid's 305 directions under daylight. Under an LED whose light sits in three narrow lines, it loses that much in 62. Between the lines almost nothing is measured, so a slow reflectance can do its changing there — until its transitions are as wide as the lines are far apart, at which point the lamp stops helping and the count jumps to daylight's.

    part 17 · limits
  48. A 40-nanometre limit written in nanometres and written in energy. The transition width a reflectance is allowed, across the spectrum, for two ways of stating the same sharpness. Written in nanometres it is 40 everywhere. Written as a fixed spread of photon energy, which is how an absorption band's width is set, it is 40 at 550 nanometres and grows as the square of the wavelength: 21 at 400 and 67 at 700. The steps are the quantisation the calculation actually imposes.

    A limit written in energy charges the reds

    A slope limit on reflectance is usually written in nanometres and applied the same way across the spectrum. An absorption band's width is closer to a fixed spread of photon energy, which is nearly twice as many nanometres at 700 as at 500. Written that way, a limit that is forty nanometres at 550 is kinder to the object-colour solid overall — 489 of 913 directions lose a per cent rather than 544 — and it charges the reds more. Which directions pay is decided by one thing: whether their optimal edges fall above or below the reference wavelength.

    part 17 · limits
  49. What a fourth emitter costs, by where it is put. A three-emitter LED with one more emitter added at each position from 470 to 610 nanometres, and for each lamp the number of the object-colour solid's directions that lose more than a per cent of their reach to a 40-nanometre transition limit. The three-emitter lamp itself costs 62 of 312. A fourth emitter in the middle of the blue-to-green gap, at 490 nanometres, costs 172; one at 540, beside the green emitter, costs 65. The two dips sit on the existing lines and the two peaks sit between them.

    A fourth emitter spends the gap it fills

    A three-emitter LED lets a pigment that takes forty nanometres to switch reach most of its ideal solid, because the lamp is dark where the pigment is slow. Adding a fourth emitter to render better takes that darkness back — but only if it is put in the middle of a gap. At 490 nanometres it costs 172 of the solid's 312 directions against the three-emitter lamp's 62, and renders two points worse. At 540 it costs three directions and renders two and a half points better.

    part 18 · limits
  50. The rescue is spent on light between the lines, not on width. The three emitters of a narrow-band LED broadened together, from their nominal widths up to six times them, plotted against the light left in the darkest of the lamp's two gaps as a share of its peak. Up is the share of the object-colour solid's directions that lose more than a per cent of their reach, at three transition limits, with each limit's cost under daylight marked at the right. At forty nanometres half of the rescue is gone by a floor of 7.4 per cent — emitters only 1.30 times their nominal width — and all of it by about a fifth. At twenty nanometres and at eighty there is little to lose either way.

    The gap has to be dark, not the line narrow

    A lamp whose light sits in three narrow emitters lets a blunt pigment reach most of its ideal solid, and the reason was given as the spacing of the lines. Broadening those emitters without moving them says otherwise. At 1.3 times their nominal width the lamp still looks like a line spectrum, its closest spacing has not changed at all, and half the rescue is gone — because the darkest point of the narrow gap has risen from one per cent of the lamp's peak to seven.

    part 18 · limits
  51. How steep an edge a band draws, and what it costs. A Gaussian absorption band of stated width produces a reflectance edge whose own width depends on how deep the band is, because the exponential saturates: where the absorbance is large the reflectance is already nought and the edge is over. A forty-nanometre band at an absorbance of 3 draws an edge 32 nanometres wide; at 12 it draws one 21 nanometres wide. Below an absorbance of 2.3 the band never reaches a reflectance of a tenth at all and has no edge in this sense. The dashed lines are each band's own width, which is the number a slope limit would have been given.

    A sharp edge is bought with depth

    A slope limit on reflectance was introduced as the weakest honest statement of a pigment's bluntness, with a band-shape limit named as the stronger version to be written later. Written, it is not stronger. Three absorption bands none narrower than forty nanometres reach further than a forty-nanometre slope limit in 94 of 154 directions of the object-colour solid, because a band's width and the width of the reflectance edge it draws are different quantities — and what converts one into the other is how much colorant is in the film.

    part 19 · limits

All series