Concept

Cone fundamentals — where it appears

The spectral sensitivities of the three cone types, from which the colour-matching functions are a linear transform. They are not measurable directly on an intact eye, so every published set is inferred — from dichromats, from microspectrophotometry, or from the matching data themselves.

Named by 47 essays across 7 fields — each of them below, with the objects they name alongside it.

The CIE 1931 colour-matching functions. The three functions that turn a spectrum into three numbers. They are all positive, which is why XYZ exists — the RGB functions they were derived from are not. ȳ is by construction the luminous efficiency function, which is why luminance comes out of Y.

Seventeen observers in 1931

The standard observer that governs every colour specification in industrial use is an average over seventeen young British men, measured with equipment from the 1920s. It is known to be wrong in the blue, the correction has existed since 1951, and it has never been adopted.

limits · Limits
A spectrum, weighted three ways, and the three numbers left over. The illuminant D65 above; below, the same spectrum multiplied by each matching function. The area under each product is one coordinate of XYZ. Everything else about the spectrum — its shape, its structure, all its remaining degrees of freedom — is discarded here.

Three numbers

A spectrum has as many degrees of freedom as anyone cares to give it. The eye reports three. Everything colour science can do, and every way it fails, follows from that one collapse.

eye · Cones
Longitudinal chromatic aberration of the eye, focused at 555 nm. Thibos's chromatic eye, plotted as defocus in dioptres relative to 555 nm. The curve crosses zero exactly once, at the wavelength the eye is accommodating on, and everything else is out of focus — by -1.22 D at 420 nm and 0.50 D at 680 nm. Through a 3 mm pupil that first figure is a blur circle of 12.6 minutes of arc, against a foveal acuity limit of about one. The eye is never in focus across the spectrum and never can be.

Nothing is in focus at both ends

The eye carries about two dioptres of chromatic aberration across the visible band, which is a strong reading prescription. Whatever it is focused on, most of the spectrum is landing somewhere other than the retina — and the cone class that gets the worst of it is the one the retina bothered least to sample.

eye · Cones
Three retinas of different composition, making identical colour matches. Seeded mosaics at L:M ratios of 1, 4, 16 to one — the range found between people, and a 16-fold difference in what the retina is made of. A colour match is the claim that two spectra produce equal excitation in all three cone classes, and changing how many of a class there are multiplies that class's excitation by a constant, which cannot disturb an equality. The relation between the two test spectra is identical to twelve decimal places across the whole sweep. Luminance, which is a weighted sum rather than an equality, moves by 1.33× over the same range. That asymmetry is why a standard observer exists and why V(λ) has a much larger between-observer variance than the colour-matching functions do.

The mosaic is not the observer

The ratio of long-wavelength to medium-wavelength cones varies between ordinary people by a factor of sixteen. Those people make the same colour matches, to twelve decimal places, and that single fact is the reason a standard observer can exist at all.

eye · Cones
A camera's spectral sensitivities, after the infrared-cut filter. Silicon quantum efficiency times the colour-filter dye times the infrared-cut filter, per channel, on a grid running to 1100 nm rather than to 780. With the filter removed, 68 per cent of the area under the three curves lies beyond the visible band, and all three curves are the same curve out there.

A camera is a fourth observer

The 1931 functions, the 1964 functions and a person's own cones are three sets of three curves that collapse a spectrum onto three numbers. A camera is a fourth, built from silicon and dye rather than from pigment and neural wiring, and it agrees with none of them.

imaging · Capture
The L cone's sensitivity at three axial pigment densities. Each curve is normalised to its own peak, so the only difference visible is shape. Raising the density from 0.1 to 0.9 widens the curve from 113.6 to 145.9 nm at half height while the peak stays within 5 nm of where it was. That is Beer–Lambert saturating: at the peak the pigment already absorbs nearly everything, so more of it can only catch more light in the wings.

A cone absorbs its own light

A photopigment's absorbance is a property of a molecule; a cone's sensitivity is that molecule stacked in a column deep enough to absorb most of what arrives. The stacking broadens the curve by thirty-five nanometres, and two observers differing in nothing else disagree about a match that is exact for one of them.

eye · Cones
One adapting colour, two answers. The left patch is what was stared at. The middle is the afterimage the cone-gain arithmetic predicts at 15 per cent adaptation; the right is the inverted code values. They are 22.1 ΔE00 apart. The gains that produced the middle patch are 0.95, 1.06, 1.69 on the long, medium and short cone classes — the reciprocal of what each class had been receiving, taken 15 per cent of the way.

An afterimage is an adaptation

The demonstration everybody gives is an inverted image, which is a statement about a file format. Running the receptoral arithmetic instead puts the afterimage of a saturated red sixty degrees of hue away from the inverse — and outside what any display can show.

brain · Appearance
Cone density, out from the centre of gaze. Quoted landmarks with logarithmic interpolation between them: 199,000 cones per square millimetre at the fovea, 9,500 at ten degrees — a factor of 21. The shaded bands are the two standard observers' fields. The 2° observer averages over a region whose density falls by 3.3× between its centre and its edge and the 10° observer by 12.4×, which is what "a 10° field" contains and is why the two sets of matching functions are different shapes rather than the same shape scaled.

Colour stops at the edge of sight

Cone density falls twenty-one-fold between the centre of gaze and ten degrees out, and the three channels give out at three different rates — so a colour difference in the periphery does not merely shrink, it turns. At the exact point of fixation there are no short-wavelength cones at all.

eye · Cones
Grassmann's four laws, exact — and the two things that break them. For a linear observer every one of the four is exact and the residual is floating point, which is the control that makes the two failures below measurements rather than artefacts. Rods break a cone-metameric match by 23 per cent of a rod excitation at dusk; bleaching breaks it by 0.59 per cent of a cone excitation in the sun. Both are stated as fractions of a receptor's own response, so they can be put on one scale.

The laws that make colour add up

Colorimetry is an integral, and an integral assumes matching is linear. Grassmann's four laws are exact for a linear observer, to floating point — and they fail at both ends of the light range, by two different mechanisms, leaving colorimetry an operating band of three and a bit decades that no standard states.

matching · Gamut
One match, and what it says about the observer making it. The anomaloscope: a monochromatic 589 nm yellow set against a mixture of 545 and 670 nm. Only two cone classes respond at those wavelengths, so the match is two equations in two unknowns and has one solution for any observer whose two pigments differ. The bar is the fraction of the accepted band; the mark is the solution. A normal observer accepts 0.7 per cent of the scale; an observer whose two pigments are the same accepts all of it, because their two equations are one equation twice. Nothing here is fitted to clinical data: the pigments are the same template used for every observer here, at stated peaks, and the match is the solution of the linear system.

One match names the observer

A yellow at 589 nanometres set against a mixture of 545 and 670 is two equations in two unknowns. It has one solution for a normal observer, a solution somewhere else for an anomalous one, and no unique solution at all for a dichromat — whose two equations are one equation twice.
matching · Gamut
One light, two eyes. The same stimulus through two sets of ocular media differing only in macular pigment (0.35 and 0.41) and lens age (55 and 55 years). Compared under one white the two differ by ΔE00 1.00; compared with each eye adapted to its own long-run white — which is what the visual system does — by 0.00. The second number is why nobody notices, and the first is why a person who has had one lens replaced reports that the other eye has turned yellow.

Nobody here has two eyes

One person's two eyes differ in macular pigment and lens density, so the same light produces two colours — a whole ΔE00 apart for an ordinary pair, seven for one replaced lens. Adaptation hides it exactly, which is why nobody notices and why nothing in colorimetry has a term for it.

limits · Limits
A fourth primary, swept — every setting an exact match, none of them the same. Four primaries matching three numbers leave one degree of freedom. Along the horizontal axis it is the fourth primary's share of the white's luminance; at each value the other three powers are solved exactly, so every point on this plot is a floating-point-exact match for the reference member — worst residual 1.3e-15 — and no colorimeter can tell them apart. What the population sees runs from 13.7 ΔE00 at the ninety-fifth percentile to 17.3, a factor of 1.26. The best setting is the largest share the arithmetic admits, so what stops it is not colour but the requirement that four powers stay positive.

Four primaries have a choice

Three primaries matching three numbers have one answer. Four have a family of them, every member exact to floating point for the observer they were solved for — and the members are not equally good for anybody else, so a display with a fourth primary has a setting that is robust to who is looking at it and a setting that is not.

matching · Gamut
Coming back from a bleach, against the clock already measured. A 94 per cent bleach, and the pigment returning at its own time constant of 120 seconds. The lower curve is the site's slow neural adaptation constant, 60 seconds, started from the same place — it is finished while the chemistry is barely half done. Regeneration does not speed up because the light went away: the rate constant is the same one it always was, which is why the recovery is slow while the bleaching was fast.

The slowest clock is chemical

An earlier essay here joined the afterimage to the adaptation clock and named what was still missing — a third gain, upstream of both, in the pigment itself. It is twice as slow as anything measured before it, it leaves a coloured after-tint from a white field, and at steady state it cancels exactly, which is why nobody has ever needed to model it.
eye · Cones
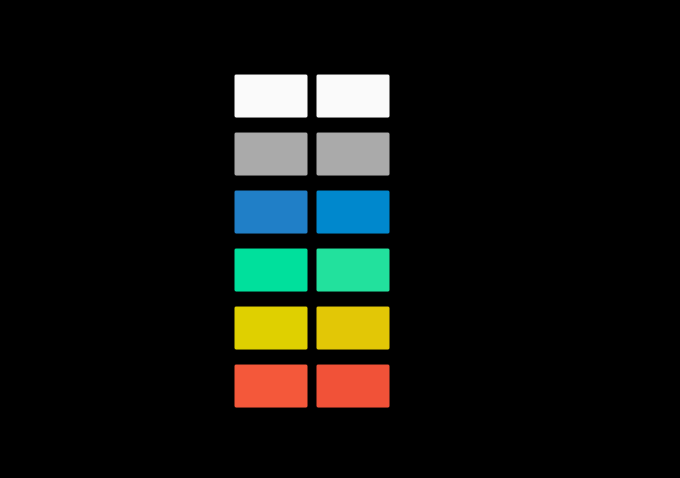
What the same eye reports about one field, in the middle and at the edge. Each row is a uniform field, drawn at the most saturated version of itself this page can show — the percentage is how much of the full stimulus survived, the rest being the adapting light added to bring it inside the gamut. The left patch is what the centre of gaze reports and the right one what 10 degrees out reports, each adapted to the same light as that position sees it. The adapting white comes out identical to 5e-13, because an adapted eye cancels its own filter exactly. Nothing else does, and the largest difference is in the blue. tungsten light is not drawn: it cannot be shown at any useful saturation, and at full strength it differs by ΔE00 1.87.

One person is two observers

The macular pigment is a yellow screen over the fovea and nowhere else, so a cone at the centre of gaze and a cone ten degrees away have different colour-matching functions in the same eye. A match made in the middle comes apart at the edge by six units — and fitting one filter to the gap between the CIE's two standard observers gives a density of 0.40 against a measured 0.35.

eye · Cones
Every published adaptation transform, and one computed from daylight, on every change. What each basis leaves an adapted observer with, row by row. Darker is worse. The last column is not a published transform: it is the basis in which a change from D65 to D50 is exactly diagonal, computed in closed form from the two spectra with nothing fitted. It is far the best on the daylight rows and it is beaten on the discharge lamps, which is the trade the published transforms are sitting in — they were fitted to data containing both kinds of light and are therefore optimal for neither. Over the census as a whole the winner is Bradford at ΔE00 1.14.

A gain needs a basis

Adaptation scales three signals, and which three is a choice. The basis in which a change from D65 to D50 is exactly diagonal can be computed in closed form from the two spectra, it beats every published transform on daylight by a factor of five, and it loses to all of them on a fluorescent tube.

brain · Appearance
The share of itself each change leaves behind, and the smallest is inside the eye. The residual as a fraction of the change rather than as a colour difference, which sorts the census differently. At the top is the macular pigment — the filter in front of the central few degrees of one's own retina — leaving 2.4 per cent of itself. It is a fixed transmittance multiplying the light and the white together, which is as close to a pure gain as anything here gets, and it is why nobody notices they have one.

The filters inside the eye

The macular pigment leaves 2.4 per cent of itself after adaptation — the smallest share of anything in this site's census of light changes, and less than half the next smallest. Fifty years of lens yellowing leaves 7.9 per cent, and the difference between the two says what a gain is actually good at.

eye · Cones
Which of these paints the display can show, and to how many people. Each row is a real surface under D65, and the bar is the share of 120 observers for whom a non-negative mixture of this display's three primaries reproduces it. The question has no observer-free answer: the paint is a reflectance, the primaries are emission spectra, and whether one matches the other is a fact about somebody's cones. A dot marks the rows the 1931 observer calls displayable. 2 of them are rows some real people cannot see, and 4 more go the other way.

A gamut has a population

Whether a display can reproduce a paint is a fact about somebody's cones, so the boundary of a gamut is not a curve but a band. On a laser projector, ten of twenty-eight boundary surfaces are ones the standard observer calls displayable and some real people cannot see — and the wider the gamut, the wider the band.

matching · Gamut
One observer's matching functions, in three of the bases the matches leave free. The three colour-matching functions after a change of basis 0.00 of the way from Hunt–Pointer–Estévez towards the set built from the dichromat confusion points. Every one of these triples predicts exactly the same matches as every other, because a match is an equality and a matrix applied to both sides of an equality changes nothing. What moves is where the peaks are and whether the curves go negative — these ones do not, and going negative is what the 1931 committee constructed XYZ to avoid.

The matches do not name the cones

Colour matching is the whole empirical basis of colorimetry, and it fixes the observer's three curves only up to a nonsingular 3×3 — nine numbers that no match, in any quantity, to any precision, can see. One particular choice of those nine is used throughout here, and it was made for a different purpose.

eye · Cones
Where a dichromat's confusions converge. Every pair of colours a protanope cannot tell apart lies on one of these lines, and all the lines meet at a single point — at (0.7465, 0.2535) for this class. The point is the chromaticity of the missing cone's own response direction, which is why it need not lie inside the diagram or correspond to any light at all. Two of the three do not. The three points between them carry six numbers, and six is two thirds of what the matching data leave undetermined.

A confusion point is a missing pigment

The nine numbers colour matching leaves free are fixed by three points on a chromaticity diagram, each of them the place where everything one class of dichromat cannot tell apart converges. Two of the three lie outside the diagram entirely, which is not a defect — a direction in tristimulus space need not correspond to a light.

eye · Cones
The same formula, applied after six different changes of basis. CIELAB's arithmetic — divide by a white, take a cube root, difference the results — run on six of the bases the matching data leave free. A linear change of basis leaves every match alone; a cube root does not commute with one, so the space, and therefore every colour difference computed in it, depends on which basis was in place before the nonlinearity. CIELAB's own choice gives an axis ratio of 3.44 and the best row here is LMS (confusion points) at 2.60.

A difference needs a basis too

A linear change of coordinates leaves every colour match exactly where it was. A cube root does not commute with one — so a lightness–chroma space, and every colour difference computed in it, is a property of the basis that happened to be in place before the nonlinearity. CIELAB's basis was chosen in 1931 for reasons that had nothing to do with difference.

difference · Metric
Where each published matrix puts the confusion points, whether or not it meant to. Every matrix from tristimulus values to cone responses commits itself to three confusion points, because the point is the direction the other two rows annihilate. The first row is the construction from the measured points and returns them exactly. The rest were chosen for other reasons and land elsewhere — Hunt–Pointer–Estévez, which this collection uses everywhere, misses the deuteranope's point by 1.28 in chromaticity. The worst here is 4.09.

The cones an appearance model uses

CIECAM16 adapts in three axes whose rows are labelled L, M and S, and they were fitted to corresponding-colour experiments rather than measured on receptors. Run the dichromat construction backwards on them and they commit to a deuteranope confusion point 1.45 away in chromaticity from the measured one — which is a test the axes were never asked to pass.

brain · Appearance
Four different bases, one adaptation model, one number. The middle row of the basis built from the confusion points multiplied by 0.21, 1, 3.7 and 11 in turn, with the resulting adaptation residual drawn as a bar in each case. The four bars are the same height to 9e-16 of a ΔE00, because the row's scale cancels exactly between the gain and the inverse. Three of the nine numbers a colour match leaves free are invisible to an adaptation model, which is why the six the dichromat data supply determine it outright with nothing left to fit.

The three numbers a gain cannot see

Colour matching leaves nine numbers free. Three dichromat confusion points fix six of them and three choices of unit fix the rest — and it turns out that a von Kries gain is exactly blind to those last three. So the dichromat data do not merely constrain an adaptation basis. They determine it, with nothing left over to fit.

eye · Cones
How cone-like a basis is, against how well it adapts. Each basis placed by how far its own implied deuteranope confusion point falls from the measured one (horizontal) and by how much an adapted observer is left with in it (vertical). The construction from the confusion points sits at zero on the horizontal by definition and near the top on the vertical. Nothing near the left of the picture is near the bottom: the closer a basis is to the receptors, the more a von Kries gain leaves behind. The unconstrained winner sits at 1.63 on the horizontal, further from the measurement than any published transform except CAT02 and Bradford.

The best axes are not receptors

If the axes that make a von Kries gain work were nearly the cone fundamentals, the published adaptation transforms would be cone-like and their departures would be slack in a fit. They are not. Minimise the residual over all nine free numbers and the winner sits further from the measured dichromat confusion points than any of them.

eye · Cones
Every basis against both objectives at once. A scatter with the mean adaptation residual across the illumination census on the horizontal axis and the mean axis ratio of MacAdam's ellipses in a lightness–chroma space on the vertical. Lower is better on both. The two winners sit at the two ends of an empty diagonal: the basis that adapts best leaves 7.70 on the vertical and the basis that discriminates best leaves 1.79 on the horizontal, each worse on the other objective than every published transform. The basis built from the dichromat confusion points is at (1.65, 2.60) — best at neither and within a factor of two of both floors, which no other entry in the picture manages.

No basis is good at both

The same nine numbers decide how well a von Kries gain reproduces a change of light and how nearly a lightness–chroma space makes the discrimination ellipses circles. Minimise either one and the other collapses. The basis built from the receptors is best at neither and is the only entry in the table respectable at both.

brain · Appearance
Nine eigenvalues, six of which exist. Nine points on a logarithmic vertical axis: the eigenvalues of the Hessian of the adaptation residual at its own optimum, largest to smallest. The first six run from 6.8×10² down to 7.6×10⁻¹, a condition number of 890. Then the axis drops: the seventh is 1.9×10⁻⁴, and the last three are separated from the sixth by a factor of 4.0×10³. Those three are not small curvatures. They are the finite-difference truncation error on directions along which the objective is exactly constant, and a shaded band marks them as the numbers the objective does not have.

The rank is the invariance

A von Kries gain cannot see the scale of a row of its basis. That is an identity, proved in a line, and it can be measured instead — as the rank of a second-derivative matrix. Both objectives this collection minimises over the observer's nine free numbers have a Hessian of rank exactly six, and the three directions they cannot see are the three scalings, to a hundredth of a degree.

eye · Cones
The bowl the eigenvalues describe and the bowl a sample found. Six points on a logarithmic vertical axis — the distance from the optimum of the adaptation residual to a 5 per cent rise along each of the six directions the objective can see — with a shaded band behind them showing the whole range 24 random directions reported. The eigen-radii run from 1.2e-2 to 3.6e-1, a factor of 29.8. The band runs from 2.2e-2 to 1.8e-1, a factor of 8.0, and sits entirely inside the ends of the true range: a random direction in nine dimensions carries a share of every eigenvector and so reports the middle of the bowl, never an end of it.

How long is the bowl

The optimum of an adaptation objective is twenty-nine times longer one way than another, and the two ends have names — the stiffest direction is almost entirely the short-wavelength row of the basis, the flattest almost entirely the long-wavelength one. Twenty-four random directions reported a factor of eight, and no number of them would have done better.

matching · Gamut
A template that cannot place a point, fitted three ways. Three rows, one per set of stimuli the pigment template's cone matrix can be fitted over, each listing the three confusion points that matrix implies. The protanope's point wanders from (0.99, 0.20) to (0.76, 0.13) against a measured (0.75, 0.25), and the deuteranope's moves by 22.5 in chromaticity — further than the whole diagram is wide. A copunctal point is where two nearly parallel planes meet, so a template good to a few per cent, which is far more than enough to place a spectrum, is nowhere near enough to place this. It is why the population is built by moving the measured points rather than by deriving them.

A template cannot place a point

This collection's model of an eye is good to a few tenths of a per cent at predicting what a cone catches, which is far more than enough to place a spectrum. Asked where that eye's confusion points are, it puts the protanope's at (0.99, 0.20) against a measured (0.75, 0.25) and the deuteranope's anywhere from (1.1, −0.5) to (−18, 11) depending on which stimuli the fit was made over.

eye · Cones
What the confusion points charge, across a population. A histogram of 200 members of a population of eyes, each scored by what the adaptation basis their own confusion points determine leaves after the gain. It runs from 1.22 to 2.24 ΔE00 with a median of 1.78. Vertical marks show the unconstrained floor at 0.97, the published transforms, and the single observer this site quotes at 1.65. The distribution straddles Hunt–Pointer–Estévez and reaches below CAT16: 18 per cent of members are better served by their own receptors than by a matrix built to make a gain behave, and 2 per cent than by the current recommendation.

The price is also the person

The receptor construction costs seventy per cent above the unconstrained floor, which is a number usually quoted as a property of the construction. Propagated across a population of eyes it runs from a quarter above the floor to a hundred and thirty per cent above it, and the population's own spread is wider than the entire gap between the published transforms the seventy per cent was being compared against.

limits · Limits
How far a fitted transform is from anybody's eyes. Five groups of three bars: for each published adaptation transform, the distance from the population's own cloud to the confusion point that transform is committed to, measured in the population's standard deviations on that point. On the protanope's point every one of them is between 2.2 and 14.4 out, and on the deuteranope's between 3.7 and 11.8. On the tritanope's, 5 of the five are within three standard deviations — indistinguishable from a member of the population. The claim that these matrices are not cone responses is safe, and the evidence for it is two points out of three.

Two points out of three

Every published adaptation transform implies three dichromat confusion points, whether or not it was fitted to any. Measured in the population's own standard deviations they are two to fourteen out on the protanope's point and four to twelve on the deuteranope's — and between half a standard deviation and two and a half on the tritanope's, which is inside the population. The claim that these matrices are not cone responses is safe. The evidence for it is two points.

matching · Gamut
A population of receptor bases, in the plane the published ones live in. The two axes this collection scores an adaptation basis on — the residual across the illumination census on the horizontal, ellipse anisotropy on the vertical, lower better on both — with 200 extra points on it. Each is the basis a member of the population's own confusion points determine. The cloud is not a point: it runs from 1.22 to 2.24 ΔE00 horizontally, which is wider than the whole spread of the published transforms marked on it. The observer this site quotes sits inside the cloud and near one edge of it, and the sentence "the receptor basis costs seventy per cent" is a sentence about that one point rather than about the construction.

A trade between matrices, not people

Across the space of possible bases, adapting well and discriminating well pull in opposite directions — the two optima sit at the ends of an empty diagonal. Across a population of actual observers the same two costs move weakly together, at a correlation of +0.29. The trade-off is a property of the set of matrices somebody could choose, not of the eyes anybody has. One measurement inside the population does trade, and it is the macular pigment.

brain · Appearance
Every width at the wide end of its span, and at the narrow end. One line per published quantity, each spanning the value it takes when all four declared widths are read at the narrow end of their reported ranges to the value at the wide end, with a marker at the value as declared. The largest span is the deutan margin at a factor of 2.62; the smallest is 1.22. This is the reading the population model's own documentation promised for four phases and nothing ever took. It is not a confidence interval — the four ends are not quantiles and the widths are not independent draws — it is what a reader who distrusts all four at once sees.

A width nobody varied

Five numbers say how much people differ from one another, and every conclusion drawn here about a population rests on them. Each was written down with the range the literature reports beside it, so that a result could be re-read at the pessimistic end. Nothing ever was.

eye · Cones
Which fourth dimensions are expensive, and how fine is too fine to matter. Two curves on axes of how many half-cycles a cosine fourth basis function makes across the visible band, against what it costs the matrix theorem in ΔE₀₀, at a fixed ten per cent amplitude. Both curves touch zero at exactly one and two half-cycles: those are the family's own second and third basis functions, so a fourth coefficient along them adds no dimension and a change of light stays exactly a matrix. Between them the cost climbs, reaches a maximum, and — for the smooth source — falls away again, because structure finer than the scale on which three broad cone sensitivities differ integrates to nearly nothing. The two curves part company at the fine end. Under daylight-to-tungsten the cost has fallen by a factor of 2.2 from its peak; under daylight-to-a-triphosphor-tube it has barely fallen at all, because a source with three narrow emission lines has structure of its own at that scale for the surface's structure to beat against. The observer is identical in both curves.

A fourth dimension has a shape

How much a fourth reflectance dimension costs spans a factor of nine across four equally plausible shapes at one amplitude, and the expensive ones are not the shapes a variance figure would identify. The band that hurts is set by the illuminant rather than by the eye, which is why a triphosphor tube and a tungsten lamp disagree about it.

light · Light
A confusion point is about the pigments that remain. Three groups of three bars. Each group is one dichromat's confusion point; each bar is how far that point moves in chromaticity when one of the three cone pigments has its absorption peak shifted by eight nanometres. In every group the bar for the pigment that dichromat is missing has length zero — exactly zero, to machine precision, not merely small. The protanope's point does not move when the L pigment moves, the deuteranope's does not move when the M pigment moves, and the tritanope's does not move when the S pigment moves. The reason is algebraic rather than physiological: a confusion point is the direction that excites only the missing cone, which is the null space of the other two receptors' rows, and rescaling a row does not move where the other two are zero. So the point at which a protanope's confusion lines meet is not a fact about the pigment a protanope lacks, which is why the claim about it restates in nanometres of the M pigment.

A point about the pigments that remain

The chromaticity at which a protanope's confusion lines meet does not move at all when the long-wave pigment moves — not slightly, exactly not at all. It moves a great deal when the medium-wave pigment does. A dichromat's confusion point is a fact about the two receptors they have rather than about the one they lack.

eye · Cones
The same claim in nanometres of pigment, where no declared width can reach it. Five horizontal bars on a scale of nanometres, one per published chromatic-adaptation transform, each showing how far the medium-wave cone pigment's absorption peak would have to move for the receptors' own protan confusion point to land where that transform puts it. Zero is the measured peak. The bars run from -10.5 to 18.2 nanometres — in both directions, so two of the transforms want the pigment shorter and two want it longer. Drawn across them is the 25 nm separation between the L and M pigment peaks, which is the whole basis of red-green vision and is not a number this collection declared. The nearest transform asks for a displacement of 30 per cent of that separation, and the span across the table is 28.7 nanometres — larger than the separation itself. No population, cloud or standard deviation appears anywhere in the statement.

The claim, in nanometres

For four rounds the claim here has been that every published adaptation transform puts the protanope's confusion point outside any real population of eyes, stated in standard deviations of a population whose widths were declared rather than measured. Restated as a pigment displacement it needs no population at all — and the nearest transform asks the medium-wave cone to move thirty per cent of the way to the long-wave one.

eye · Cones
The same claim in nanometres of pigment, where no declared width can reach it. Five horizontal bars on a scale of nanometres, one per published chromatic-adaptation transform, each showing how far the medium-wave cone pigment's absorption peak would have to move for the receptors' own protan confusion point to land where that transform puts it. Zero is the measured peak. The bars run from -10.5 to 18.2 nanometres — in both directions, so two of the transforms want the pigment shorter and two want it longer. Drawn across them is the 25 nm separation between the L and M pigment peaks, which is the whole basis of red-green vision and is not a number this collection declared. The nearest transform asks for a displacement of 30 per cent of that separation, and the span across the table is 28.7 nanometres — larger than the separation itself. No population, cloud or standard deviation appears anywhere in the statement.

Five transforms and the space between them

Every appearance prediction here chooses one of five published adaptation transforms, and the five disagree about where a protanope's confusion lines meet by more than the distance between the two pigments the disagreement is about. That spread is itself a scale, and using it needs no population model at all.

brain · Appearance
How far this site's median observer sits from the 1931 standard, by template. Twenty-four natural reflectances under D65, each given a tristimulus value twice: once by the 1931 colour-matching functions and once by this site's median member, with each judged against its own white. The bar is the mean difference, which is the residual this collection bounds and calls inescapable. It is inescapable, and it is smallest for the simpler template: Lamb's 1995 nomogram gives 0.9006 against Govardovskii's 0.9522, and removing Govardovskii's secondary band brings it down again to 0.9354. Neither is an argument for changing template — a nomogram is fitted to measurements of individual receptors, not to colour matches, so agreement with the standard observer is not what either was trying to achieve. What it says is that the residual is a mismatch between two kinds of observer rather than a shortfall a better pigment model would close. The number after each bar is the template's tail ratio: how far the L cone's half-maximum reaches below its peak against how far it reaches above.

The population rests on a template

Two hundred observers here are built from one formula fitted to microspectrophotometry in 2000. The obvious alternative — the tabulated cone fundamentals — is not available, and the reason is the finding. A tabulated fundamental has no peak wavelength to move, so the moment it is used the population collapses to a single observer.

eye · Cones
A template's asymmetry against what its observer costs. The horizontal axis is the tail ratio of the L cone's pigment absorbance — how far the curve reaches below its peak at half maximum against how far it reaches above — and the vertical is how far the observer built from that template sits from the 1931 standard. A real visual pigment has a long short-wavelength tail, so the three curves derived from a published nomogram sit above 1.1 and the two Gaussians sit below. The four are matched in width, so nothing here is about size. The ordering is the point: the two caricatures cost between two and four times what either nomogram does, and the axis they are separated on is the one feature the caricatures do not have.

A template is mostly its tail

Four pigment templates matched to the same width at the same peak, differing only in which side of the peak their half-maximum reaches further. Ordered by that one number, the observers they build are ordered by how far they sit from the standard one — and the two with the tail on the wrong side cost two and four times what either real nomogram costs.

eye · Cones
The arguments a standard observer does not have. Seven choices inside a set of colour-matching functions, each with the shape it takes and what it is worth in ΔE₀₀ on a red pigment under a 6500 K radiator. Six are measurements: a field size, an age, a macular density, a cone optical density, three peak wavelengths and a rod contribution. The seventh is not — a change of basis is a change of curves and not a change of observer, and its entry is exactly zero because the space an experiment measures is what an observer is. Printing that zero beside the others is the clearest statement of what the other six are measurements of.

The third factor is a construction

Every figure in this collection names its observer, which was the whole point. None of them says what an observer is made of. Three curves are not a measurement of the eye; they are a projection of one, with a field size, an age, a macular density, three peak wavelengths and a luminance constraint inside them.

eye · Cones
The three cone absorptances at two settings of the cone optical density. Solid and dashed are the same construction at the two ends of two standard deviations of the reported spread. The curves are built from one pigment template through its ocular media, which is the same model its population of two hundred eyes is drawn from. The largest difference between the two sets is 18.8 per cent of the peak, and where it sits along the wavelength axis is what decides which stimuli the two observers disagree about — a departure concentrated in the blue is invisible on a sample with no blue in it.

A gain is not an observer

Multiply one eye's three cone sensitivities by 1.6, 0.7 and 2.4 and it is not a different eye. The white-point division is that multiplication's inverse, so the two agree exactly — and most of what a cone optical density change does is that multiplication, which is why the largest number in the table of individual variation is the one that matters least.

eye · Cones
The arguments a standard observer does not have. Seven choices inside a set of colour-matching functions, each with the shape it takes and what it is worth in ΔE₀₀ on a red pigment under a 6500 K radiator. Six are measurements: a field size, an age, a macular density, a cone optical density, three peak wavelengths and a rod contribution. The seventh is not — a change of basis is a change of curves and not a change of observer, and its entry is exactly zero because the space an experiment measures is what an observer is. Printing that zero beside the others is the clearest statement of what the other six are measurements of.

Three curves for one space

Rotate a set of colour-matching functions by an arbitrary invertible matrix, undo the rotation at the end, and the computed colour is identical to eight parts in a thousand million million. An observer is a three-dimensional subspace, not a set of curves, and the literature keeps reopening a question that is a theorem.

eye · Cones
What choosing a space to divide the white out in is worth. Three pairs of routes to the same colour, over forty-two surfaces: dividing the white out in tristimulus values, in a published cone space, and in the observer's own cones. The first two agree to 0.59 ΔE₀₀ at the median. Either of them differs from the observer's own cones by more than fifteen. That is why the two exact conditions in this round are exact only in the eye's own coordinates: the identity belongs to the receptors, and every published arithmetic works in a basis somebody else chose.

The identity is in the eye's own coordinates

Two conditions in this round are exact — a gain on each cone is not a different observer, and three curves for one space are one observer. Imposed in a published cone space rather than the eye's own they leave 13.0 and 8.11 ΔE₀₀ standing. The identities belong to the physiology and every arithmetic in use works somewhere else.

eye · Cones
The three cone absorptances at two settings of the field size. Solid and dashed are the same construction at the two ends of the CIE's own second observer. The curves are built from one pigment template through its ocular media, which is the same model its population of two hundred eyes is drawn from. The largest difference between the two sets is 16.0 per cent of the peak, and where it sits along the wavelength axis is what decides which stimuli the two observers disagree about — a departure concentrated in the blue is invisible on a sample with no blue in it.

A field size is two changes

The CIE publishes two standard observers and the difference between them is usually described as a field size. What actually differs is a macular pigment the light no longer passes through and a cone outer segment the light no longer travels the length of — two changes, in two places, with different signs and different sample dependence.

eye · Cones
What choosing a space to divide the white out in is worth. Three pairs of routes to the same colour, over forty-two surfaces: dividing the white out in tristimulus values, in a published cone space, and in the observer's own cones. The first two agree to 0.59 ΔE₀₀ at the median. Either of them differs from the observer's own cones by more than fifteen. That is why the two exact conditions in this round are exact only in the eye's own coordinates: the identity belongs to the receptors, and every published arithmetic works in a basis somebody else chose.

The appearance model takes XYZ

CIECAM16 predicts how a colour looks, and its input is three tristimulus values computed through a standard observer. Everything this round measures happens before the model is called, so an appearance prediction inherits six observer departures and a choice of cone space before it begins.

brain · Appearance
What the rods cost a match, by where their signal enters and under which lamp. For five lights, the median colour difference over forty-two surfaces between the reference observer and the same observer with a rod signal a tenth of each cone's peak added — into all three cone channels, into the long- and middle-wavelength channels only, or into the short-wavelength channel only. Under daylight the first two are 1.03 and 0.90: whether the rods reach the S pathway hardly matters. Under a phosphor white LED they are 1.24 and 0.45, a factor of 2.75, and the S-only route alone costs 0.96.

The rods' route is priced by the lamp

A rod signal in a dim room disturbs a colour match, and how much depends on which of the cone pathways it reaches — a weight the physiology leaves uncertain, especially for the blue–yellow pathway. Under daylight the uncertainty is nearly free: a rod signal that skips the S pathway costs 0.90 at the median surface against 1.03 for one that enters all three. Under a phosphor white LED it is worth a factor of 2.75, 0.45 against 1.24. What decides it is one number per lamp: how large the rod signal is compared with each cone class's own catch of the light.

eye · Cones
Which two lamps to stand a mesopic match between. Every pair of the five lights, by how far a match made under one and set under the other moves as the rod signal's weight into the S channel goes from nothing to equal — the median over forty-two surfaces, which is the signal an experiment has to resolve. The best pair is daylight against phosphor LED at 0.58 ΔE₀₀; the worst is tungsten against fluorescent tube at 0.09, a factor of 6. The count at the right is how many settings it takes to resolve the weight to a tenth at half a colour difference of scatter per setting.

The reference lamp must not move

To measure an uncertain weight, use the condition in which the answer depends on it most. That is right about half of an asymmetric colour match and exactly wrong about the other half: a match measures a difference of two displacements, and a reference field that also moves with the weight cancels the signal the test field carries. Daylight is the least sensitive of five lamps and belongs in every one of the three best pairs — 75 settings against a phosphor LED, 2,804 against the pair of lamps the principle as stated would have chosen.

eye · Cones
Two ways to ask how much rod signal an older eye has. The rod signal's catch of each lamp divided by the S cones' own catch, against the observer's age, for five lamps — drawn twice. The upper curves take the rod signal at a fixed absolute size, and every one of them roughly doubles from twenty to seventy-five: an older lens cuts the blue before the S cones see it and the rods, peaking further into the green, lose much less. The lower curves take the rod signal at a tenth of each cone's own peak absorptance, which is the model's own definition, and they barely move at all. Nothing about the retina differs between the two; only the normalisation does.

A rod signal has no natural size

An older lens absorbs where the S cones are sensitive, so it should make the uncertain rod-to-S-cone weight cheaper. Measured, the rod signal's catch of a phosphor LED as a share of the S cones' own catch more than doubles from twenty to seventy-five — and the share the model actually uses falls by a fifth. The two differ by the S cone's peak absorptance, which the lens takes 60 per cent of, and which entered the model as a normalisation rather than as a claim.

eye · Cones
How far a mesopic match moves as the S weight opens: two rooms against one field. For every pair of the five lamps, the median over forty-two surfaces of how far a match moves as the rod signal's weight into the S channel goes from nothing to equal: pale for the two-room match, each half adapted to its own lamp; dark for a bipartite field whose two halves share one adaptation. The field's signal is larger for every pair, by ×1.5 to ×7.7.

One field keeps what two rooms divide out

An asymmetric match can measure how strongly the rods feed the blue-yellow pathway, but set with the observer adapted to each lamp in turn it needs seventy-five settings on the best pair of lamps and hours of waiting between them. Putting the two lamps on the two halves of one field was proposed as the quick version, at the cost of a weaker signal. The signal is not weaker. Under one shared adaptation it is three times stronger for daylight against a white LED, and the best pair needs six settings. The adaptation that makes the slow version slow is also what was dividing the rods' contribution out of each half.

eye · Cones

Named alongside it

The objects these essays reach for when they reach for this one.

Standard observerChromatic adaptationBasisIndividual variationColour-matching functionsThe von Kries transformMacular pigmentObserver metamerismCAT16IdentifiabilityAssertionConfusion point

All concepts