Colour stops at the edge of sight
Assumes Three numbers and The mosaic is not the observer.
Every observer on this site is a point. A reflectance is multiplied by an illuminant, integrated against three functions, and out come three numbers — and three numbers carry no position. The same patch, judged at the centre of gaze or fifteen degrees out to the side, produces the same colorimetry, and the entire apparatus has one place to put a position: the standard observer’s field size, which is a disc, either two degrees across or ten.
This essay is about what is inside those discs, and the first fact is that the middle of the smaller one is colour-blind.
The claim
The retina is not uniform, the three channels degrade at three different rates, and the exception is at the fixation point rather than away from it.
Four measurements, and the third is the one nobody expects:
- Density falls twenty-one-fold between the fovea and ten degrees out, from 199,000 cones per square millimetre to 9,500.
- The three channels have three E2s — the eccentricity at which a threshold doubles. Red–green degrades fastest at 1.2°, luminance at 2.5°, blue–yellow slowest at 4.0°. So a colour difference presented off-axis has its parts divided by different amounts, and what is left is not the same colour difference smaller. It has turned by 24 degrees of hue at ten degrees out, with 33 per cent of its size left.
- The centre of gaze has no short-wavelength cones. A disc about 0.35° in radius, at the exact point a reader is looking, contains none at all. A colour difference carried only by the short-wavelength cones, on a target small enough to fall inside it, collapses to zero — asserted rather than described, because the confusion pair is constructed in cone space and the projection is exact.
- And the two standard observers are two different retinas. 12.3 per cent of the 2° field’s area is inside the short-wavelength hole against 0.5 per cent of the 10° field’s; 2.1 per cent of the 2° observer’s cones are short-wavelength against 6.3 per cent of the 10° observer’s. That is a factor of three, in the receptor class the two observers are known to disagree about most.
The hole in the middle
Everything downstream of the last point is worth stating slowly, because it is the least believable and the best measured.
Short-wavelength cones are absent from the very centre of the fovea. The radius of the free zone is reported between 0.15° and 0.5°; the model here uses 0.35° and every quantity below scales with it. Outside it the share rises to about seven per cent of all cones by a degree out and stays there.
A target 0.4° across, centred on fixation, therefore falls entirely inside the hole. An observer looking straight at it has two cone classes rather than three, which is dichromacy — specifically the kind called tritanopia, and specifically for that target only, because a tenth of a degree away the third class is back.

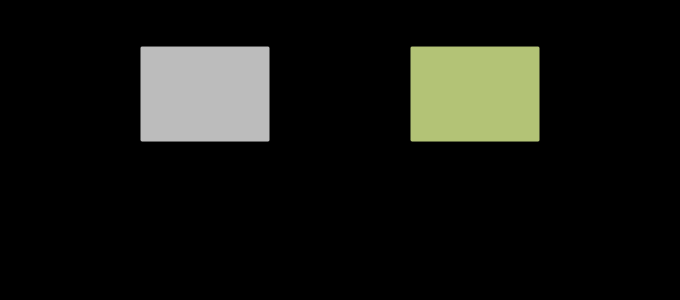
The construction matters, and the first version of it was wrong in an instructive way. A pair built in CIELAB by moving b* is not a short-wavelength confusion pair: b* mixes all three cone responses, so a pair separated along it still differs for a tritanope and the measurement came back reporting that the difference survived — a confident wrong answer from a plausible construction. The pair used here is built where the receptor class lives: one colour, and the same colour with its short-wavelength excitation scaled and nothing else touched. Under the tritanope projection the two land on the same point, to the last bit.
What a standard observer’s disc contains
Both standard observers are discs and neither is uniform. Computing what is inside each of them explains something the site had recorded as a fact and not as a consequence.
| 2° observer | 10° observer | |
|---|---|---|
| share of area with no short-wavelength cones | 12.3% | 0.5% |
| share of its cones that are short-wavelength | 2.1% | 6.3% |
| mean density, cones per square degree | 7,847 | 2,388 |
| centre-to-edge density ratio | 3.3× | 12.4× |
| share of area inside the rod-free zone | 36% | 1.4% |
The 2° observer averages over a region that is one-eighth short-wavelength-blind and is almost rod-free. The 10° observer averages over a region with twelve times more cones in it, of which six per cent are short-wavelength, and which is essentially all rod-bearing.
So the two sets of colour-matching functions are not the same functions at two sizes. They are measurements of two different receptor populations, and the direction of the difference is predicted: the 10° observer should have proportionally more short-wavelength response and be more affected by rods, both of which are what the published functions show. The essay that measured what the two observers disagree about found the largest discrepancies in exactly the blue, and treated that as a fact about the tables. It is a fact about an area.
The other half: a difference has a radius
Away from the centre, the three channels’ thresholds rise linearly with eccentricity — the E2 rule, in which a threshold doubles at its own E2 and triples at twice it. Three channels, three E2s, and the ordering is what produces the finding.
| eccentricity | ΔE00 left | share | hue turned by |
|---|---|---|---|
| 0° | 21.97 | 100% | — |
| 2° | 14.96 | 68% | 15.6° |
| 5° | 10.53 | 48% | 21.5° |
| 10° | 7.15 | 33% | 24.4° |
| 20° | 4.38 | 20% | 26.2° |
The colours never change. What changes is where they are.
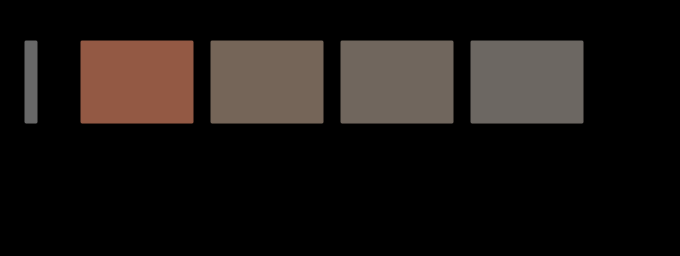
The turn is the part with no precedent in anything this site had. A colour difference is a vector in a three-dimensional space, its parts are divided by different amounts, and the result points somewhere else. At ten degrees out a difference that was a reddish-yellow departure has become a yellower one, by twenty-four degrees of hue angle, because its red–green part has been divided by 9.3 and its blue–yellow part by 3.5.

The turn has a ceiling
Read down the last column and it is plainly slowing: 15.6, 21.5, 24.4, 26.2. That is not the sampling thinning out — the turn is bounded, and the bound is worth having because it says how large this effect can ever be rather than how large it is at four chosen places.
The E2 rule multiplies each channel’s threshold by , so the shear between two channels is the ratio of two such multipliers, and as the eccentricity grows the ones stop mattering:
So the red–green part is divided by at most three and a third more than the blue–yellow part, however far out the target is put. For the pair in the table — a difference at 45° of hue angle — that caps the turn at 28.3°, and twenty degrees of eccentricity has already spent 93 per cent of it.
| eccentricity | shear ratio | turn |
|---|---|---|
| 2° | 1.78 | 15.6° |
| 10° | 2.67 | 24.4° |
| 20° | 2.94 | 26.2° |
| 40° | 3.12 | 27.2° |
| the limit | 3.33 | 28.3° |
And the ceiling over every possible difference is 32.6°. A shear of takes a hue to , which is turned most when — at 28.7° of hue angle, where the turn reaches 32.58°. That is the largest angle any colour difference can rotate by anywhere in the visual field, under this model, and it is a closed form rather than a search.
Which differences turn, and which merely shrink, is decided by their hue. A difference lying along alone or alone does not turn at all — both of its components are divided by the same number, because there is only one — so a pure red–green mismatch stays a pure red–green mismatch and simply fades, fastest of anything here. The differences that rotate are the intermediate ones, and they rotate most at about 29° and 119° of hue angle.
It also settles what kind of failure this is. A bounded shear is a fixed linear map in the limit — the periphery does not keep distorting a difference indefinitely, it applies a distortion that converges, and past about twenty degrees out the map has stopped changing while the overall size continues to fall. So peripheral colour vision, in this model, is not progressively more alien the further out one goes. It is one particular skewed version of foveal colour vision, arrived at within the central twenty degrees and then merely dimmed.
That has a practical edge for anyone writing a tolerance. The two directions a specification is most likely to name are the two that behave most simply, because a* and b* are what a specification names; and a mismatch at an intermediate hue — which is where most real mismatches are, since a press or a paint drifts along its own axes rather than along CIELAB’s — is the case where the peripheral appearance is not a smaller version of the foveal one at all. The number the foveal instrument reports and the direction the peripheral observer perceives are then two different facts about the same pair.
The quantity a specification has no field for
A colour difference has no size was this site’s first measurement of an unstated argument in a tolerance. This is the second, and it is a distance from the point of regard.
A stated colour difference has an outer radius — the eccentricity past which it is below threshold — and there are three of them, which is a second reason a tolerance is a shape rather than a number:
| difference | red–green | luminance | blue–yellow |
|---|---|---|---|
| 4× foveal threshold | 3.6° | 7.5° | 12.0° |
Two panels on a car with a red–green mismatch four times threshold are matched to anybody not looking directly at the join, from about three and a half degrees away — which at arm’s length is about six centimetres. The same mismatch in the blue–yellow direction survives to twelve degrees. No specification in ordinary use distinguishes the two, and both are written as one number — the same omission an enclosed corner exposed from a different direction.

What was computed, and how
The densities are quoted and the interpolation is stated. Seven landmarks from the anatomical counts, interpolated logarithmically because density falls over more than an order of magnitude and a straight line between two points a decade apart passes through nothing. Past the last landmark the value is held flat rather than extrapolated, which is the honest choice for a region nothing here needs.
The short-wavelength share is a raised cosine over the transition rather than a step, because no real retina has a step there and a step would make every quantity downstream discontinuous at exactly the eccentricity the arguments are about.
The E2s are the least certain numbers in the essay. Reported values cluster around 2–3° for luminance acuity, and the ordering — red–green fastest, blue–yellow slowest — is the robust part. Every ratio in the tables moves if the E2s move; the sign of the hue turn does not, because it depends only on the ordering.
And the tritanopia is the site’s own projection, unchanged: the same construction used for colour vision deficiency, applied to a receptor population that is missing for anatomical rather than genetic reasons. That the two cases share machinery is not a coincidence — the missing cone class is missing either way — but the caution that essay states applies here too and more strongly: this is what the model says a target inside the free zone produces, not a report of what anybody sees.
Where the model stops
There is no cortical pooling. Peripheral vision does not simply have coarser receptors; the signals are pooled over larger regions and the pooling has its own structure, including crowding, which is the dominant limitation on peripheral form vision and appears nowhere here.
There is no eccentricity-dependent adaptation. The gains that produce chromatic adaptation are computed once per observer in this site’s machinery, and a real retina adapts locally.
The rods are named and not modelled. The rod-free zone is quoted, the share of each observer’s field inside it is computed, and what the rods do to a peripheral colour judgement is a separate machinery that has not been joined to this one.
The ceiling inherits the E2s and nothing else. The 3.33 above is a ratio of two quoted numbers, so it moves with them directly: E2s of 1.5 and 3.5 would put it at 2.33 and cap the turn at 21° instead of 28°. What does not move is that a ceiling exists and that it is reached by about twenty degrees out, because both follow from the form of the E2 rule rather than from its constants.
And a difference is scaled per channel in CIELAB, which is a modelling choice with a visible seam: CIELAB’s a* and b* are not the cardinal chromatic directions, so dividing them separately is an approximation to dividing the cardinal channels separately. The turn is real; its exact size inherits that approximation.

The generalisation
The sentence worth carrying: the standard observer is an average over an area, and the area is not uniform.
That is not a criticism of the standard. Averaging is exactly the right thing to do for the job the standard has, which is to say whether two large patches match for somebody looking at them. What it means is that the field size is not a detail of the measuring apparatus — it is a statement about which retina was sampled, and the two standards sample two.
The surprising connection is with the cone mosaic. That essay’s finding was that the ratio of long- to medium-wavelength cones varies sixteen-fold between people and matching survives it, because a matching function is an integral over a population and the integral does not care about the mixture. This one is the same argument in the other direction: the mixture varies within one person, systematically, by position — and matching survives that too, for exactly the same reason, right up until the population is a population of two classes rather than three.
Who found it, and when
The cone counts are Curcio and colleagues’, 1990, on human retinas — the measurement almost every number in the first half of this essay stands on, and one of the more heroic pieces of counting in the subject.
Small-field tritanopia is much older: König reported in the 1890s that very small blue–yellow targets are confused, and the anatomical explanation — no short-wavelength cones in the central fovea — was confirmed by staining and later by adaptive-optics imaging in living eyes.
The E2 formulation comes from the cortical-magnification literature of the 1980s, where it was introduced to make peripheral and foveal performance comparable by scaling the stimulus. Its use here is the reverse: holding the stimulus fixed and asking what happens.
What has not changed is practice. No colour tolerance in industrial use has a field for how far from the point of regard the sample is, and the answer differs by more than a factor of three between the two chromatic directions.

What the pictures cannot show
They cannot put anything in the periphery. A figure appears wherever the reader looks, and a reader looks at the figure. Every claim here about ten degrees out is a claim about a stimulus this page cannot deliver, and the swatches labelled 10° are predictions drawn at 0°.
And the one about the fovea is worse. The small-field tritanopia figure draws two patches that are, on the page, plainly different colours; the claim is that at a stated angular size, centred on fixation, they would not be. A reader can approximate the experiment by moving far enough away that each patch subtends a third of a degree — at which point the patches are also too small to judge, which is the difficulty the original experiments spent a century on.
Where the ladder goes next
The nearest unfinished piece is the join to the rods. The 2° observer’s field is 36 per cent rod-free and the 10° observer’s is 1.4 per cent, which says the two standards were measured on visual systems with different amounts of rod intrusion in them — and the site has the rod sensitivity function and the mesopic weighting already. That is a computation, not a research programme.
The second is crowding, which is the real limit on peripheral vision and is a spatial phenomenon rather than a chromatic one. It would need the plane machinery the previous essay built and a pooling region, and it would say something the E2 rule cannot: that a peripheral patch beside another patch is worse than one alone.
Where this goes next
 The mosaic is not the observer
The ratio of long-wavelength to medium-wavelength cones varies between ordinary people by a factor of sixteen. Those people make the same colour matches, to twelve decimal places, and that single fact is the reason a standard observer can exist at all.
The mosaic is not the observer
The ratio of long-wavelength to medium-wavelength cones varies between ordinary people by a factor of sixteen. Those people make the same colour matches, to twelve decimal places, and that single fact is the reason a standard observer can exist at all.
 Two degrees or ten
This site names the observer on every figure it draws, which was supposed to be the point. Measuring what it had actually done found two hundred and four figures naming the same observer, three naming the other, and sixty-two of sixty-four generators printing a string that had never once varied.
Two degrees or ten
This site names the observer on every figure it draws, which was supposed to be the point. Measuring what it had actually done found two hundred and four figures naming the same observer, three naming the other, and sixty-two of sixty-four generators printing a string that had never once varied.
 A difference has no size
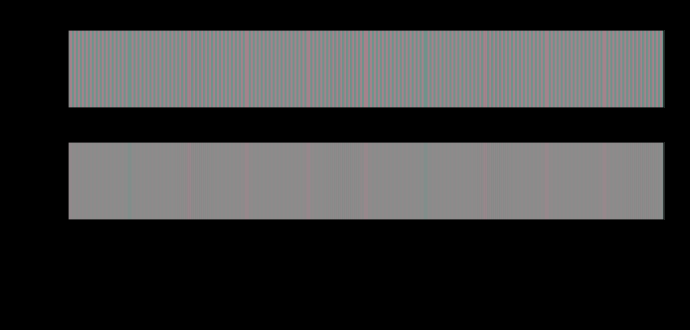
A colour difference formula answers a question about two large patches seen side by side. Applied to a pattern, it reports fourteen units where the eye is left with less than one — and the ratio depends on nothing but how finely the difference is spread.
A difference has no size
A colour difference formula answers a question about two large patches seen side by side. Applied to a pattern, it reports fourteen units where the eye is left with less than one — and the ratio depends on nothing but how finely the difference is spread.
What this makes readable
Essays that name this one as a prerequisite.
Named alongside this one
Essays reaching for the same objects. Nobody chose these; they are what the index of named objects makes visible.
- One match names the observer colour vision deficiency · cone fundamentals · individual variation · standard observer · trichromacy
- The drift is a luminance mechanism eccentricity · individual variation · opponent processing · spatial frequency · threshold
- The eye is never still eccentricity · opponent processing · spatial frequency · threshold · viewing condition
- What a still eye stops seeing eccentricity · individual variation · opponent processing · spatial frequency · threshold
- A field size is two changes cone fundamentals · eccentricity · individual variation · standard observer
- A halftone is a luminance object eccentricity · opponent processing · spatial frequency · threshold
What links here
The 8 essays that link to this one and share the most of its objects, of 11 that link here.
The objects this essay names
Each one links to every other essay that touches it.
Colour vision deficiencyCone fundamentalsΔEEccentricityIndividual variationOpponent processingSpatial frequencyStandard observerThresholdToleranceTrichromacyViewing condition