Concept

Threshold — where it appears

The smallest difference that can be detected, which depends on the light level, the size of the samples and how they are arranged. It is measured with gratings rather than patches, because a threshold for an edge and a threshold for a field are different quantities.

Named by 28 essays across 6 fields — each of them below, with the objects they name alongside it.

Three colour-difference formulae, disagreeing. ΔE76, ΔE94 and ΔE2000 for the same 9 pairs of colours. The largest disagreement between ΔE76 and ΔE2000 here is 26.6 units — larger than the threshold usually quoted for a just-noticeable difference, so the choice of formula can decide whether two colours count as matching.

How far apart are two colours

ΔE is meant to be a distance with the property that the same number means the same perceived difference everywhere. Three successive formulae have tried, they disagree with each other by more than a just-noticeable difference, and the disagreement decides real matching questions.

difference · Metric
MacAdam's discrimination ellipses, drawn 10 times actual size. Twenty-five ellipses of colours indistinguishable from their centres. They are drawn at 10× because at true scale most are thinner than a line. Their areas vary by a factor of 74, which is the whole result: a step of the same size in xy means very different things in different places.

MacAdam measured it

In a perceptually uniform space the just-noticeable-difference contours would be circles of equal size. MacAdam's ellipses are neither, by a factor of eighty — and transforming them into each candidate space settles which spaces improved matters and by how much.

difference · Metric
Threshold and suprathreshold contours, normalised to the same size. At five of MacAdam's centres: the measured just-noticeable-difference ellipse in grey and the ΔE2000 = 1 contour in gold, each scaled to the same mean radius so that only shape and orientation are being compared. A scale change preserves orientation exactly, so any rotation between the pair settles the question. They differ by 24° on average and by 70° at worst, and the ratio between their sizes varies 4.8-fold across the diagram — so no single factor turns one into the other.

A threshold is not a unit

MacAdam measured the smallest difference anyone could detect. ΔE2000 was fitted to how far apart plainly different colours look. The two are quoted interchangeably, and the contours they produce are not even the same shape.

difference · Metric
A box tolerance and a ΔE tolerance around the same colour. A slice through CIELAB at L* 50, with the ΔE2000 = 1 contour traced point by point and a ±1 component box drawn over it. The contour is 2.1 times longer in one direction than the other, and the box is square. Of every sample either rule accepts, the two disagree about 74% — accepted by one specification and rejected by the other, on the same measurement.

A tolerance is a shape

A total colour difference below one, or every component within one — the two sound like the same requirement stated twice. They are different shapes, they disagree about most of what either accepts, and which one a supplier is held to is worth money.

difference · Metric
Three ways to spend a thousand code values. Normalised code value against luminance, for PQ, HLG and a conventional gamma curve, all covering 0.001 to 10000 cd/m². PQ spends 51% of its range below 100 cd/m² — roughly where a picture lives — and the gamma curve spends 15%, leaving the rest for highlights. A PQ code is the only one of the three that names a luminance rather than a fraction of whatever the display can manage.

How bright is white

An sRGB value says a pixel is some fraction of whatever the display can manage. A PQ value says it is two hundred candelas. The change is the largest in display encoding since gamma, and what it removed was the honest admission that nobody knew.

limits · Limits
Distinguishable colours in sRGB, counted under two difference formulae. The gamut volume divided by the volume of a ΔE = 1 ellipsoid, integrated over the solid because that ellipsoid changes size and orientation from place to place. Under the 1976 formula the answer is 195,720; under ΔE2000 it is 41,819 — 4.68 times fewer, from the same solid and the same lattice. Both assume perfect packing, which nothing achieves, so each is an upper bound rather than a count of anything. The gap between them is the result: "how many colours are there" is a question about a metric before it is a question about vision.

How many colours are there

Sixteen point seven million counts code values in a file format. Ten million distinguishable colours is a volume divided by the size of a just-noticeable difference — and the two difference formulae this site implements disagree about that size by a factor of nearly five.

difference · Metric
The ΔE = 1 contour at points across the L* = 55 plane, magnified 14×. Each closed curve is the set of colours exactly one unit of difference from the dot at its centre, traced by bisection along 30 directions and drawn 14 times life size. Under ΔE2000 the contours run from 0.68 to 5.07 CIELAB units across this slice — a ratio of 7.44 — and they are not circles and not aligned with each other. A formula whose contours were circles of one radius everywhere would be claiming that CIELAB is uniform, which is what the 1976 formula claims and what the measurements refuse.

Where the formula is not smooth

A colour difference formula is a distance, and a distance ought to vary gently. CIEDE2000's does not everywhere — it carries a hue-rotation term with a hard edge in it, and the discontinuity sits where a great many industrial samples live.

difference · Metric
Correcting colour costs noise, and the two cannot both be least. Sweeping the colour matrix from its own diagonal — a white balance with no cross terms — to the full least-squares fit. Mean ΔE00 falls from 18.61 to 1.29; photon noise rises by a factor of 1.03. At 10000 photons per pixel.

Correcting colour costs noise

The matrix that turns a sensor's raw into XYZ has large off-diagonal terms of both signs, because that is what correcting a sensor which fails Luther's condition requires. Differences of large numbers are where noise grows, and the full correction amplifies photon noise by 1.66 times.

imaging · Capture
Photons caught by one cone in one integration time, under D65. Each curve is one cone class, counting isomerisations during a 0.1 s integration through a pupil that closes as the light rises. At 1000 cd/m² a long-wavelength cone catches about 11522 and at 0.001 it catches 0.12 — which is where the square root of the count stops being a small correction and starts being the signal. The rate works out at 30 isomerisations per second per troland, inside the published band of 5–50.

Colour goes first in the dark

A cone reports a count, and a count carries the square root of itself as noise. Counting the photons says where colour vision stops — a chromatic difference runs out four hundred times sooner than a lightness difference of the same size — and says just as clearly that in daylight the eye is nowhere near that limit.

eye · Cones
A 8-bit ramp from 0.0008 to 0.006 of white, 12° wide. The top strip is the ramp as delivered: 16 distinct levels, each a step of one code value. Below it is the quantisation error as a Weber contrast against the local luminance, filtered by the luminance sensitivity function. The largest response is 8.51 per cent contrast against a threshold of 0.3, which is 28.4 times over — and it occurs at 0.09 per cent of white, at the dark end, because a code step is a Weber contrast and the same step is a larger fraction of less light.

Banding is not a bit depth

Eight bits bands at thirty times threshold in the shadows and at under three at mid grey, on the same ramp with the same encoding. What decides is where in the tone scale the gradient sits, how sharp each step's edge is, and how far away the reader is — and a bit count contains none of the three.

limits · Limits
Cone density, out from the centre of gaze. Quoted landmarks with logarithmic interpolation between them: 199,000 cones per square millimetre at the fovea, 9,500 at ten degrees — a factor of 21. The shaded bands are the two standard observers' fields. The 2° observer averages over a region whose density falls by 3.3× between its centre and its edge and the 10° observer by 12.4×, which is what "a 10° field" contains and is why the two sets of matching functions are different shapes rather than the same shape scaled.

Colour stops at the edge of sight

Cone density falls twenty-one-fold between the centre of gaze and ten degrees out, and the three channels give out at three different rates — so a colour difference in the periphery does not merely shrink, it turns. At the exact point of fixation there are no short-wavelength cones at all.

eye · Cones
How often two colour-difference formulae disagree about which pair is worse. Pairs of colours sampled in CIELAB, compared two at a time. A rank inversion is a case where one formula calls pair A worse and the other calls pair B worse; no monotone rescaling of either can remove one. The left bar of each group is the rate over the whole space and the right bar is the rate among pairs sitting near a tolerance of ΔE 1, where the decision is actually made — and it is between 35 and 44 per cent, against a coin flip at fifty.

Which of two is worse

Two colour-difference formulae disagree about which of two pairs is the larger difference in thirteen per cent of comparisons overall — and in forty-three per cent of comparisons among pairs sitting near a tolerance of one unit, which is where every acceptance decision is actually made.
difference · Metric
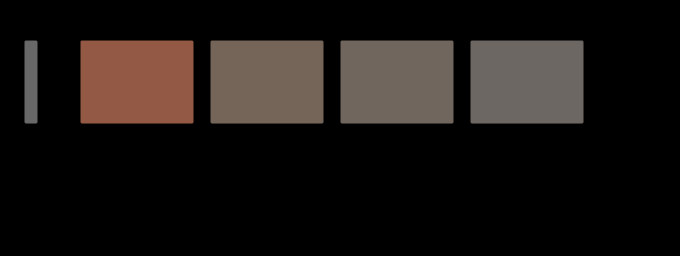
One colour difference, at four places in the visual field. The same pair of colours — ΔE00 22.0 at the fovea — with each of its three components divided by that channel's own threshold scaling at the stated eccentricity. What is left at 20° is 4.4, and its hue has turned by 26 degrees, because the red–green part is divided by more than the blue–yellow part. The swatches are the predicted colours, drawn where a reader will look straight at them; the figure states a prediction it cannot stage.

A difference has no place

A colour difference formula answers a question about two patches somebody is looking straight at. Move the same pair ten degrees into the periphery and a third of it is left — and it has turned twenty-four degrees of hue, because the three channels give out at three different rates.

difference · Metric
The eye's own drift, and what it does to every spatial frequency. A pattern of f cycles per degree, drifting across the retina at 0.5 degrees a second, arrives at each receptor at f × 0.5 hertz. The curve is the temporal sensitivity at that rate, against the pattern's spatial frequency. Every frequency the eye can resolve stays above a quarter of the temporal peak, and the band of drift speeds for which that holds is 0.02–0.71 degrees a second — with the measured drift inside it. Faster and the finest detail is carried past 60 hertz, where there is no sensitivity at all.

The eye is never still

A perfectly stabilised retinal image disappears within seconds. What keeps the world there is a drift of about half a degree a second between the microsaccades — fast enough to keep the finest detail modulating and slow enough not to carry it past fusion, in a band whose upper edge is at 0.71 degrees a second.
brain · Appearance
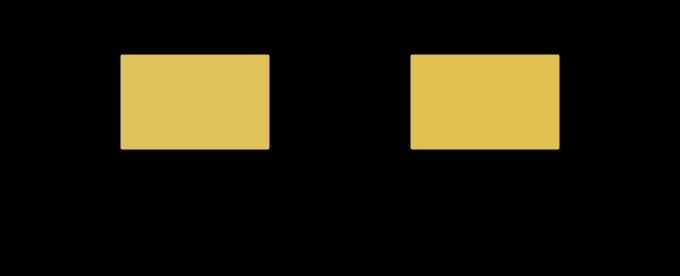
One light, two eyes. The same stimulus through two sets of ocular media differing only in macular pigment (0.35 and 0.41) and lens age (55 and 55 years). Compared under one white the two differ by ΔE00 1.00; compared with each eye adapted to its own long-run white — which is what the visual system does — by 0.00. The second number is why nobody notices, and the first is why a person who has had one lens replaced reports that the other eye has turned yellow.

Nobody here has two eyes

One person's two eyes differ in macular pigment and lens density, so the same light produces two colours — a whole ΔE00 apart for an ordinary pair, seven for one replaced lens. Adaptation hides it exactly, which is why nobody notices and why nothing in colorimetry has a term for it.

limits · Limits
What a dither mask is worth, read as components, in two dimensions. Five luminance ramps, each quantised to 8 bits with and without a high-passed mask of the same power. The bars are the most visible single sinusoidal component of the error, as a multiple of the contrast that component needs to be seen: above the line at one it is visible. The mask lowers it by 20–22×, on every ramp — which the one-dimensional model on this site says it does not, and that disagreement is the finding.

Every threshold was measured with a grating

An earlier essay here claimed that the model cannot explain why dither works, and named two missing pieces. One of them was real and worth thirteen times the guess; the other was not needed. The piece nobody named was the detector — and reading the same model two ways changes the answer by a factor of fifty.

limits · Limits
How large a step changes the name, across the ab plane at L* 60. At each point, the smallest ΔE00 step in any direction after which the probability of two people using the same word has halved. It runs from 4.8 to 33.8 units across this one plane, in eight quantised levels: the palest cells are where a name is finest — a short step changes it — and the strongest are the middles of large territories, where a colour can move twenty units and keep its word. The ragged edge is the sRGB boundary at this lightness rather than a property of the vocabulary. The boundary softness is a stated parameter of the model, and the map barely moves when it is changed fourfold, because what sets this quantity is how far apart the centroids are.

A name is not a threshold

Two colours have to move about ten times a just-noticeable difference apart before people stop calling them the same thing, and how far varies threefold across one plane of the space. A tolerance and a word are answering different questions, and nothing in colorimetry converts between them.

brain · Appearance
A halftone tint away from the centre of gaze, two ways. The upper curve raises the threshold by the E2 rule and leaves the filter alone, which is the multiplication the last phase guessed at. The lower one also moves the cutoff, because eccentricity magnifies the whole spatial scale — implemented as the substitution that makes it exact, a screen of ruling r seen through a filter whose cutoff has been divided by s being a screen of ruling r·s seen at the fovea. The horizontal line is threshold. The screen is visible where you are looking and gone by 3°, while the product prediction has it visible across the whole page.

A tint at the edge of a page

The last phase left this join open and guessed at its answer — how visible a halftone tint is away from the centre of gaze should be the product of two effects it had measured separately. It is not the product. At five degrees the guess is fifty-three times too generous, and by twenty it is out by eight orders of magnitude.

difference · Metric
The drift window, asked about each channel in turn. Every spatial frequency a channel can resolve, drifting at v degrees a second, arrives at f × v hertz; the bar is the range of v over which all of them stay above a quarter of that channel's temporal peak. The luminance band is closed at both ends — 0.018 to 0.71 degrees a second — because its temporal sensitivity has a dip at zero to fall into. The chromatic bands have no slow edge at all, because chromatic temporal sensitivity is low-pass: a stationary chromatic pattern sits at the top of its own sensitivity. The mark is the measured drift, and it is inside all three.

The drift is a luminance mechanism

The eye's own drift was shown to sit inside a band of speeds that keeps every spatial frequency modulating, and the band was quoted as though it were about vision. Asked about colour, it has no slow edge at all — a stationary chromatic pattern needs no eye movement whatever. And a stabilised chromatic pattern is the first thing to fade.

eye · Cones
Every filtered claim in these essays, read at a point and read as components. Each row is a comparison one of the essays makes. The bar is the ratio between the two readings — how many times larger the component answer is than the point answer, or the reverse — on a logarithmic scale. 5 of 7 disagree by more than half again, and 4 disagree about the direction of the effect rather than merely its size. The three marked as noisy are the ones with a noise field on one side of the comparison, and they are the three largest.

The list nobody made

The last phase found that reading a filtered signal at a point asks a question its thresholds were never fitted to, made it a standing rule, and admitted that nobody had gone back through the site to see which claims it touched. Here is the list. Every claim with noise on one side of it moves — and so do two that have no noise in them at all, which the rule said would not.

limits · Limits
Where a pooled gain gives out, against where the eye does. The falling curve is how much of a pattern of each spatial frequency a local adaptation pool of 0.5° can see — and therefore how much of it a settled eye can cancel. It is half gone by 0.37 cycles per degree, which is a feature about 2.7° across. The three marks are the acuity limits of the luminance channel and the two chromatic ones. Every one of them is more than an order of magnitude finer than the pool, which is why a stabilised eye loses the fill of a picture and keeps its outline rather than losing the picture.

What a still eye stops seeing

A stabilised image is said to vanish, and nothing in a temporal filter predicts it — sensitivity at zero frequency is a quarter of the peak, not nothing. Give the adaptation gain a size and the answer falls out — fading is a high-pass filter that switches on over a minute, it takes the fill and leaves the outline, and a patch has to be about two degrees across before it goes at all.

eye · Cones
How fine a screen each channel can see. A halftone screen at 35 per cent coverage, 45 degrees, seen by each of the eye's three spatial channels. The bar is the ruling at which it drops below that channel's own threshold. The luminance channel is still seeing it at 55 cycles per degree; the two chromatic ones have lost it by 15 and 10. The dashed line is an ordinary press ruling at reading distance, and only one channel is above it. A halftone is a luminance object, which is why the ink whose dots are nearly the lightness of the paper is the one nobody worries about.

A halftone is a luminance object

The eye's three spatial channels resolve a screen at 55, 15 and 10 cycles per degree, so at any ruling a press actually runs only one of them can see it at all. The corollary corrects a guess already published here — rotating a screen matters more to the chromatic channels, not less — but only at rulings so coarse that nobody prints there.

difference · Metric
A stabilised grating fades at a rate that depends on which way its bars run. What is left of a 0.3 cycle-per-degree grating, in multiples of its own threshold, as a function of its orientation, at four moments after the image was stabilised on the retina. The first curve is flat to floating point: at the instant the pattern arrives, orientation does not matter, because the filter that carries it has no orientation preference at this frequency. The anisotropy arrives with the fading, reaching ×2.09 after five minutes, and a pool with no axis predicts none of it.

A fading pool has a shape

Giving the local adaptation pool two axes instead of one costs a single parameter and produces a prediction the circular version cannot make — a stabilised grating fades at a rate that depends on which way its bars run. The obvious objection is the oblique effect, and the two act in bands that do not overlap.

eye · Cones
Five answers to how far the ellipses are from circles. Five mean axis ratios on the same twenty-five measured ellipses, measured the same way in every row: the boundary points carried through, the longest radius over the shortest, averaged. What differs is which class of map is allowed. The first two rows are chromaticity diagrams, which divide by a sum; CIE xy as printed leaves 2.95 and the best diagram there is leaves 2.02. The last three are lightness–chroma spaces, which divide by a white point; CIELAB as specified leaves 3.44, the best space with no compression leaves 2.33, and the best space with a cube root in it leaves 1.61. Neither family contains the other, and only the last one gets below two.

A compression goes below the floor

Elsewhere this collection minimised the anisotropy of MacAdam's ellipses over every chromaticity diagram there is, found 2.02, and called the residual a property of the eye. It is a property of the eye seen through a projective picture. A cube root after the right basis reaches 1.61 on the same twenty-five ellipses.

difference · Metric
The floor as a function of the exponent, and the fixed basis beside it. Two curves against the compression exponent on a logarithmic axis from 1 to 10. The lower curve is the best mean ellipse axis ratio any basis can reach with that exponent applied after it, and it falls from 2.33 at no compression to 1.66 at a square root and 1.61 at a cube root, then hardly moves — 1.57 at a tenth root. The upper curve is CIELAB's own basis at the same exponents and gets steadily worse, from 3.57 to 3.77. Almost everything a compression buys arrives with the first step away from linearity, and after that the exponent is choosing between 1.66 and 1.61 while the basis is choosing between 1.61 and 3.44.

The exponent was never the argument

A century of colour science has argued about whether the eye's response is a cube root, a square root or a logarithm. Minimise the anisotropy of MacAdam's ellipses over every basis, at each of eight exponents, and the floor moves by under three per cent between a cube root and a tenth root — while the basis moves it by a factor of two.

difference · Metric
A gap in the wall and a gap in the drive are not the same gap. What the centre of a region settles to under three conditions. With the contour closed it reaches its border's value exactly. Open a 16% hole in the barrier and leave the border signal unbroken and it still reaches it, to 1e-8 — a ring of driven cells encloses the centre whatever the wall outside it is doing, so nothing can escape. Break the signal too and it falls to 0.960. All of what a gap costs is the piece of border that stopped driving, and none of it is the hole.

A gap in the drive, not in the wall

Break the contour around a region and leave its border signal unbroken, and the interior does not move by one part in a million — a ring of driven cells encloses a centre whatever the wall outside it is doing. Break the signal too and the shortfall goes as the square of what is missing. All of what a gap costs is the piece of border that stopped driving.

scene · Scene
Where on the scale the units disagree. The reference pairs split into bands by how far apart they are in ΔE2000, with each unit's root-mean-square relative departure from the published one plotted per band. Every unit is calibrated once, over the whole sample, so a band is not refitted and the shape is the effect rather than an artefact of fitting. Every one of the five falls: the disagreement is proportionally largest on the pairs that are closest together, which is the opposite of what being fitted to threshold data would suggest. The appearance unit is the extreme case, at 91 per cent on the narrowest band and 17 on the widest, because CAM16-UCS raises its distance to the power 0.63 and a power below one inflates small differences against large ones. In absolute terms every curve here runs the other way — the widest band disagrees by 1.16 to 2.37 ΔE₀₀-equivalent against 0.14 to 0.68 on the narrowest — so which reading is right depends on whether the published quantity is a level or a ratio. This is the mechanism behind the census's own behaviour, where the mildest rows spread furthest across the menu.

The disagreement is at the near end

Every colour-difference formula on the menu was fitted to threshold data, so the expectation is that they agree about pairs an observer can only just tell apart and diverge on large differences. They do the opposite. Proportionally the disagreement is largest at the near end, by a factor of six for the appearance unit, and the cause is an exponent of 0.63.

difference · Metric
What is left of one colour difference when the two colours alternate. 23 pairs built at exactly ΔE₀₀ 1.000, alternated at a rate, with each part of the difference scaled by its own temporal channel and the formula then applied unchanged. At rest every pair is the flat line at one. By 7 hertz the median is 1.11 and the pairs run from 0.57 to 3.04 — a factor of 5.3 between pairs the formula calls identical. By sixty hertz the largest of them is 0.15.

A difference has no rate

A colour difference formula answers for two patches that are both there and stay. Alternate the same two colours and the difference is not scaled but taken apart: the colour half is gone by fifteen hertz and the lightness half is four times louder at eight, so twenty-three pairs the formula calls identical run over a factor of six at the rate the eye is best at, and are worth nothing at all above sixty.

difference · Metric

Named alongside it

The objects these essays reach for when they reach for this one.

ΔEJust-noticeable differenceToleranceSpatial frequencyCIELABContrast sensitivityEccentricityCIEDE2000MacAdam's ellipsesSpecificationOpponent processingPerceptual uniformity

All concepts