Concept

Spatial frequency — where it appears

How finely a pattern alternates, measured in cycles per degree, and the axis along which the eye's acuity is stated. It depends on the viewing distance as much as on the pattern, so a claim about a display is a claim about where the reader is sitting.

Named by 26 essays across 8 fields — each of them below, with the objects they name alongside it.

A grey edge, reconstructed from a Bayer row, arrives coloured. Above: an achromatic step through 24 sensor sites, with green sampled on the even ones and red on the odd. Interpolating each channel separately reconstructs them from data taken on either side of the edge, so their ratio moves. Below: the resulting chroma, peaking at 144 per cent of the local mean, and 112 per cent once colour differences are interpolated instead.

A grey edge arrives coloured

A sensor site measures one channel and the other two are interpolated from neighbours that sat somewhere else. Across a black-and-white step that reconstruction gives an achromatic scene a chroma of 144 per cent of its own local mean, and nothing in the scene or the sensor was coloured.
imaging · Capture
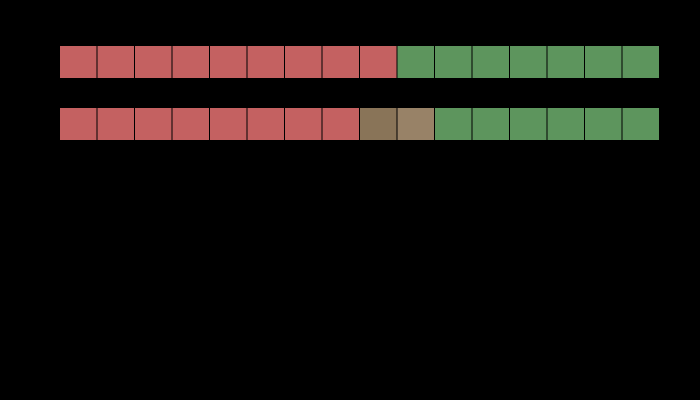
An edge at 4:2:2, and the colour it arrives as. Above, the row as it was sent and as it arrives after the two chroma planes are averaged 2 samples at a time. Below, the colour difference at each sample. The worst is ΔE00 = 25.88, at a luma step of 0.058 across the edge — an edge of nearly equal luminance. Nothing is wrong with the codec: it discards the differences the eye resolves worst, and this edge is made of nothing else.

Colour thrown away on purpose

Every video format in use discards three quarters of its colour information and keeps all of its luminance, because the eye resolves fine colour detail badly. On an edge that carries luminance the loss is exactly zero. On an edge of nearly equal luminance it is a colour difference of forty-three, and the two edges are the same edge to the codec.

applied · Delivery
Contrast sensitivity, three channels, normalised to each channel's peak. Spatial frequency in cycles per degree against relative sensitivity. The luminance channel runs to 50 cycles per degree, red–green to 12 and blue–yellow to 8, each by the same criterion of 5 per cent of that channel's own peak. Only the luminance channel dips at low frequency; the two chromatic ones are low-pass, so a chromatic edge of any size at all is seen at its full contrast.

How fine a colour edge can be

The eye resolves a lightness pattern to about fifty cycles per degree and a red–green one to twelve. Every colour difference here is quoted as though a patch had no size, and the same difference is plainly visible at one scale and gone at another.
eye · Cones
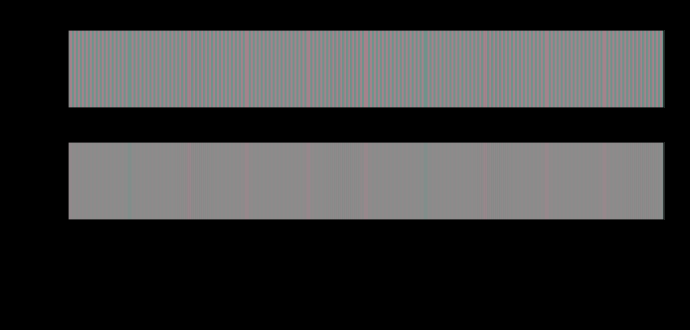
A chromatic line screen at 10.0 cycles per degree. The upper strip is the pattern as delivered and the lower one is the same pattern after each opponent channel has been low-passed at its own cutoff. Against a flat field of the same mean, the delivered pattern differs by up to ΔE00 14.22 and the filtered one by 7.77 — a ratio of 1.8. Every number quoted elsewhere for a difference of this kind is the first one.

A difference has no size

A colour difference formula answers a question about two large patches seen side by side. Applied to a pattern, it reports fourteen units where the eye is left with less than one — and the ratio depends on nothing but how finely the difference is spread.

difference · Metric
A 8-bit ramp from 0.0008 to 0.006 of white, 12° wide. The top strip is the ramp as delivered: 16 distinct levels, each a step of one code value. Below it is the quantisation error as a Weber contrast against the local luminance, filtered by the luminance sensitivity function. The largest response is 8.51 per cent contrast against a threshold of 0.3, which is 28.4 times over — and it occurs at 0.09 per cent of white, at the dark end, because a code step is a Weber contrast and the same step is a larger fraction of less light.

Banding is not a bit depth

Eight bits bands at thirty times threshold in the shadows and at under three at mid grey, on the same ramp with the same encoding. What decides is where in the tone scale the gradient sits, how sharp each step's edge is, and how far away the reader is — and a bit count contains none of the three.
limits · Limits
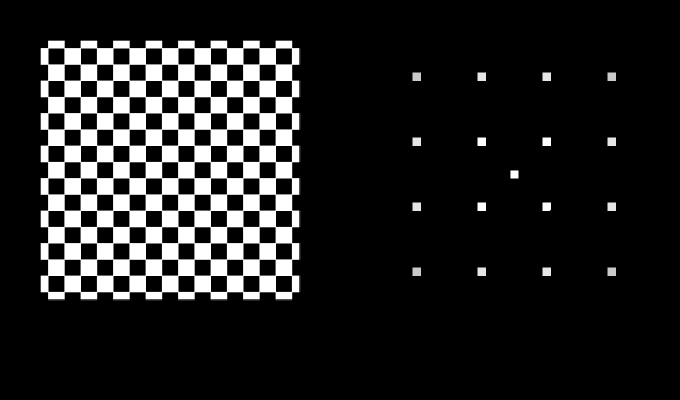
A screen at 45°, 8 c/°, and where its energy sits. Left, the pattern. Right, its power in the frequency plane with the zero frequency at the centre and the edges at the sampling limit of 23 cycles per degree, on a logarithmic scale over five decades. The closed curves are the visual system's own sensitivity at 5, 25, 60 per cent of its peak; they are not circles, because sensitivity is lower on the diagonals than on the cardinal axes by a factor of 2.0 at high frequency. Energy inside a curve is seen; energy outside it is not, whatever its size.

A pattern has a direction

Every spatial claim here is a claim about a frequency, and a frequency has no direction in it. Turning a printed screen forty-five degrees makes it exactly twice as quiet with nothing else changed — and the same rotation does nothing at all to a chromatic one.

eye · Cones
Cone density, out from the centre of gaze. Quoted landmarks with logarithmic interpolation between them: 199,000 cones per square millimetre at the fovea, 9,500 at ten degrees — a factor of 21. The shaded bands are the two standard observers' fields. The 2° observer averages over a region whose density falls by 3.3× between its centre and its edge and the 10° observer by 12.4×, which is what "a 10° field" contains and is why the two sets of matching functions are different shapes rather than the same shape scaled.

Colour stops at the edge of sight

Cone density falls twenty-one-fold between the centre of gaze and ten degrees out, and the three channels give out at three different rates — so a colour difference in the periphery does not merely shrink, it turns. At the exact point of fixation there are no short-wavelength cones at all.

eye · Cones
Temporal sensitivity, and where each channel gives out. Modulation frequency in hertz against relative sensitivity. The luminance channel is band-pass, peaking at 8 hertz and running out at 60; an isoluminant modulation is low-pass and runs out at 15, which is 4.0 times sooner. Both cutoffs are at the same criterion of 5 per cent of that channel's own peak, so the ratio between them is a ratio between two measurements rather than between two conventions.

The eye has a shutter

An isoluminant flicker fuses at fifteen hertz and a luminance one at sixty, so a light whose colour changes forty times a second is a steady light of a colour it never emits. And the frequency at which flicker stops being visible is not a property of the eye — it moves twelve and a half hertz for every decade of light.

eye · Cones
A 100 hertz drive, and whether anybody sees it. 3 cycles of a 100 hertz drive at 100 per cent modulation. The number beside each is how far above the threshold for seen flicker its loudest harmonic sits: above one and a stationary observer sees the flutter, below it and only something moving does. Fusion is at 60 Hz at 100 cd/m², and moves 12.5 Hz for every decade of light.

A lamp has a waveform

A lamp modulating a thousand times a second is a hundred times past the frequency at which flicker fuses, and it is plainly visible — as a dotted trail, during any glance across the room. The reason is not a new measurement; it is the spatial contrast sensitivity function, arriving from an unfamiliar direction.

light · Light
The eye's own drift, and what it does to every spatial frequency. A pattern of f cycles per degree, drifting across the retina at 0.5 degrees a second, arrives at each receptor at f × 0.5 hertz. The curve is the temporal sensitivity at that rate, against the pattern's spatial frequency. Every frequency the eye can resolve stays above a quarter of the temporal peak, and the band of drift speeds for which that holds is 0.02–0.71 degrees a second — with the measured drift inside it. Faster and the finest detail is carried past 60 hertz, where there is no sensitivity at all.

The eye is never still

A perfectly stabilised retinal image disappears within seconds. What keeps the world there is a drift of about half a degree a second between the microsaccades — fast enough to keep the finest detail modulating and slow enough not to carry it past fusion, in a band whose upper edge is at 0.71 degrees a second.

brain · Appearance
What a dither mask is worth, read as components, in two dimensions. Five luminance ramps, each quantised to 8 bits with and without a high-passed mask of the same power. The bars are the most visible single sinusoidal component of the error, as a multiple of the contrast that component needs to be seen: above the line at one it is visible. The mask lowers it by 20–22×, on every ramp — which the one-dimensional model on this site says it does not, and that disagreement is the finding.

Every threshold was measured with a grating

An earlier essay here claimed that the model cannot explain why dither works, and named two missing pieces. One of them was real and worth thirteen times the guess; the other was not needed. The piece nobody named was the detector — and reading the same model two ways changes the answer by a factor of fifty.

limits · Limits
A halftone tint away from the centre of gaze, two ways. The upper curve raises the threshold by the E2 rule and leaves the filter alone, which is the multiplication the last phase guessed at. The lower one also moves the cutoff, because eccentricity magnifies the whole spatial scale — implemented as the substitution that makes it exact, a screen of ruling r seen through a filter whose cutoff has been divided by s being a screen of ruling r·s seen at the fovea. The horizontal line is threshold. The screen is visible where you are looking and gone by 3°, while the product prediction has it visible across the whole page.

A tint at the edge of a page

The last phase left this join open and guessed at its answer — how visible a halftone tint is away from the centre of gaze should be the product of two effects it had measured separately. It is not the product. At five degrees the guess is fifty-three times too generous, and by twenty it is out by eight orders of magnitude.

difference · Metric
The drift window, asked about each channel in turn. Every spatial frequency a channel can resolve, drifting at v degrees a second, arrives at f × v hertz; the bar is the range of v over which all of them stay above a quarter of that channel's temporal peak. The luminance band is closed at both ends — 0.018 to 0.71 degrees a second — because its temporal sensitivity has a dip at zero to fall into. The chromatic bands have no slow edge at all, because chromatic temporal sensitivity is low-pass: a stationary chromatic pattern sits at the top of its own sensitivity. The mark is the measured drift, and it is inside all three.

The drift is a luminance mechanism

The eye's own drift was shown to sit inside a band of speeds that keeps every spatial frequency modulating, and the band was quoted as though it were about vision. Asked about colour, it has no slow edge at all — a stationary chromatic pattern needs no eye movement whatever. And a stabilised chromatic pattern is the first thing to fade.

eye · Cones
Every filtered claim in these essays, read at a point and read as components. Each row is a comparison one of the essays makes. The bar is the ratio between the two readings — how many times larger the component answer is than the point answer, or the reverse — on a logarithmic scale. 5 of 7 disagree by more than half again, and 4 disagree about the direction of the effect rather than merely its size. The three marked as noisy are the ones with a noise field on one side of the comparison, and they are the three largest.

The list nobody made

The last phase found that reading a filtered signal at a point asks a question its thresholds were never fitted to, made it a standing rule, and admitted that nobody had gone back through the site to see which claims it touched. Here is the list. Every claim with noise on one side of it moves — and so do two that have no noise in them at all, which the rule said would not.

limits · Limits
Where a pooled gain gives out, against where the eye does. The falling curve is how much of a pattern of each spatial frequency a local adaptation pool of 0.5° can see — and therefore how much of it a settled eye can cancel. It is half gone by 0.37 cycles per degree, which is a feature about 2.7° across. The three marks are the acuity limits of the luminance channel and the two chromatic ones. Every one of them is more than an order of magnitude finer than the pool, which is why a stabilised eye loses the fill of a picture and keeps its outline rather than losing the picture.

What a still eye stops seeing

A stabilised image is said to vanish, and nothing in a temporal filter predicts it — sensitivity at zero frequency is a quarter of the peak, not nothing. Give the adaptation gain a size and the answer falls out — fading is a high-pass filter that switches on over a minute, it takes the fill and leaves the outline, and a patch has to be about two degrees across before it goes at all.

eye · Cones
How fine a screen each channel can see. A halftone screen at 35 per cent coverage, 45 degrees, seen by each of the eye's three spatial channels. The bar is the ruling at which it drops below that channel's own threshold. The luminance channel is still seeing it at 55 cycles per degree; the two chromatic ones have lost it by 15 and 10. The dashed line is an ordinary press ruling at reading distance, and only one channel is above it. A halftone is a luminance object, which is why the ink whose dots are nearly the lightness of the paper is the one nobody worries about.

A halftone is a luminance object

The eye's three spatial channels resolve a screen at 55, 15 and 10 cycles per degree, so at any ruling a press actually runs only one of them can see it at all. The corollary corrects a guess already published here — rotating a screen matters more to the chromatic channels, not less — but only at rulings so coarse that nobody prints there.

difference · Metric
What a halftone measures, against what it looks like. A 50 per cent screen, measured by an aperture that averages the patch and seen by an eye that blurs it first and compresses afterwards. At a coarse ruling the two disagree by ΔE00 11.1, and the patch looks 14.3 lightness units darker than it measures — the average of a concave function is below the function of the average, which is Jensen's inequality and not an illusion. The gap falls under a unit above 30 cycles per degree. That is a viewing distance, and the correction a press applies for dot gain has no distance in it anywhere.

Measured with an aperture, seen with an eye

A spectrophotometer averages a halftone patch and reports one reflectance. An eye blurs it first and compresses afterwards, and the average of a concave function is below the function of the average — so a resolvable screen looks darker than it measures, by fourteen lightness units at a coarse ruling and by nothing at a fine one. The correction a press applies is the same size and has no viewing distance in it.

applied · Delivery
Every claim here that was computed with one model, recomputed with two. Each row is a claim one of these essays makes. The bar is how many times the two-model answer differs from the one-model answer, on a logarithmic scale. 3 of 13 have no bar at all: the first model's answer for them is exactly zero, not because it computed zero but because it has no variable for the quantity. Those are the rows where a second model did not correct an answer — it supplied one.

What a second model changed

Thirteen claims here, each computed with one model and recomputed with two. Ten of them move by half again or more. Three of them do not move at all in the ordinary sense — the first model's answer is exactly zero, not because it computed zero but because it has no variable for the quantity — and every one of those three is a join that supplied a state or a device rather than a spread.

limits · Limits
A stabilised grating fades at a rate that depends on which way its bars run. What is left of a 0.3 cycle-per-degree grating, in multiples of its own threshold, as a function of its orientation, at four moments after the image was stabilised on the retina. The first curve is flat to floating point: at the instant the pattern arrives, orientation does not matter, because the filter that carries it has no orientation preference at this frequency. The anisotropy arrives with the fading, reaching ×2.09 after five minutes, and a pool with no axis predicts none of it.

A fading pool has a shape

Giving the local adaptation pool two axes instead of one costs a single parameter and produces a prediction the circular version cannot make — a stabilised grating fades at a rate that depends on which way its bars run. The obvious objection is the oblique effect, and the two act in bands that do not overlap.
eye · Cones
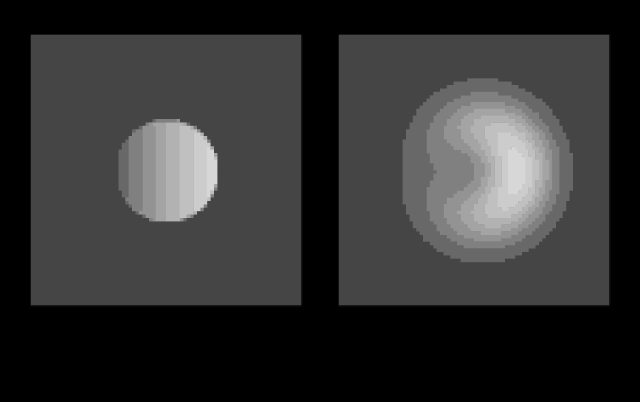
The same border signal, filled in with a boundary and without one. Two fields, each 6 degrees across. The signal is injected along a ring just inside a contour and varies around it, brightest on one side and dimmest on the other. On the left the signal diffuses and the contour is impermeable: the interior settles to 1.000 against a border mean of 1.000, which is the mean-value property of a harmonic function arriving as a prediction about appearance. On the right the same signal is handed to a Gaussian pool of 0.5°, which has no notion of inside: it reaches 0.040 at the centre, because a kernel weights the near rim more than the far one and a filled region does not.

A pool with an edge

A Gaussian pool says how much of a stabilised image survives and can say nothing about what the remainder looks like, because a Gaussian has no edge. Give the pool a boundary and the interior of a faded region takes the average of its own border — exactly, by the mean value theorem, arriving as a prediction about appearance.

scene · Scene
What is read at each distance from the edge of a lit region. Three materials under a half-plane of light, with the boundary at the centre of the horizontal axis and the lit side on the right. The vertical axis is the radiance leaving the surface as a share of what it leaves far inside the lit region. On the unlit side the sample is emitting light while receiving none, so the ratio the model calls a reflectance has a zero denominator there. The distance over which the curve runs from a tenth to nine tenths is 0.21 millimetres on coated paper and 5.1 on pale marble — which is the width of the neighbourhood a point's colour is decided by.

Two blurs before the eye's own

A translucent object arrives at the eye already blurred, by a kernel that is a property of the material rather than of the optics. On every material in this collection's table that blur is coarser at ordinary reading distance than the finest detail the eye can resolve — so the softness of marble or skin or wax is not a failure of vision, it is the object.

eye · Cones
Where the mosaic is filled in, along one row through an edge. A Bayer row across a step from 0.9 to 0.08, in units of the sensor's own ceiling, reconstructed in linear light and reconstructed after the tone curve, with the second undone so the two are compared at the same point in the chain. Away from the edge they agree to 8.3e-14, because a constant interpolates to itself under any curve. At the edge they differ by 5.78 colour differences. Interpolating encoded values pulls an edge towards its dark side.

One step has no choice

Four of a raw converter's operations can be arranged twenty-four ways. The reconstruction cannot be arranged at all — a colour matrix needs three numbers and a mosaic site has one, so filling in the mosaic is forced to the front by arithmetic rather than by convention. What is not forced is whether it happens in linear light or after the curve, and that decision costs 5.8 colour differences at an ordinary edge and nothing at all four sites away from it.

imaging · Capture
The corner of a patch of skin against its own shadow, magnified four times by Lanczos, three lobes. A map of the neighbourhood of one corner of a square patch — the patch fills the lower right, the field the rest — once it has been magnified four times by Lanczos, three lobes. Each cell is shaded by how much lighter (warm) or darker (cool) the stored-value result is than the light's, the deepest shade 18.2 units of lightness. Within three source pixels of the corner the stored-value result is up to 14.5 colour differences lighter, 14.5 outside the patch against 3.1 inside it, and up to 7.3 darker.

The corner of a resized patch is lighter than its edges

A resize taken on stored values is darker than the resize of the light wherever its weights are positive, and lighter beside an edge where a kernel's negative lobes fall. In two dimensions the kernel is a product, and just outside a patch's corner a Lanczos magnification of skin against its shadow comes out 14.5 colour differences lighter — more than along either edge. A reduction to a quarter is mostly an average and errs lighter by at most two. And an unsharp mask, whose negative weights are its whole purpose, is lighter on the stored values at every amount on every pair, and never darker.

applied · Delivery
Three stored-value defects, before the eye and after it, a print at 40 cm. Each defect's largest colour difference between the version computed on stored values and the version computed on light, read twice: as a pixel carries it, and after both images have been through the visual system's three channels at 83 pixels a degree. The two rankings are not the same. The unsharp mask has the largest error per pixel — 16.62 — and keeps only 38 per cent of it; the corner has the smallest at 7.14 and comes out at 9.87. The filter is not a blur applied to a difference: it is applied to each image, and the difference is taken after.

The eye keeps the lightness errors

Four essays have priced what a resize taken on stored values costs, in colour differences between pixels. A reader does not see a pixel. Put the two versions of each image through the visual system's own three channels and the ranking reverses: the unsharp mask, the largest error per pixel at 16.6, is seen at 6.3 on a printed page, while the corner's 7.1 is seen at 9.9. What decides it is not the size of an error but how much of it is colour.

applied · Delivery
Where an unsharp mask errs, per pixel and as seen: print, 40 cm. The upper-left corner of a patch of skin against its shadow after an unsharp mask, as two maps of the colour difference between the result taken on stored values and taken on light. Left, pixel by pixel: the corner peaks at 16.8 and the middle of the edge at 16.6. Right, after the eye's three spatial channels at a print at 40 cm: the corner is seen at 17.1 and the edge at 7.1, a ratio of 2.40. Darker is larger, on one scale for both maps.

The eye counts a corner's error, not its peak

A Lanczos-magnified patch errs a fifth more at its corner than along its edges, pixel by pixel, and an unsharp mask errs almost exactly as much at its corner as along its edges. Filtered by the eye over the plane rather than along a line, the two swap: the magnified corner is seen exactly as its edge is, and on a printed page the sharpened corner is seen at 2.4 times its edge. What decides it is whether the error changes sign. Ringing averages away and a one-sided halo does not, and a corner is where two edges' halos land on the same patch of retina.

applied · Delivery
Where a sharpened E errs, per pixel and as seen: black type on paper, 10 point. The letter E at 10 point on a 300-dot-an-inch page, black type on paper, sharpened by an unsharp mask on stored values and on light; the two maps show the colour difference between the results, pixel by pixel on the left and after the eye's three spatial channels at 40 centimetres on the right, on one scale. The thin line is the letter's outline and the dashed circles mark two pixels round each corner — 8 outer corners and stroke ends, 4 inside angles. The circled zones are 31% of the outline and hold 28% of the per-pixel error and 25% of the seen error.

Sharpened type errs on its dark side

A sharpened square hides its halo along its edges and shows it at its corners, so a sharpened page of type was predicted to show its error at the corners of its letters, several times out of proportion to their length. Black type does the opposite: its outer corners and stroke ends hold between two thirds and nine tenths of their share. As the eye leaves it, the error lies on the dark side of every edge, and a corner holds as much of it as it has dark ground around it — a quarter of a disc where a black corner points out into paper, three quarters where black wraps round a pale one.

applied · Delivery

Named alongside it

The objects these essays reach for when they reach for this one.

Contrast sensitivityOpponent processingViewing distanceThresholdSamplingImage differenceEccentricityAdaptationAssertionHalftoneLuminanceTemporal sensitivity

All concepts