The eye keeps the lightness errors
Assumes The corner of a resized patch is lighter than its edges, An average on the stored values and Colour thrown away on purpose.
An average on the stored values found that a blend taken on encoded numbers lands 18.7 colour differences from the blend of the light. A resize with a negative weight in it found that a kernel’s negative lobes make the stored-value result lighter beside an edge. The corner of a resized patch is lighter than its edges found the largest of those errors at a corner, and that an unsharp mask errs lighter at every amount.
Colour thrown away on purpose is the one stage of the chain where the eye’s own spatial limits were already the argument. Every one of the other numbers is ΔE₀₀ between two pixels. A reader does not see a pixel; they see a picture at a distance, through a visual system that treats lightness and colour at completely different spatial scales.

The ranking reverses, and colour is why
What decides whether a stored-value defect survives is how much of it is colour rather than how large it is — and the three defects are very different mixtures, so the ranking by colour difference and the ranking by what is seen come out reversed.
- The unsharp mask carries the largest error per pixel, 16.62, and on a printed page it is seen at 6.29 — 38 per cent of it. The corner carries the smallest, 7.14, and is seen at 9.87.
- The peak error of the corner is 7.12 units of lightness against 0.96 of colour; the mask’s is 17.78 against 13.57. That is measured before any filtering, so it is not read out of the result it explains.
- The achromatic channel passes everything below about twenty cycles a degree unchanged; the chromatic channels are down to a sixth of their gain by eight.
- A colour difference computed pixel by pixel is not an upper bound on what a reader sees. At a print’s resolution the corner’s error comes out 38 per cent larger after filtering.
- The inversion needs resolution. At an ordinary display distance the mask is still the largest error a reader sees; at a print’s resolution it is the smallest.
Filtering an image is not blurring a difference
The measurement has to be set up carefully, because there is an obvious wrong way to do it that would make the whole question vacuous.
The wrong way is to compute the difference between the two images and then blur that. A blur applied to a difference can only shrink it, so the answer would be known before the calculation: every defect gets smaller and the narrow ones get smaller fastest. It would also be a model of nothing, because the visual system is not handed a difference.
The right way is what a reader does. Each image goes through the filter on its own — decomposed into an achromatic channel and two chromatic ones, each low-passed at its own cutoff, and recomposed — and the colour difference is taken between the two filtered images, sample by sample. Nothing in that guarantees the difference shrinks, and it does not.

Seventeen of the corner row’s samples sit at almost nothing, and they are the ones where the two versions agree exactly: an interpolating kernel reproduces its input at the input’s own positions, so where an output sample lands on a source pixel, taking the average on stored values and taking it on light give the same answer, because neither takes an average at all. The error lives entirely in the samples between them.
That comb is at the magnification’s own period — four output samples, here — and it is what the filter acts on. It fills the zeros in, and the peak comes out larger rather than smaller. The shape of a defect along the row is what decides what happens to it, and the shape is a property of the resampling rather than of the kernel.
The three defects are different mixtures
The explanation is in what each error is made of, and it is worth measuring before the filtering rather than after, so that the mechanism is not read out of the thing it is supposed to explain.

The corner’s peak is 7.12 units of lightness against 0.96 of colour — 12 per cent colour. It is nearly a pure tone error, and that is what it should be: the encoding a resize is taken on is a tone curve — the midpoint is not half is the whole of what that curve does, so an average taken on it is wrong about tone. Where the three channels are lifted or lowered by the same encoded amount they are lifted or lowered by different amounts of light, but at an edge between two colours of similar hue the three errors are nearly proportional and the result is a lightness shift.
The unsharp mask’s peak is 17.78 of lightness against 13.57 of colour — 43 per cent. A mask’s overshoot is the difference between a pixel and its own blurred neighbourhood, scaled and added back. On stored values that difference is taken in the encoded variable, where the three channels’ curvatures differ most at the levels each of them happens to sit at, so the overshoot pushes the channels apart as well as up. A sharpen does not merely lighten; it shifts hue.
The edge sits between them at 26 per cent.
And the visual system treats the two parts completely differently. Its achromatic channel is flat to about twenty cycles a degree and then falls; its red–green channel is at 0.45 of its gain by four cycles a degree and 0.16 by eight. So a defect made of lightness is delivered whole to a reader at any ordinary resolution, and one made of colour is not.
Where the picture is delivered decides which defect matters
Pixels a degree is the variable, and it is the one nothing in a file records.

The mask’s visible error falls steadily as the delivery gets finer — 11.21 at seventeen pixels a degree, 16.27 at forty-one, 6.29 at eighty-three — because a feature of fixed pixel width sits at a higher spatial frequency the more pixels there are in a degree, and its colour content moves into the range where the chromatic channels have no gain left.
The two resampling errors rise instead. The corner goes from 7.27 to 9.87 and the edge from 11.99 to 16.35 over the same range. Their content is lightness, the achromatic channel keeps it whatever the frequency, and what the filter does to them is redistribute the comb rather than remove it.
So at an ordinary desk — a hundred-pixel-an-inch display at sixty centimetres — the ranking a reader would report is the ranking the pixel measurements gave: the mask is worst. At a printed page’s resolution the two have changed places. A picture resampled on stored values and sharpened on stored values has two defects in it, and which of them a reader will complain about depends on whether they are looking at a screen or at paper.
The same defect, closer
The viewing sweep has one row in it that is worth reading on its own, because it is the case a reader creates deliberately.

Leaning in reverses the advice. At seventeen pixels a degree the mask is seen at 11.21, down from 16.27 at arm’s length, and the corner at 7.27, down from 7.65. Both fall, because a feature of fixed pixel width moves to a lower spatial frequency as the reader gets closer and the achromatic channel has no more gain to give there while the chromatic channels recover some of theirs.
So the defect a reader is most likely to notice is not the one they see when they look for it. Leaning in to inspect an edge moves every one of these errors towards the middle of the eye’s range, where the differences between them shrink; standing back on a printed page is where they are furthest apart. The inspection habit that finds a defect is the one least able to rank two of them, which is worth knowing before an operator is asked to choose between two resampling settings by eye.
The dial a user turns does not do what its numbers say
An unsharp mask has an amount, and it is the one control in this chain that somebody actually adjusts.

The error per pixel rises from 9.72 at an amount of a quarter to 16.62 at an amount of one and then flattens, because the overshoot starts clipping. What a reader sees falls from 9.13 to 6.29 over the same range and rises again to 9.99 at an amount of two.
The reason is the mixture. Raising the amount raises the overshoot, and a larger overshoot in the encoded variable pushes the three channels further apart — so the error grows and becomes more colour, and the second half of that is invisible to the reader at a print’s resolution while the first half is not. Past an amount of about one the overshoot clips, the channels are pinned at the top of their range, the error stops being colour and starts being lightness again, and what a reader sees rises.
A user turning this dial and judging by a difference metric is being told the opposite of what their eyes will report, over the range where the metric is largest.
What the kernel does, and where
One negative result is worth keeping, because it says what this row can and cannot measure.

Their peak errors along the diagonal span 0.18 of a colour difference — nothing. The reason is symmetry: the positions the diagonal passes through are ones where a symmetric interpolating kernel’s weights are fixed by its symmetry rather than by its shape, so all three kernels put the same fraction of the patch into the same sample there.
That is not the result the corner of a resized patch is lighter than its edges reported, which was 14.5 for a Lanczos and much less for a tent. It measured a two-dimensional neighbourhood; this measures a line through it. The negative lobes bite away from the diagonal, and a row cannot see them.
So the numbers here are about the shape the defect has along a line, which is what the visual model takes, and they are a lower bound on what the neighbourhood holds. The mechanism — lightness survives, colour does not — is a property of the content rather than of the geometry, and it would hold for the larger error too.
What a pipeline could do with this
Three things, and the first two are already the advice.
Resample in linear light, which removes the defect rather than arguing about its visibility. Nothing here softens that: the errors are real, and at a print’s resolution the corner’s is seen at nearly ten colour differences.
Sharpen in linear light too, and for a reason the earlier essays did not have. A sharpen’s stored-value error is 43 per cent colour, which is the most colour of any stage here — so it is the stage whose error a reader is least likely to see and the stage whose error is most obviously wrong. The two facts do not conflict: an error that a reader does not see at a print’s resolution is still in the file, and it is seen on a screen.
And stop ranking stages by colour difference alone. A chain’s error budget adds up quantities that a reader weights very differently, and a chain measured in a unit that cannot add already found one reason the addition is wrong. This is a second, and it has a direction: the budget systematically overweights the stages whose errors carry colour, because those are the errors the formula is most sensitive to and the eye is least.
How the images were filtered
Each defect is computed as two rows of colours rather than as a row of differences: the same resampling taken on the stored values and taken on the light, sample by sample, with the clip applied to both. The corner row runs along the diagonal through the upper-left corner of a patch magnified four times; the edge row runs perpendicular to a straight boundary of the same patch; the mask row runs across a step with an unsharp mask of amount one and radius 1.5 applied. The colours are skin against its own shadow, which is the pair on which the one-dimensional measurements found the largest lighter error.
The rows are sampled on the magnification’s own output grid — at (q + 0.5) / factor − 0.5 in source coordinates — rather than at round fractions of a source pixel. The distinction is not cosmetic: a row stepped by a quarter of a source pixel from zero lands on the exact midpoint between two pixels, which is the one place every symmetric kernel returns the same value, and such a row reports the same peak for all three kernels.
Both rows go through the three-channel filter at the stated pixels a degree, and the colour difference is taken between the filtered rows position by position. The geometries are a 300-dot print at 40 cm, a 100-pixel display at 60 cm and at 25 cm, and a 400-pixel display at 30 cm, which bracket how a delivered picture is actually looked at.
What this does not settle
The visual model is a one-dimensional low-pass per channel, and a corner is two-dimensional. A row through it is the right input for this model and it is not the whole defect; a two-dimensional filter would take the neighbourhood the kernel’s negative lobes actually occupy, and the numbers would be larger.
The model’s cutoffs are fitted to grating detection at threshold, and these defects are not gratings and are not at threshold. What the model is being asked is how much of a difference survives the filter, which is a linear question it can answer; whether a difference of six colour differences is noticed in a photograph is not, and a threshold is not a unit is the standing caution on treating one as the other.
Nothing here is a judgement experiment, in the sense a proof cannot be tuned for readers who disagree means by one. It says the two rankings differ and by how much, in the model’s own units, and does not say that a reader prefers one picture to another.
And the pair is one pair. Skin against its shadow is where the largest lighter error was found; a pair with more hue difference between its two colours would put more of every defect into the chromatic channels and would move all three numbers the same way.
Still open: whether a two-dimensional filter closes the gap
The measurement that would settle the corner is the one this row cannot make. The defect the earlier essay found — 14.5 colour differences for a Lanczos magnification — lives in a small neighbourhood off the diagonal, and reading it needs a filter over the plane rather than over a line.
The prediction is specific and it can be stated before the work is done. The corner’s error is nearly pure lightness wherever in the neighbourhood it is measured, because its cause is the encoding’s curvature rather than a difference between the channels; so a two-dimensional filter should leave it almost entirely intact, and the number that arrives at a reader should be close to the 14.5 rather than to the 9.87 a line through it gives. If it is instead much smaller, then the neighbourhood’s error has structure at a frequency the line missed, and the line was measuring the wrong thing.
The same filter would settle the mask, where the prediction points the other way: nearly half of its error is colour wherever it is measured, so a plane should treat it much as a line did.
A difference metric is not a reader
The habit is about what a per-sample measurement of two images is a measurement of.
A colour difference formula answers a question about two patches seen side by side, and applying it position by position to two images answers that question many times. It does not become a statement about the images, because a reader does not see the positions separately: the visual system integrates over a neighbourhood whose size depends on the viewing distance, and it integrates lightness and colour over neighbourhoods of very different sizes.
The move is to filter each image and then difference, rather than to difference and then argue about visibility. The order matters, the second order cannot produce a growth, and the growth is the finding — a defect can come out larger through a filter that only ever removes things, because what it removes from the two images is not the same.
The failure mode is to treat a pixel-wise metric as conservative. It is an upper bound on nothing, it overweights exactly the errors the eye discards, and a chain’s worst stage by that measure can be its least visible one.
Where this goes next
 The corner of a resized patch is lighter than its edges
A resize taken on stored values is darker than the resize of the light wherever its weights are positive, and lighter beside an edge where a kernel's negative lobes fall. In two dimensions the kernel is a product, and just outside a patch's corner a Lanczos magnification of skin against its shadow comes out 14.5 colour differences lighter — more than along either edge. A reduction to a quarter is mostly an average and errs lighter by at most two. And an unsharp mask, whose negative weights are its whole purpose, is lighter on the stored values at every amount on every pair, and never darker.
The corner of a resized patch is lighter than its edges
A resize taken on stored values is darker than the resize of the light wherever its weights are positive, and lighter beside an edge where a kernel's negative lobes fall. In two dimensions the kernel is a product, and just outside a patch's corner a Lanczos magnification of skin against its shadow comes out 14.5 colour differences lighter — more than along either edge. A reduction to a quarter is mostly an average and errs lighter by at most two. And an unsharp mask, whose negative weights are its whole purpose, is lighter on the stored values at every amount on every pair, and never darker.
 An average on the stored values
A resize, an antialiased edge, a transparency composite and a chroma subsample are all averages, and in almost every pipeline they are taken on the numbers as stored. The numbers as stored are encoded, the encoding is a compression, and a half-and-half blend of black and white taken that way lands 18.7 colour differences from the half-and-half blend of the light — 22.7 units of lightness darker, on every pair, always in the same direction.
An average on the stored values
A resize, an antialiased edge, a transparency composite and a chroma subsample are all averages, and in almost every pipeline they are taken on the numbers as stored. The numbers as stored are encoded, the encoding is a compression, and a half-and-half blend of black and white taken that way lands 18.7 colour differences from the half-and-half blend of the light — 22.7 units of lightness darker, on every pair, always in the same direction.
 Colour thrown away on purpose
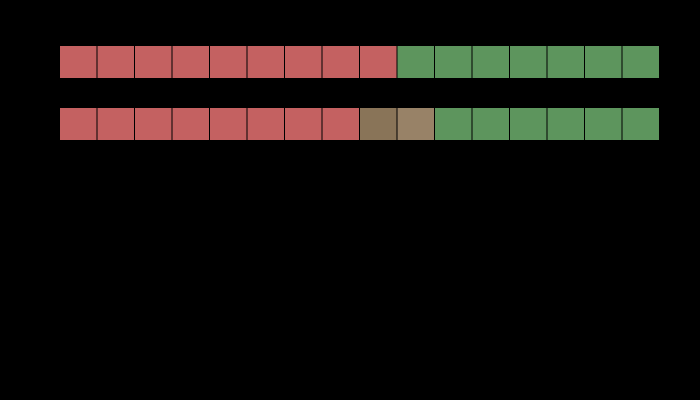
Every video format in use discards three quarters of its colour information and keeps all of its luminance, because the eye resolves fine colour detail badly. On an edge that carries luminance the loss is exactly zero. On an edge of nearly equal luminance it is a colour difference of forty-three, and the two edges are the same edge to the codec.
Colour thrown away on purpose
Every video format in use discards three quarters of its colour information and keeps all of its luminance, because the eye resolves fine colour detail badly. On an edge that carries luminance the loss is exactly zero. On an edge of nearly equal luminance it is a colour difference of forty-three, and the two edges are the same edge to the codec.
What this makes readable
Essays that name this one as a prerequisite.
Named alongside this one
Essays reaching for the same objects. Nobody chose these; they are what the index of named objects makes visible.
- How fine a colour edge can be contrast sensitivity · image difference · opponent processing · spatial frequency · viewing distance
- A difference has no size contrast sensitivity · image difference · spatial frequency · viewing distance
- A halftone is a luminance object contrast sensitivity · opponent processing · spatial frequency · viewing distance
- A pattern has a direction contrast sensitivity · opponent processing · spatial frequency · viewing distance
- A tint at the edge of a page contrast sensitivity · image difference · spatial frequency · viewing distance
- What a still eye stops seeing contrast sensitivity · opponent processing · spatial frequency · viewing distance
What links here
Every essay whose body links to this one.
The objects this essay names
Each one links to every other essay that touches it.
Colour differenceContrast sensitivityImage differenceInterpolationLinear lightOpponent processingSharpeningSpatial frequencyViewing distanceWorkflow