Concept

Interpolation — where it appears

Filling in between measured entries, which is exact at every entry and is where the whole error of a table lives. A profile is a table with interpolation between its entries, so the grid's spacing decides an error that no amount of measurement precision touches.

Named by 28 essays across 7 fields — each of them below, with the objects they name alongside it.

A grey edge, reconstructed from a Bayer row, arrives coloured. Above: an achromatic step through 24 sensor sites, with green sampled on the even ones and red on the odd. Interpolating each channel separately reconstructs them from data taken on either side of the edge, so their ratio moves. Below: the resulting chroma, peaking at 144 per cent of the local mean, and 112 per cent once colour differences are interpolated instead.

A grey edge arrives coloured

A sensor site measures one channel and the other two are interpolated from neighbours that sat somewhere else. Across a black-and-white step that reconstruction gives an achromatic scene a chroma of 144 per cent of its own local mean, and nothing in the scene or the sensor was coloured.

imaging · Capture
How wrong a profile is between its entries. A device profile is a lattice of measured patches and an interpolation. At every node of every grid drawn here the error is exactly zero, which is why a profile checked at its own patches always looks perfect. Sampled between the nodes, a 3-step grid is worst by ΔE00 = 2.93 and a 17-step grid by 0.30. Both are honest tables of the same press.

A profile is a table

An ICC profile does not contain a model of the device it describes. It contains a lattice of patches that were printed and measured, and everything between them is interpolation — which is exactly zero at every patch, so a profile checked against its own target reports perfection for ever.
applied · Delivery
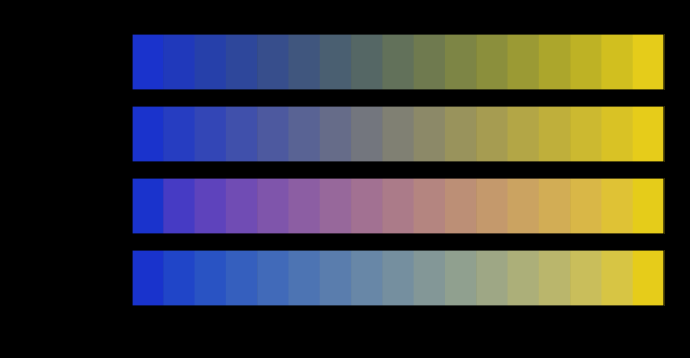
One pair of colours, blended in four spaces. Every row starts and ends at the same two colours and visits different ones in between. The chroma of the middle falls furthest in linear light, by 83 units below the straight line between the endpoints' chromas — the grey dead zone that every blue-to-yellow gradient has and that no endpoint mentions. Any colour a route visits that this display cannot show is hatched rather than clipped.

A gradient is a path

Two colours fix the ends of a blend and nothing else. The middle is decided by the space the interpolation happens in, and four spaces in daily use put the halfway point of one ordinary gradient as much as thirty-seven units of colour difference apart.

matching · Gamut
Which of two reproductions is better depends on which statistic is asked. A specification for a proof or a print run is written against a set and has to reduce the set to one number. Here are two candidates: the one with the lower mean has the higher ninety-fifth percentile, so the mean prefers A and the tail prefers B. Across 2000 pairs of candidates generated the same way, the two statistics disagree about the winner 30 per cent of the time. Both numbers are honest; only one of them is what somebody notices.

A mean is not a difference

A specification for a proof, a profile or a print run is written against a set of colours and has to reduce that set to one number. The mean and the ninety-fifth percentile disagree about which of two reproductions is better in thirty per cent of cases, and both numbers are honest.

difference · Metric
A camera matrix fitted under each light, used under each light. Mean ΔE00 over the same surfaces, with the matrix fitted under the row's light and the scene under the column's. The diagonal is what a profile's data sheet quotes and is between 1.0 and 1.2 everywhere. Off it the numbers rise steeply: the matrix fitted under illuminant A reports 1.17 there and delivers 9.34 under a 9000 K daylight, a factor of 8.0. Nothing about the camera changes between cells.

A matrix is fitted under one light

A camera's colour matrix is nine numbers determined by a chart photographed under a particular illuminant, and the error it quotes is the error under that illuminant. Fitted under a tungsten lamp and used under a cold sky it delivers eight times as much — and the two-matrix scheme every real profile uses turns out not to be a compromise at all.

imaging · Capture
What the next thousand patches buy a printer profile. A profile is a table, exact at its nodes and interpolated everywhere else. Each mark is a grid: the horizontal axis is how many patches somebody had to print and measure, the vertical is the worst error found between the nodes. Going from 135 patches to 3645 — 27.0× the work — buys 8.4× the accuracy. The error falls with the square of the spacing and the count rises with its cube.

A profile is a fit between its nodes

A printer profile is a table, exact at every patch that was printed and interpolated everywhere else — and everywhere else is where every job lives. Going from a hundred and thirty-five patches to three and a half thousand is twenty-seven times the work for eight times the accuracy, and the exponents say that is as good as it gets.

applied · Delivery
The census along the line from ΔE76 to ΔE94, and past it. ΔE94 is ΔE76 with two weighting constants in it, and at zero those constants make every weight exactly one, so the two formulae are joined by a line rather than separated by a choice. The horizontal axis is how much of the published weighting is applied: 0 is exactly ΔE76, 1 is exactly ΔE94, and 3 is three times more weighting than anybody has proposed. The falling curve is the census's mean elasticity to how saturated its test set is, which drops from 1.11 to 0.74 — most of the fall happening before the published value is reached. The other curve is Kendall's τ against ΔE2000's ranking, and it peaks at w = 0.5, not at 1: the weighting that best reproduces the published ordering is about half the published weighting. There is no value of this dial that reaches ΔE2000, whose rotation term is not on this line at all.

A dial through a discrete menu

ΔE*94 is ΔE*ab with two weighting constants in it, and at zero those constants make every weight exactly one — so the two ends of the oldest disagreement in colour difference are joined by a line rather than separated by a choice. Walking it gives a derivative where a menu gives only a spread, and the derivative says the published weighting is on the far side of the interesting part.

difference · Metric
How much of the residual a partial correction removes. Between the diagonal gain and the exact matrix there is a line: apply the correction that would make a row exact, but only a fraction of it. The horizontal axis is that fraction and the vertical is the share of the row's residual it removes, for all fourteen census rows. The straight diagonal is where a correction worth exactly its fraction would fall, and in the published unit every curve lies on it to within 2.2 percentage points. The lower band of curves is the same interpolation measured in CAM16-UCS, which departs by up to 17 points — because its distance is a power of the Euclidean one and a power is not homogeneous along a ray, where every ordinary norm is. The straight line is therefore a property of the ruler rather than of the correction, and the exception is what says so.

A partial correction is worth its fraction

Between a diagonal gain and the exact matrix there is a line, and a bounded observer's natural hope is that the first part of it is worth a disproportionate share. It is not. On all fourteen changes of light, at every setting, the share of the residual removed matches the share of the correction applied to within 2.2 percentage points — which closes the last way the gap could have been cheap.

scene · Scene
Every figure a surround dial would apply to, weighed. The eleven generators in the appearance family, by the size of the drawing each emits — which is what a dial multiplies, because every frame carries the figure's whole body. The dashed rules are the thresholds the dial policy here is written in: under 3 KB gets thirteen stops, under 6 gets nine, under 10 gets seven, and above about 12 KB nothing gets a dial at all. The median body here is 2.25 KB and 4 of the eleven are inside the most generous tier, against a policy written when the distribution had a median of 4.0 KB. Two phases deferred a surround dial on the grounds that appearance swatches are not small. The exception is unique-hues at 14.1 KB, which is over the ceiling that says it should have no dial — and it has one, on chroma, declared in the same file as the ceiling.

A dial has a price

Two rounds declined to give the appearance model's surround a continuous control, both times because the frames would be too heavy, and neither time was the weight taken. It is 2.25 kilobytes at the median — the light end of these figures rather than the heavy end — and one figure is already breaking the rule the deferral was made under.

applied · Delivery
a fluorescent tube, mercury lines on a phosphor bed, with a 5-nanometre grid marked on it. The light drawn at a fifth of a nanometre, with the 5-nanometre tabulation points marked beneath. 38 of the 53 points carry more than a twentieth of the peak. What a summation over those points computes is not an approximation to the area under this curve; on a spectrum with features narrower than the spacing it is a different quantity, and the difference depends on where the points fall rather than on how many there are.

The index is a choice too

Every colour in this collection is a sum over eighty-one numbers running from 380 to 780 nanometres in steps of five. That index is not a property of the eye, the light or the sample — it is a tabulation, and it holds three separable decisions that behave completely differently from one another.

light · Light
What three fill-in rules cost when a five-nanometre table is read at one. A five-nanometre table read at one nanometre by three rules — hold the value, straight lines, a cubic through four points — each compared with the same tenth-nanometre reference. The dashed rule is the answer obtained by summing the table as it stands, at 0.00000 ΔE₀₀. Two of the three interpolations are worse than not interpolating. That is not a paradox: the summation's error is already small because the normaliser cancels most of it, and an interpolator introduces a shape the original curve did not have, which the cancellation cannot touch. A finer grid is not more resolution when the table is not finer.

A finer reading of a coarser table

Interpolating a five-nanometre spectrum to one nanometre helps a daylight calculation by a factor of five and harms a three-emitter LED by a factor of a hundred and twenty thousand. Both are the same operation on the same table, and which one happens is decided by a property of the light nobody records.

light · Light
Two primaries mixed, and the line a reader assumes they take. The additive mixture of two sRGB primaries, walked in twenty steps, plotted in the a and b of CIELAB. The filled points are where the light actually goes, which is exactly straight in tristimulus values because that is Grassmann's second law. The open points are the straight line between the two readings. They part company by 26.7 ΔE₀₀ at their furthest, at 60 per cent of the way along, and the half-and-half mixture misses the midpoint by 21.1.

The mixture line bows

Grassmann's second law says an additive mixture is exactly linear in tristimulus values, and tested here it is exact to floating point. Nothing downstream of the three numbers preserves it. The physical half-and-half mixture of two colours sits a median of 5.5 colour differences from the midpoint of their two readings and up to thirty; on a green and a blue display primary it is twenty-one, which is a quarter of the distance between them.

matching · Gamut
Where the mosaic is filled in, along one row through an edge. A Bayer row across a step from 0.9 to 0.08, in units of the sensor's own ceiling, reconstructed in linear light and reconstructed after the tone curve, with the second undone so the two are compared at the same point in the chain. Away from the edge they agree to 8.3e-14, because a constant interpolates to itself under any curve. At the edge they differ by 5.78 colour differences. Interpolating encoded values pulls an edge towards its dark side.

One step has no choice

Four of a raw converter's operations can be arranged twenty-four ways. The reconstruction cannot be arranged at all — a colour matrix needs three numbers and a mosaic site has one, so filling in the mosaic is forced to the front by arithmetic rather than by convention. What is not forced is whether it happens in linear light or after the curve, and that decision costs 5.8 colour differences at an ordinary edge and nothing at all four sites away from it.

imaging · Capture
The model's hue scale, and the four numbers it is built from. Hue quadrature against hue angle. The four anchors are the unique hues, each with its own weight, and between them the scale is a hyperbolic interpolation rather than a straight line. The quadrant from blue back to red spans 143 degrees of hue angle for its hundred units of quadrature, against 70 for red to yellow.

The hue scale has four corners

CIECAM16 reports hue twice — as an angle in its own opponent plane, and as a quadrature interpolated through four unique hues with four fitted weights. The second is the one hue tolerances and hue-preserving mappings are written in, and it is piecewise — its slope jumps at each of the four anchors, by a factor of 1.74 at green and by 0.41 at blue, and it runs 4.1 times faster near yellow than near blue.
brain · Appearance
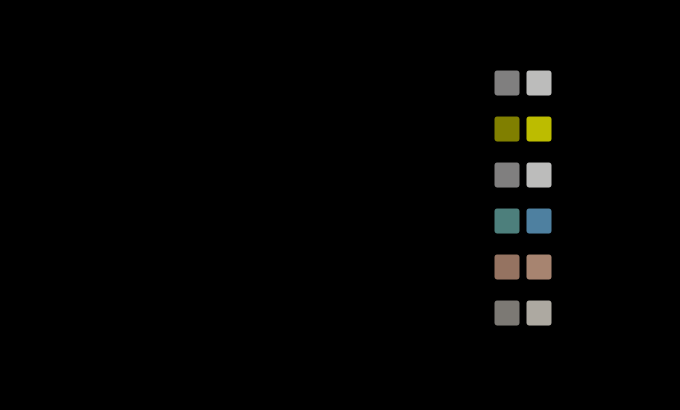
The same blend, taken on the stored values and on the light. Six pairs blended at 50 per cent, once by averaging the values as they are stored and once by averaging the light they stand for. Every resize, every antialiased edge and every transparency composite in an ordinary pipeline does the first. The two land 15.8 colour differences apart at the mean and 19.3 on a red against a green, and the stored-value blend is the darker on all six, by up to 23 units of lightness.

An average on the stored values

A resize, an antialiased edge, a transparency composite and a chroma subsample are all averages, and in almost every pipeline they are taken on the numbers as stored. The numbers as stored are encoded, the encoding is a compression, and a half-and-half blend of black and white taken that way lands 18.7 colour differences from the half-and-half blend of the light — 22.7 units of lightness darker, on every pair, always in the same direction.

applied · Delivery
One edge magnified four times, three ways: text on a page. A step between the two colours of text on a page, magnified four times by linear interpolation, by bicubic and by a three-lobe Lanczos kernel, once on the stored values and once on the light. The curves are the stored-value result's lightness minus the light's, sample by sample across the edge; below the line the stored-value resize is darker. Linear interpolation is darker everywhere it differs. The two kernels with negative lobes swing above the line beside the edge, where their negative weights fall — bicubic by up to 1.8 colour differences and Lanczos by 3.7.

A resize with a negative weight in it

A blend taken on stored values is always darker than the blend of the light, because the encoding is concave and a convex combination of a concave function's values lies below the function of the combination. A bicubic or Lanczos resize is not a convex combination. Beside an edge its negative weights make the stored-value result lighter than the light's own — by up to 6.1 colour differences with bicubic and 12.2 with Lanczos on skin against its shadow — and on edges between full-scale values the clip hides the overshoot and the old guarantee appears to hold.

applied · Delivery
Two matrices blended by colour temperature, under fourteen lamps. For each lamp, with the neutral held exact as a converter holds it: the mean colour difference over twelve test surfaces with a matrix fitted under that lamp (the short bar) and with the tungsten and daylight matrices blended at the weight its correlated colour temperature gives (the long bar). Smooth lamps on or near the locus sit within 6 per cent of their own matrix. The lamps with lines or narrow bands in them sit a median of 2.2 times theirs, from 1.38 for a broadband tube to 5.2 for a three-emitter source.

Two matrices do not reach a white LED

A camera profile's two matrices, blended by the scene's colour temperature, are as good as a matrix fitted anywhere along daylight. Under a white LED or a fluorescent tube the same blend leaves colours twice as far off as a matrix fitted under that lamp, and no weight inside the profile's range repairs it. What decides it is not how far the lamp sits from the Planckian locus — a triphosphor tube sits nearly on it and fares worst — but whether its spectrum has lines in it, which a white balance reading cannot see.

imaging · Capture
What a five-nanometre grid costs a steep-sided notch, against its width, under a 6500 K source. The cost of a five-nanometre grid starting at 380 nm, against a reference at two hundredths of a nanometre, for a sample with a flat-bottomed notch at 552.3 nm under a 6500 K thermal radiator, against the notch's width from 2 to 30 nm, for edges rising in 0.4, 2.2, 6.6 nm. With the steepest edges the cost is 0.02 at 10 nm, 1.99 at 12.5 and 0.03 at 20: it rises and falls with the step as its period and does not die away as the notch widens. With the softest edges it stays under 0.10 at every width.

The cost of a steep notch repeats every step

A Gaussian notch is safe on a five-nanometre grid once it is a couple of steps wide. A flat-bottomed notch with steep sides never is. Its cost on the grid rises and falls with its width, with the step as its period — 0.02 colour differences at ten nanometres, 1.99 at twelve and a half, 0.03 at twenty — and it does not die away as the notch widens. What sets its size is how fast the edges rise, and an interference filter's edges rise in under a nanometre.

light · Light
The corner of a patch of skin against its own shadow, magnified four times by Lanczos, three lobes. A map of the neighbourhood of one corner of a square patch — the patch fills the lower right, the field the rest — once it has been magnified four times by Lanczos, three lobes. Each cell is shaded by how much lighter (warm) or darker (cool) the stored-value result is than the light's, the deepest shade 18.2 units of lightness. Within three source pixels of the corner the stored-value result is up to 14.5 colour differences lighter, 14.5 outside the patch against 3.1 inside it, and up to 7.3 darker.

The corner of a resized patch is lighter than its edges

A resize taken on stored values is darker than the resize of the light wherever its weights are positive, and lighter beside an edge where a kernel's negative lobes fall. In two dimensions the kernel is a product, and just outside a patch's corner a Lanczos magnification of skin against its shadow comes out 14.5 colour differences lighter — more than along either edge. A reduction to a quarter is mostly an average and errs lighter by at most two. And an unsharp mask, whose negative weights are its whole purpose, is lighter on the stored values at every amount on every pair, and never darker.
applied · Delivery
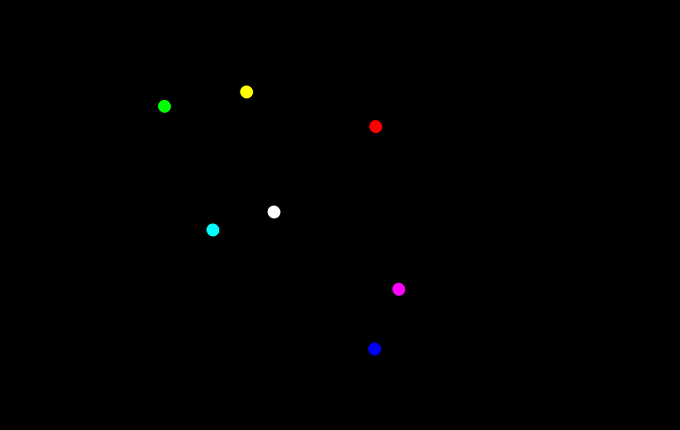
The straight line between two colours, and the formula's own shortest path. Five gradients seen from above, in the a and b plane of CIELAB: the straight line between the two colours in grey, and the shortest path under ΔE₀₀'s own local metric in colour. The lightness coordinate bows too and is not drawn. red to green saves 3.6 per cent and leaves the straight line by 13; blue to yellow saves 7.5 per cent and leaves the straight line by 21; cyan to magenta saves 3.9 per cent and leaves the straight line by 10; black to white saves 0.0 per cent and leaves the straight line by 0; red to blue saves 0.3 per cent and leaves the straight line by 4 CIELAB units at the widest. Black to white is the flat case: its shortest path is the straight one.

The straight line is not the shortest gradient

A colour difference formula says what a small step costs at every colour, and that is enough to ask which path between two colours is shortest. It is not the straight line: between red and green the shortest path bows thirteen CIELAB units away, saves four per cent — and stays inside sRGB on every step where the straight line leaves it. The formula's own answer for the two endpoints, meanwhile, is neither length.

matching · Gamut
Three stored-value defects, before the eye and after it, a print at 40 cm. Each defect's largest colour difference between the version computed on stored values and the version computed on light, read twice: as a pixel carries it, and after both images have been through the visual system's three channels at 83 pixels a degree. The two rankings are not the same. The unsharp mask has the largest error per pixel — 16.62 — and keeps only 38 per cent of it; the corner has the smallest at 7.14 and comes out at 9.87. The filter is not a blur applied to a difference: it is applied to each image, and the difference is taken after.

The eye keeps the lightness errors

Four essays have priced what a resize taken on stored values costs, in colour differences between pixels. A reader does not see a pixel. Put the two versions of each image through the visual system's own three channels and the ranking reverses: the unsharp mask, the largest error per pixel at 16.6, is seen at 6.3 on a printed page, while the corner's 7.1 is seen at 9.9. What decides it is not the size of an error but how much of it is colour.

applied · Delivery
The error between a profile's nodes is a bias, not a scatter. Two quantities against the lattice size: the mean colour difference between the nodes, and the mean signed lightness error. If the interpolation erred in both directions the second would be near zero while the first was not. They lie on each other — 0.136 against 0.133 at a nine-step lattice — so the whole of what a profile does between its patches is to lighten. It errs light because a press's response is convex in ink coverage: the first drop of ink removes more light than the last, and a straight line between two points on a convex curve lies above it. At three steps 400 of 400 samples err light.

A profile interpolates light

A profile is exact at its patches and wrong between them, and how wrong has been measured twice. Which way it is wrong has not. At a nine-step lattice the mean signed lightness error between the nodes is +0.136 against a mean colour difference of 0.133 — the error is not a scatter but a bias, and it lightens. The repair costs nothing measured and is forbidden by how a profile is checked: let the table be wrong at its own patches.

applied · Delivery
An interference notch filter, and where a five-nanometre grid lands on it. The transmittance of a Fabry-Pérot etalon of order 24 and finesse 20, drawn at a fifth of a nanometre, with the standard grid's points marked. Its features are 2.29 nanometres wide and spaced 22.9 apart, so the grid steps over them: between two adjacent grid points the transmittance rises and falls completely, and neither point records it. That is what a real coating looks like, and a Gaussian notch — which is what this collection's earlier work used — is a much gentler object.

A finer table is a worse table

A real interference filter is not a Gaussian notch. It is an etalon, with pass bands a nanometre or two wide spaced twenty-three apart, and a five-nanometre grid steps over them. Resampled from the maker's one-nanometre table its colour is out by five colour differences under every fill-in rule — the three rules agree to three decimals, because none of them is ever handed a sample inside a feature. The same filter measured through a five-nanometre slit is out by 0.03.

light · Light
Two uniform spaces, two answers: cyan to magenta. The gradient from above, in the a and b plane. The grey line is the straight path in CIELAB; the two coloured curves are the shortest paths under ΔE₀₀'s own local metric and under CAM16-UCS's. They are 15.7 CIELAB units apart at their furthest, against bows from the straight line of 9.9 and 12.2. Both spaces are published as uniform and both are used to decide what lies between two colours; they do not agree.

Two uniform spaces disagree about between

ΔE₀₀'s own local behaviour says which colours lie between two colours, and so does CAM16-UCS's. They do not agree. On cyan to magenta the two shortest paths run fifteen CIELAB units apart — more than either runs from the straight line — and on that gradient ΔE₀₀ would rather have the straight line than CAM16-UCS's answer. Getting the comparison at all takes noticing that one of the two has no local metric: its published difference is a Euclidean distance raised to the power 0.63, and a power below one has an infinite derivative at zero.

matching · Gamut
Two tables, two directions of error: 5-node ramps of four inks. For each ink, the mean signed lightness error between the nodes: of the ordinary forward table, which errs light, and of four ways to fill the inverse table, all of which err dark except the one refitted against its own objective. On cyan the forward table errs by +0.206; an inverse filled from the press by -0.317; one inverted from the ordinary table by -0.554, because it inherits the forward table's error on top of its own; one inverted from the refitted table by -0.367; and one refitted in its own right by -0.002.

The inverse table errs dark

A profile's forward table predicts a print lighter than the press makes, and refitting its nodes removes the bias. The table a colour engine actually uses to separate an image is the other one — the inverse, from colour to ink — and it errs the opposite way: filled exactly from the press it asks for too much ink and prints dark, and built by inverting the ordinary forward table it prints darker still. Inverting the refitted forward table removes the inherited part and leaves the inverse's own. The round trip through both tables improves only when each is refitted against its own error, and then the two are no longer each other's inverse.

applied · Delivery
Three uniform spaces, three answers: red to blue. The gradient from above, in the a and b plane: CIELAB's straight line, and the shortest paths under ΔE₀₀'s local metric, under CAM16-UCS's and under Oklab's, whose shortest path is its own straight line carried back into CIELAB. They bow from CIELAB's line by 14.4, 42.5 and 42.6 units. ΔE₀₀'s and CAM16-UCS's paths run 28.3 apart at their furthest, Oklab's runs 29.0 from ΔE₀₀'s and 5.6 from CAM16-UCS's, and the space furthest from the other two here is ΔE₀₀.

A third space breaks the tie only once

ΔE₀₀ and CAM16-UCS disagree about which colours lie between two colours. Oklab was the obvious tie-breaker, and it breaks the tie on one gradient of five: on red to blue its path runs within six CIELAB units of CAM16-UCS's and twenty-nine from ΔE₀₀'s. On red to green and cyan to magenta it keeps to CIELAB's straight line while both others bow, and on blue to yellow it bows further than either. Each of the three spaces is the odd one out somewhere. Asking also exposed a CAM16-UCS path that had never converged.

matching · Gamut
Six starts for every held gradient, and where each one lands. Each row is one gradient held inside a gamut, relaxed from six starts: the straight line, the free shortest path, and the straight line bent towards and away from the neutral axis and up and down in lightness. Each dot is how much longer than the free shortest path that start's result is, on a logarithmic scale from a hundredth of a per cent to a thousand; the ring marks the best. The first 10 rows are gradients between colours on a coated CMYK press's boundary whose straight line leaves the press: their best routes cost a median of 0.12% and at most 1.1%, and on 5 of them some start lands at more than twice the free length. The next 3 are the display gradients held inside sRGB, whose best cost at most 1.3% and whose starts spread by at most 4.2%. The last 6 are press gradients that never leave, where no start is trapped.

A press makes the cheap route a search

Holding a gradient inside a display's gamut cost nothing measurable, and the essay that found it credited the gamut's convexity. A press's gamut is not convex: 216 of 630 straight lines between colours on its own hue ring leave it. Holding gradients inside the press still costs little at best, a median of a tenth of a per cent. But the best route depends on where the relaxation starts, the free path is the best start on one gradient of ten, and on half of them some start is trapped at more than twice the free length. On the display no start is trapped.

matching · Gamut
A four-ink inverse table's error along the grey axis, 9 nodes, black from L* 60. The colour difference between a grey asked for and the grey printed, from L 92 to 14, for a 9-node inverse table whose separation strategy begins black generation at L 60 (dashed line). Three tables: filled exactly from the strategy, mean 0.073; refitted with each node sliding along the strategy, 0.050; refitted freely, 0.036. To the left of the dashed line the strategy-bound refit lies close to the filled table; to the right it lies close to the free refit. Every table is exact at its nodes, marked on the axis.

A strategy keeps the refit only where black prints

Refitting an inverse table's nodes against their own error halves it, and in a four-ink table the refit has to leave the separation strategy's choice of black alone. Held to the strategy, it keeps the whole of its gain wherever the strategy prints black and almost none of it where the strategy does not — and the share it keeps equals the share of the grey ramp printed with black, to within three hundredths. The start of black generation, predicted to be where the refit would fail, is where the table needs it least.

applied · Delivery

Named alongside it

The objects these essays reach for when they reach for this one.

SpecificationColour managementColour differenceGradientAliasingCIEDE2000CIELABThe ICC profileMeasurement errorCalibrationSamplingTransfer function

All concepts