Concept

Aliasing — where it appears

What happens when something is sampled too coarsely to carry its own detail: the detail does not vanish, it reappears as something coarser. It is why a sampling grid has to be chosen against the content rather than against the display, and why the repair is a filter rather than more samples.

Named by 17 essays across 5 fields — each of them below, with the objects they name alongside it.

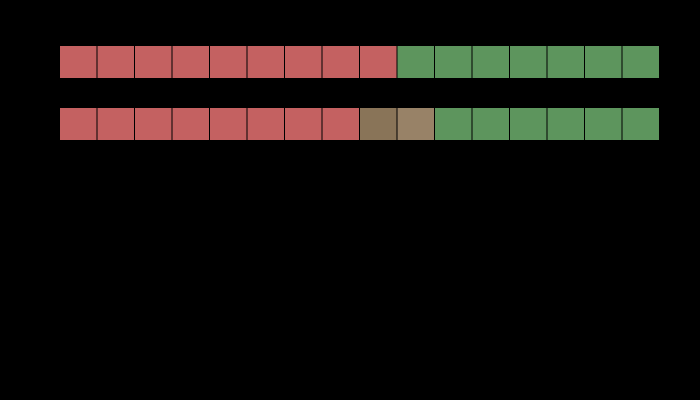
A grey edge, reconstructed from a Bayer row, arrives coloured. Above: an achromatic step through 24 sensor sites, with green sampled on the even ones and red on the odd. Interpolating each channel separately reconstructs them from data taken on either side of the edge, so their ratio moves. Below: the resulting chroma, peaking at 144 per cent of the local mean, and 112 per cent once colour differences are interpolated instead.

A grey edge arrives coloured

A sensor site measures one channel and the other two are interpolated from neighbours that sat somewhere else. Across a black-and-white step that reconstruction gives an achromatic scene a chroma of 144 per cent of its own local mean, and nothing in the scene or the sensor was coloured.
imaging · Capture
An edge at 4:2:2, and the colour it arrives as. Above, the row as it was sent and as it arrives after the two chroma planes are averaged 2 samples at a time. Below, the colour difference at each sample. The worst is ΔE00 = 25.88, at a luma step of 0.058 across the edge — an edge of nearly equal luminance. Nothing is wrong with the codec: it discards the differences the eye resolves worst, and this edge is made of nothing else.

Colour thrown away on purpose

Every video format in use discards three quarters of its colour information and keeps all of its luminance, because the eye resolves fine colour detail badly. On an edge that carries luminance the loss is exactly zero. On an edge of nearly equal luminance it is a colour difference of forty-three, and the two edges are the same edge to the codec.

applied · Delivery
How fine a screen each channel can see. A halftone screen at 35 per cent coverage, 45 degrees, seen by each of the eye's three spatial channels. The bar is the ruling at which it drops below that channel's own threshold. The luminance channel is still seeing it at 55 cycles per degree; the two chromatic ones have lost it by 15 and 10. The dashed line is an ordinary press ruling at reading distance, and only one channel is above it. A halftone is a luminance object, which is why the ink whose dots are nearly the lightness of the paper is the one nobody worries about.

A halftone is a luminance object

The eye's three spatial channels resolve a screen at 55, 15 and 10 cycles per degree, so at any ruling a press actually runs only one of them can see it at all. The corollary corrects a guess already published here — rotating a screen matters more to the chromatic channels, not less — but only at rulings so coarse that nobody prints there.

difference · Metric
The same flicker, written across the frame. A rolling shutter exposes each row of the sensor at a different moment, so a lamp that flickers above fusion is recorded as bands. There are 1.7 of them here — the readout time times the lamp's frequency, which is a camera setting and not a property of the light — spanning 2.37 stops. Held at matched luminance the lightest band and the darkest are still ΔE00 5.40 apart in colour, because the two drive currents are two spectra and the shutter caught one of each.

The shutter samples the lamp

A lamp switched between two drive currents at a hundred hertz is one steady colour to a person and two spectra to a camera. A thousandth-of-a-second exposure catches whichever phase the shutter opened at — two and a third stops of exposure and five units of colour, decided by nothing but timing — and a rolling shutter writes the difference across the frame as bands.

imaging · Capture
The census as the surfaces stop being three-dimensional. A slope chart with three columns — a test set with no fourth reflectance dimension, one with a fourth dimension at ten per cent amplitude, and one at twenty — and a line per change of light. Almost every line rises: a surface with structure the observer's three channels cannot follow is a surface an adaptation gain handles worse. Two lines are drawn heavy. daylight to a three-primary display rises fastest, by 90 per cent, because a source made of three narrow lines is precisely the instrument that cannot see a fourth reflectance dimension. And daylight to a triphosphor tube falls — the only row that does — because a triphosphor tube already samples the spectrum at three places, so extra structure in the surface is partly averaged away rather than added. The order of the middle of the table is not the same at the two ends; the extremes do not move.

The row a fourth dimension improves

Giving the test surfaces one more degree of freedom makes almost every change of light harder for an adapted observer — but not all of them, and which one it helps depends entirely on what the extra dimension looks like. A triphosphor tube is improved by one shape and hurt more than anything else in the census by another.

light · Light
a fluorescent tube, mercury lines on a phosphor bed, with a 5-nanometre grid marked on it. The light drawn at a fifth of a nanometre, with the 5-nanometre tabulation points marked beneath. 38 of the 53 points carry more than a twentieth of the peak. What a summation over those points computes is not an approximation to the area under this curve; on a spectrum with features narrower than the spacing it is a different quantity, and the difference depends on where the points fall rather than on how many there are.

The index is a choice too

Every colour in this collection is a sum over eighty-one numbers running from 380 to 780 nanometres in steps of five. That index is not a property of the eye, the light or the sample — it is a tabulation, and it holds three separable decisions that behave completely differently from one another.

light · Light
What an instrument's slit width does to a tabulated colour. The horizontal axis is the full width of a triangular slit, from zero — perfect point sampling — to twenty nanometres; the vertical is the distance from the true colour, logarithmic. For a smooth light the lines are flat: a slit narrower than any feature changes nothing. For a line spectrum they fall off a cliff at the left. Point-sampling a mercury line at five nanometres costs 1.26 ΔE₀₀ and integrating the same spectrum through a five-nanometre slit costs 0.014. A spectrometer does not sample a spectrum; it integrates one, and the blur everybody would remove if they could is what makes a five-nanometre table safe.

The slit is what makes it legal

Point-sampling a mercury line at five nanometres costs a colour difference of one unit, and a laser projector thirty-seven. Integrating the same spectrum through the five-nanometre slit every spectrometer already has costs 0.014 and 0.19. The blur anybody would remove if they could is what makes a coarse table honest.

light · Light
How much the answer moves when the 5-nanometre grid is slid through one cell. Each bar is the spread of one light's colour across five grid origins, all at the same 5-nanometre step, in ΔE₀₀. A smooth light barely moves, and what movement it has is the end cells rather than the sampling. The fluorescent tube moves by 3.18 units and the laser projector by 35.0, because their emission lines are narrower than the step and whether a sample lands on one is a coincidence of arithmetic. This is the measurement that separates a quadrature error from an aliasing error, and no average over origins can substitute for it.

Where the grid starts

Holding the step at five nanometres and sliding the grid's origin through one cell moves a fluorescent tube's computed colour by 3.18 ΔE₀₀ and a laser projector's by 35.0. Refining the step does not fix it and averaging over origins hides it. It is the one tabulation fault with no smooth error to cancel against.

light · Light
The two tabulation choices over forty-two surfaces, under a 6500 K thermal radiator. Each column is one choice, measured over a family of forty-two analytic reflectances rather than on a single example: an absorption band of stated centre, width and depth. The four marks are the smallest, the median, the ninety-fifth percentile and the largest cost in ΔE₀₀, logarithmically. Under a smooth light the range is worth 9.1 times the step at the median, so a collection wanting one repair should widen its range rather than refine its step — and under a fluorescent tube the ranking reverses outright.

Which end to buy

Refining a five-nanometre grid to one buys a daylight calculation 0.05 ΔE₀₀ and widening its range buys 0.54. Under a fluorescent tube the same two purchases are worth 0.83 and 0.0001. The ranking reverses completely, and what decides it is one length compared against one other length.

light · Light
What a tabulation step costs, by light, on paper. The horizontal axis is the tabulation step in nanometres, from one to twenty; the vertical is how far the resulting colour is from the same integral taken at a tenth of a nanometre over the same range, in ΔE₀₀, on a logarithmic scale. Each line is one light. The three with no feature narrower than the step fall smoothly and stay below a tenth of a unit at five nanometres, which is the grid used throughout. The fluorescent tube and the laser projector do not fall at all: their lines are narrower than any step drawn here, so the answer depends on where the samples land rather than on how many there are. The sample is held at paper throughout.

A grid is not a resolution

Ten essays into this collection there is one sentence about wavelength sampling, and it is that five nanometres is enough. Ten measurements later there are three decisions, three mechanisms, three repairs and two rankings, and the word resolution names none of them.

light · Light
What this collection's grid does to its own observer audit. Two bars per light: the mean departure of the observer computed on this collection's five-nanometre grid, and the same computation on a quarter-nanometre one. For five of the six lights the two agree to two decimal places, which is what a well-sampled spectrum looks like. For the laser projector the coarse answer is exactly zero and the fine one is 2.34 — the largest in the table. On a five-nanometre grid a three-line spectrum with lines at 465, 532 and 638 nanometres is a one-line spectrum, and a single wavelength is a stimulus every observer agrees about to the last bit. The two departures do not compound here; the first conceals the second.

The grid hid the observer

On this collection's five-nanometre grid a three-laser projector's observer disagreement is exactly zero. On a quarter-nanometre grid it is 2.34 ΔE₀₀ and the largest in the table. The two audits of this round meet here, and the first one does not compound with the second — it removes it.

limits · Limits
One edge magnified four times, three ways: text on a page. A step between the two colours of text on a page, magnified four times by linear interpolation, by bicubic and by a three-lobe Lanczos kernel, once on the stored values and once on the light. The curves are the stored-value result's lightness minus the light's, sample by sample across the edge; below the line the stored-value resize is darker. Linear interpolation is darker everywhere it differs. The two kernels with negative lobes swing above the line beside the edge, where their negative weights fall — bicubic by up to 1.8 colour differences and Lanczos by 3.7.

A resize with a negative weight in it

A blend taken on stored values is always darker than the blend of the light, because the encoding is concave and a convex combination of a concave function's values lies below the function of the combination. A bicubic or Lanczos resize is not a convex combination. Beside an edge its negative weights make the stored-value result lighter than the light's own — by up to 6.1 colour differences with bicubic and 12.2 with Lanczos on skin against its shadow — and on edges between full-scale values the clip hides the overshoot and the old guarantee appears to hold.

applied · Delivery
A 2-nanometre notch, and what two five-nanometre grids record of it. The reflectance of a sample with a 2-nanometre notch at 552.3 nm, drawn finely from 535 to 570 nm. The dark ticks are the samples of a five-nanometre grid starting at 380 nm and the pale ticks those of the same grid started half a step later. The true minimum is 0.06; the first grid's deepest sample reads 0.70 and the second's 0.08. The sample has put a line into a calculation whose light has none.

The line can be in the sample

The rule for which tabulation defect to fix compares the light's narrowest feature with the grid's step, and it named its own failure case — a sample with structure narrower than the step. Given one, a two-nanometre notch under a thermal source with no feature at all costs 2.1 colour differences at five nanometres and moves 2.0 when the grid slides, which is what a fluorescent tube costs on a smooth pigment. Under that tube a notch twelve nanometres wide, more than twice the step, moves 8.1 when it sits on the mercury line.

light · Light
What a five-nanometre grid costs a steep-sided notch, against its width, under a 6500 K source. The cost of a five-nanometre grid starting at 380 nm, against a reference at two hundredths of a nanometre, for a sample with a flat-bottomed notch at 552.3 nm under a 6500 K thermal radiator, against the notch's width from 2 to 30 nm, for edges rising in 0.4, 2.2, 6.6 nm. With the steepest edges the cost is 0.02 at 10 nm, 1.99 at 12.5 and 0.03 at 20: it rises and falls with the step as its period and does not die away as the notch widens. With the softest edges it stays under 0.10 at every width.

The cost of a steep notch repeats every step

A Gaussian notch is safe on a five-nanometre grid once it is a couple of steps wide. A flat-bottomed notch with steep sides never is. Its cost on the grid rises and falls with its width, with the step as its period — 0.02 colour differences at ten nanometres, 1.99 at twelve and a half, 0.03 at twenty — and it does not die away as the notch widens. What sets its size is how fast the edges rise, and an interference filter's edges rise in under a nanometre.

light · Light
A 12-nanometre notch at 546.1 nm under a fluorescent tube, tabulated five ways. The cost against a tenth-nanometre reference, on a five-nanometre grid, of a notched sample under a fluorescent tube, mercury lines on a phosphor bed, when the two factors of the colour are tabulated as points, when the lamp alone is measured through a five-nanometre slit, when the sample alone is, when each is measured through its own slit, and when the light the sample reflects is measured through one slit. The costs are 2.535 for both sampled at points, 0.379 for the lamp through a slit, 2.724 for the sample through a slit, 0.727 for both through their own slits, 0.019 for the product through one slit. The tick on the two-slit bar is the same two tables summed at a tenth of a nanometre, 0.749: what the separate slits leave is not the grid's.

Two slits are not one slit

A spectrometer's slit is what makes a coarse table honest, for a lamp and for a notched sample alike. But a colour is a sum over the product of the two, and a notch measured through one slit and a lamp measured through another are not the product measured through a slit. Under a smooth light the difference is nothing. Under a fluorescent tube a notch on the mercury line comes out 0.73 colour differences off from two slits — worse than no slit at all for some notches — and 0.02 off from one slit on the reflected light.

light · Light
The corner of a patch of skin against its own shadow, magnified four times by Lanczos, three lobes. A map of the neighbourhood of one corner of a square patch — the patch fills the lower right, the field the rest — once it has been magnified four times by Lanczos, three lobes. Each cell is shaded by how much lighter (warm) or darker (cool) the stored-value result is than the light's, the deepest shade 18.2 units of lightness. Within three source pixels of the corner the stored-value result is up to 14.5 colour differences lighter, 14.5 outside the patch against 3.1 inside it, and up to 7.3 darker.

The corner of a resized patch is lighter than its edges

A resize taken on stored values is darker than the resize of the light wherever its weights are positive, and lighter beside an edge where a kernel's negative lobes fall. In two dimensions the kernel is a product, and just outside a patch's corner a Lanczos magnification of skin against its shadow comes out 14.5 colour differences lighter — more than along either edge. A reduction to a quarter is mostly an average and errs lighter by at most two. And an unsharp mask, whose negative weights are its whole purpose, is lighter on the stored values at every amount on every pair, and never darker.

applied · Delivery
An interference notch filter, and where a five-nanometre grid lands on it. The transmittance of a Fabry-Pérot etalon of order 24 and finesse 20, drawn at a fifth of a nanometre, with the standard grid's points marked. Its features are 2.29 nanometres wide and spaced 22.9 apart, so the grid steps over them: between two adjacent grid points the transmittance rises and falls completely, and neither point records it. That is what a real coating looks like, and a Gaussian notch — which is what this collection's earlier work used — is a much gentler object.

A finer table is a worse table

A real interference filter is not a Gaussian notch. It is an etalon, with pass bands a nanometre or two wide spaced twenty-three apart, and a five-nanometre grid steps over them. Resampled from the maker's one-nanometre table its colour is out by five colour differences under every fill-in rule — the three rules agree to three decimals, because none of them is ever handed a sample inside a feature. The same filter measured through a five-nanometre slit is out by 0.03.

light · Light

Named alongside it

The objects these essays reach for when they reach for this one.

Wavelength gridSamplingMeasurement errorQuadratureSpectral structureInterpolationSpecificationAuditIntegrationSpatial frequencyTest setTransmittance

All concepts