Concept

Measurement error — where it appears

The gap between what an instrument reports and what is in front of it, which is a property of the instrument as much as of the sample. Its two halves behave differently: a bias repeats and can be corrected, and a random error does not and cannot.

Named by 49 essays across 9 fields — each of them below, with the objects they name alongside it.

A 20 nm bandpass, and what it does to the sample. The true reflectance, the same reflectance as a 20 nm instrument reporting every 20 nm returns it, and the slit function responsible, drawn at its own scale around 550 nm. The reconstruction is what every calculation downstream will use, and it differs from the truth by ΔE 2.97 under D65. Nothing in the file the instrument writes marks which values were measured and which were interpolated.

What the instrument reports

A spectrophotometer sees a sample through a slit of finite width, at a finite number of wavelengths. What it writes down is the truth convolved with its own bandpass, and nothing in the file says which values were measured and which were invented.
matching · Gamut
Two mechanisms, one ramp, and the patch that separates them. A cyan ramp printed by a press with 10 per cent mechanical gain and a Yule–Nielsen exponent of 2.4. Fitting a mechanical gain at n = 1.0 gives 23 per cent and fitting one at n = 2.4 gives 10 per cent; both reproduce the ramp to under 0.66 of a lightness unit, and the curves lie on top of one another. The two-ink overprint below was in neither fit, and there they are ΔE00 = 3.20 apart.

A dot is larger than it was asked to be

Two quite different things make a printed midtone darker than its coverage says — ink spreading under pressure, and light scattering sideways inside the paper. Both bend the tone curve the same way and neither touches its ends, so the measurement every press is characterised by cannot say which happened. A patch that nobody measures can.

applied · Delivery
What a coarse wavelength grid costs, by source. Colour error against grid size, for four sources through one reflectance. Daylight survives every grid tested: 0.67 ΔE00 even at 40 nm. A source with lines in it does not — the narrowband source reaches 16.2. The grid is not a property of the arithmetic; it is a claim about what the light has in it.

Five nanometres is a choice

Every integral here is taken in five-nanometre steps, and the interval has never had to be defended. Coarsening it to twenty costs daylight two hundredths of a colour difference and a fluorescent tube six and a half — and which way of coarsening is used decides a further factor of six.

matching · Gamut
One tolerance decision, at four spectral distances. Every column is a pair of samples ΔE00 1.0 apart for the observer a colorimeter models — solved to that value by bisection, so the instrument would report the same number for all four. What differs is how far apart the two spectra are, which is achieved by adding a metameric black the reference observer cannot see. The bands are what two hundred people report: from 1.13 at the ninety-fifth percentile when the spectra are the same shape to 2.32 when they are not, and the worst case reaches 3.7. No specification records the quantity on the horizontal axis.

A tolerance is a probability

A colorimeter reports one number and a specification compares it with another, and both are computed for an observer who does not exist. Handed to two hundred people, the same pair at ΔE00 1.0 is read from 0.8 to 3.7 — and which of those two ranges applies depends on something no specification records.

difference · Metric
The three constants a specification does not quote. ΔE2000 is defined with three parametric factors in it — kL, kC and kH — which the CIE leaves to the industry using the formula rather than fixing. Graphic arts uses ones throughout; the textile standard weighs lightness at half, which is kL = 2. Applied to 4000 pairs at a tolerance of 1, the two settings accept 46 and 75 per cent, and 29 per cent of pairs change verdict — a larger disagreement than any between the formulae themselves. The reference conditions the ones assume are diffuse illumination at 1000 lux, a mid-grey surround, samples abutting, subtending over four degrees, differing by under five units, with no visible texture.

Three constants nobody quotes

CIEDE2000 is defined with three parametric factors in it, the CIE leaves them to the industry using the formula, and the two settings in ordinary use differ by a factor of two in one of them. Twenty-nine per cent of acceptance decisions change between the two — a larger disagreement than any between the formulae themselves.

difference · Metric
Which of two reproductions is better depends on which statistic is asked. A specification for a proof or a print run is written against a set and has to reduce the set to one number. Here are two candidates: the one with the lower mean has the higher ninety-fifth percentile, so the mean prefers A and the tail prefers B. Across 2000 pairs of candidates generated the same way, the two statistics disagree about the winner 30 per cent of the time. Both numbers are honest; only one of them is what somebody notices.

A mean is not a difference

A specification for a proof, a profile or a print run is written against a set of colours and has to reduce that set to one number. The mean and the ninety-fifth percentile disagree about which of two reproductions is better in thirty per cent of cases, and both numbers are honest.

difference · Metric
Every filtered claim in these essays, read at a point and read as components. Each row is a comparison one of the essays makes. The bar is the ratio between the two readings — how many times larger the component answer is than the point answer, or the reverse — on a logarithmic scale. 5 of 7 disagree by more than half again, and 4 disagree about the direction of the effect rather than merely its size. The three marked as noisy are the ones with a noise field on one side of the comparison, and they are the three largest.

The list nobody made

The last phase found that reading a filtered signal at a point asks a question its thresholds were never fitted to, made it a standing rule, and admitted that nobody had gone back through the site to see which claims it touched. Here is the list. Every claim with noise on one side of it moves — and so do two that have no noise in them at all, which the rule said would not.

limits · Limits
A lamp switched on, and what it is still doing minutes later. The junction warms from ambient to 80 °C with a time constant of 150 seconds, and three quoted slopes act as it does: the die's peak moves, the die loses efficiency, and the converter loses quantum yield. The output falls 25 per cent and the colour moves ΔE00 2.6. Nine tenths of the way takes 405 seconds. The vertical mark is the eye's own slow adaptation constant, 60 seconds, for scale.

A lamp switched on is not the lamp measured

A luminaire takes about seven minutes to reach nine tenths of its working temperature, loses a quarter of its output on the way, and moves ΔE00 2.6 while it does. That is slower than every clock in the eye — so for the first minutes after a switch is thrown, both ends of the measurement are moving, and every appearance claim here has assumed one of them was still.
light · Light
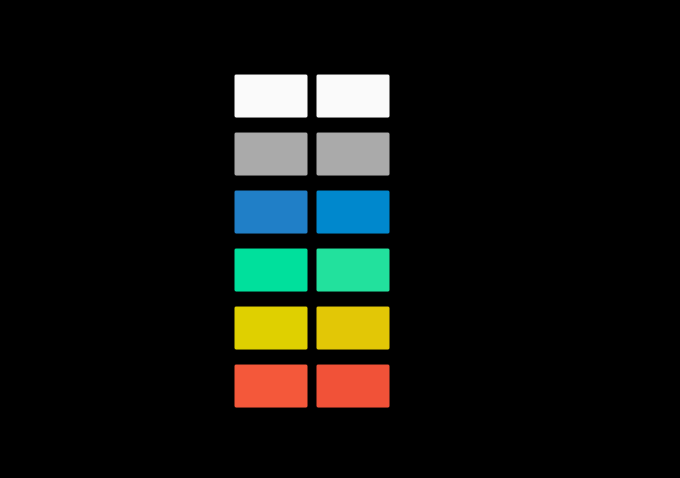
What the same eye reports about one field, in the middle and at the edge. Each row is a uniform field, drawn at the most saturated version of itself this page can show — the percentage is how much of the full stimulus survived, the rest being the adapting light added to bring it inside the gamut. The left patch is what the centre of gaze reports and the right one what 10 degrees out reports, each adapted to the same light as that position sees it. The adapting white comes out identical to 5e-13, because an adapted eye cancels its own filter exactly. Nothing else does, and the largest difference is in the blue. tungsten light is not drawn: it cannot be shown at any useful saturation, and at full strength it differs by ΔE00 1.87.

One person is two observers

The macular pigment is a yellow screen over the fovea and nowhere else, so a cone at the centre of gaze and a cone ten degrees away have different colour-matching functions in the same eye. A match made in the middle comes apart at the edge by six units — and fitting one filter to the gap between the CIE's two standard observers gives a density of 0.40 against a measured 0.35.

eye · Cones
The same flicker, written across the frame. A rolling shutter exposes each row of the sensor at a different moment, so a lamp that flickers above fusion is recorded as bands. There are 1.7 of them here — the readout time times the lamp's frequency, which is a camera setting and not a property of the light — spanning 2.37 stops. Held at matched luminance the lightest band and the darkest are still ΔE00 5.40 apart in colour, because the two drive currents are two spectra and the shutter caught one of each.

The shutter samples the lamp

A lamp switched between two drive currents at a hundred hertz is one steady colour to a person and two spectra to a camera. A thousandth-of-a-second exposure catches whichever phase the shutter opened at — two and a third stops of exposure and five units of colour, decided by nothing but timing — and a rolling shutter writes the difference across the frame as bands.

imaging · Capture
A viewing booth is a lamp, and a lamp has an angle. The same sample at five positions across a booth's plane, with the lamp 55 centimetres above it. The curve is how far each position is from the middle, in the units the judgement is made in. It reaches ΔE00 2.40 against a tolerance of 1, while the illuminance uniformity — the quantity the standard actually bounds — never falls below 73 per cent and stays comfortably inside it. The flat trace is the same booth with a source whose converter is the same thickness in every direction: ΔE00 0e+0, exactly, by construction.

The booth is a luminaire

A standard viewing booth is specified by its light's chromaticity, its rendering and the uniformity of its illuminance across the sample plane. Illuminance is a photometric integral, so two positions can be inside the uniformity tolerance and lit by two different spectra — and a sample at the far corner of a compliant booth is ΔE00 2.4 from one in the middle, against a tolerance of one.

applied · Delivery
Every claim here that was computed with one model, recomputed with two. Each row is a claim one of these essays makes. The bar is how many times the two-model answer differs from the one-model answer, on a logarithmic scale. 3 of 13 have no bar at all: the first model's answer for them is exactly zero, not because it computed zero but because it has no variable for the quantity. Those are the rows where a second model did not correct an answer — it supplied one.

What a second model changed

Thirteen claims here, each computed with one model and recomputed with two. Ten of them move by half again or more. Three of them do not move at all in the ordinary sense — the first model's answer is exactly zero, not because it computed zero but because it has no variable for the quantity — and every one of those three is a join that supplied a state or a device rather than a spread.

limits · Limits
The same twenty-four samples, measured two standard ways. How far apart a 45°/0° instrument and a sphere with its gloss port closed are, on samples running from three per cent reflectance to seventy. The whole of the difference is the interface reflection — four per cent of the light, returned without ever meeting a pigment, thrown away by one geometry and collected by the other. It is the same four points in every row, which is why the disagreement is a property of how dark the sample is rather than of what colour it is: ΔE00 8.7 on the darkest samples against 1.93 on the lightest.

An instrument has a geometry

Every reflectance here arrives through a model with a bandpass, a sampling interval and no position at all. Real instruments say where they were standing, and the two standard answers disagree by ΔE00 8.35 on a dark gloss sample — a difference that adds rather than multiplies, and that no adaptation removes.

matching · Gamut
A sample with two reflectance curves, and neither below one. The apparent reflectance of an optically brightened sample, measured under D65 and A. It exceeds 1 — the shaded band — which no reflector can do: more light leaves at these wavelengths than arrives at them, because the sample absorbs in the violet and re-emits in the blue. And the two curves differ, so the sample has no single reflectance to store. The effect drawn here is a floor: most of the excitation band lies below 380 nm, outside the range computed here.

A surface that is not a multiplication

Every argument here about what light does to a surface begins by multiplying two spectra together. A surface with a brightener in it takes light at one wavelength and returns it at another, so it is a full operator rather than a diagonal one — and it does not have a reflectance at all.

scene · Scene
An instrument, as the only thing it really is. The 3 filters a bank of that size puts across the visible range, each drawn against wavelength. Everything the instrument can report about a spectrum is 3 numbers — the integral of the light against each of these — so the set of spectra it cannot tell apart is everything orthogonal to all 3 of them, which is 78 dimensions of the 81 this site works in. Three of these is a colorimeter in spirit; the eye is three of them too.

Three numbers cannot see a line

An instrument that returns three filtered readings of a spectrum determines a three-dimensional projection of it and is exactly blind to the other seventy-eight. On daylight that costs almost nothing; on a fluorescent tube, three quarters of the lamp lies in the part no reading reaches, and adding filters recovers it slowly.

light · Light
The colour is right long before the spectrum is. The colour error of the projection, against the number of readings. At twelve readings the fluorescent tube's colour is right to 0.48 ΔE00 while 66% of its spectrum is still unmeasured. That is the trap in one line: a reconstruction good enough to pass any colorimetric check will predict a match under a second illuminant that does not happen, because the part it got wrong is exactly the part a different lamp weights differently.

The colour is right first

A reconstruction of a lamp from twelve filtered readings gets its colour right to half a unit while two thirds of its spectrum is still unmeasured. That combination is not a partial success — it is the exact condition under which a spectral prediction made from the reconstruction will be confidently wrong.

light · Light
What the next thousand patches buy a printer profile. A profile is a table, exact at its nodes and interpolated everywhere else. Each mark is a grid: the horizontal axis is how many patches somebody had to print and measure, the vertical is the worst error found between the nodes. Going from 135 patches to 3645 — 27.0× the work — buys 8.4× the accuracy. The error falls with the square of the spacing and the count rises with its cube.

A profile is a fit between its nodes

A printer profile is a table, exact at every patch that was printed and interpolated everywhere else — and everywhere else is where every job lives. Going from a hundred and thirty-five patches to three and a half thousand is twenty-seven times the work for eight times the accuracy, and the exponents say that is as good as it gets.

applied · Delivery
Four cameras that all satisfy the Luther condition exactly. Four sensors whose sensitivities are linear combinations of the colour-matching functions — the theoretical ideal, satisfying the condition to machine precision, each with an adaptation basis that does not move when the light does. They differ only in which linear combination, which the condition does not constrain, and they leave 2.46, 0.97, 1.65, 2.37 ΔE00 after a white balance. The best of them reaches 0.974, which is the best any basis at all achieves. Being a perfect colorimeter costs nothing in adaptation; what costs is the mixing matrix, and the control measured here carries one nobody chose.

The condition chooses no axes

It has long been said here that a sensor satisfying the Luther condition exactly adapts worse than a silicon one, and offered a reason — that its channels are the matching functions, and a gain on those is the oldest mistake in the subject. The measurement was of one sensor. The condition leaves the axes entirely free.

imaging · Capture
The same optimum, along its narrowest direction and its widest. The adaptation objective along two straight lines through its own minimum, both of unit length in the nine coefficients. Along one of them the cost rises steeply; along the other the same step costs 8.0 times less, and a design constrained to move that way gives up almost nothing. That is why restricting the nine numbers to be the inverse of three realisable primaries — three degrees of freedom gone — costs about one per cent, while requiring them to hit the three dichromat confusion points costs seventy. Counting what a constraint removes predicts neither number; what matters is which way it points.

A constraint costs what it points at

Three primary chromaticities remove three of the nine numbers in an adaptation basis and cost one per cent. Three dichromat confusion points remove six and cost seventy. Counting what a constraint removes predicts neither, because an optimum is a long bowl and what matters is which way the constraint points.

limits · Limits
How far each census row moves when the test set's own description does. A grid of bars, one row per change of light in the census and one bar in each row per number that describes the region the test surfaces are drawn from: how saturated they are, how bright, and how far the two modulations may go together. A bar's length is the elasticity — the proportional change in the published residual for a proportional change in that number. Saturation runs from 0.49 to 0.91 and brightness averages 0.104, so a test set's chroma range is nearly everything and its lightness range is nearly nothing. For scale, the largest elasticity found anywhere among this collection's five declared population widths is about a half — and those at least have declared ranges, while these three numbers have never been quoted with one.

The input nobody declared

An audit that swept every declared width in this collection found the largest elasticity anywhere to be about a half. The most elastic input turns out to be one that was never declared, never quoted with a range and never varied — and being undeclared is exactly why it escaped the audit that was looking for it.

limits · Limits
The same claim in nanometres of pigment, where no declared width can reach it. Five horizontal bars on a scale of nanometres, one per published chromatic-adaptation transform, each showing how far the medium-wave cone pigment's absorption peak would have to move for the receptors' own protan confusion point to land where that transform puts it. Zero is the measured peak. The bars run from -10.5 to 18.2 nanometres — in both directions, so two of the transforms want the pigment shorter and two want it longer. Drawn across them is the 25 nm separation between the L and M pigment peaks, which is the whole basis of red-green vision and is not a number this collection declared. The nearest transform asks for a displacement of 30 per cent of that separation, and the span across the table is 28.7 nanometres — larger than the separation itself. No population, cloud or standard deviation appears anywhere in the statement.

The claim, in nanometres

For four rounds the claim here has been that every published adaptation transform puts the protanope's confusion point outside any real population of eyes, stated in standard deviations of a population whose widths were declared rather than measured. Restated as a pigment displacement it needs no population at all — and the nearest transform asks the medium-wave cone to move thirty per cent of the way to the long-wave one.

eye · Cones
The same claim in nanometres of pigment, where no declared width can reach it. Five horizontal bars on a scale of nanometres, one per published chromatic-adaptation transform, each showing how far the medium-wave cone pigment's absorption peak would have to move for the receptors' own protan confusion point to land where that transform puts it. Zero is the measured peak. The bars run from -10.5 to 18.2 nanometres — in both directions, so two of the transforms want the pigment shorter and two want it longer. Drawn across them is the 25 nm separation between the L and M pigment peaks, which is the whole basis of red-green vision and is not a number this collection declared. The nearest transform asks for a displacement of 30 per cent of that separation, and the span across the table is 28.7 nanometres — larger than the separation itself. No population, cloud or standard deviation appears anywhere in the statement.

Five transforms and the space between them

Every appearance prediction here chooses one of five published adaptation transforms, and the five disagree about where a protanope's confusion lines meet by more than the distance between the two pigments the disagreement is about. That spread is itself a scale, and using it needs no population model at all.

brain · Appearance
How far each census row moves when the test set's own description does. A grid of bars, one row per change of light in the census and one bar in each row per number that describes the region the test surfaces are drawn from: how saturated they are, how bright, and how far the two modulations may go together. A bar's length is the elasticity — the proportional change in the published residual for a proportional change in that number. Saturation runs from 0.49 to 0.91 and brightness averages 0.104, so a test set's chroma range is nearly everything and its lightness range is nearly nothing. For scale, the largest elasticity found anywhere among this collection's five declared population widths is about a half — and those at least have declared ranges, while these three numbers have never been quoted with one.

A chart decides what a camera scores

A camera profile's reported error changes by a factor of five when the test chart's saturation changes, with the camera and its matrix untouched. The elasticity is 0.67 — the same figure, to two per cent, that an entirely unrelated measurement over an entirely unrelated set of surfaces gives.

imaging · Capture
Every census row under five constructions of the same test set. A slope chart with 5 columns — lattice, coarse, fine, uniform, natural — and one line per change of light in the census, each line joining that row's mean residual under each construction. Four of the five columns describe the same region of surfaces walked at different densities or against different measures; the last is the clamped, realistic family, which is not linear in its parameters and is therefore answering a slightly different question. The levels move: between the coarse and fine lattices every row shifts by seven to nine per cent, in the same direction, which is a common-mode factor no published residual here has ever carried. The order almost survives. Inside the region exactly one pair crosses, and it is the pair the standard error had already flagged; under the clamped set two more cross, including one the error separates by nearly nine standard errors. The crossing lines are drawn heavy.

What the audit still cannot reach

Two rounds have now swept every declared width in this collection and one of its structural choices. Three structural choices remain, none of them has a multiplier to sweep, and the reason each resists is different — which makes the list a description of where this kind of audit ends rather than a queue of work.

limits · Limits
The share of a sample's reflectance an aperture recovers, by how wide it is. Six materials, and the fraction of each one's true reflectance that a measurement recovers through an aperture of the stated radius. The horizontal axis is logarithmic in millimetres; the vertical is a share, so 1.0 is the whole of it. The dashed line is a 8-millimetre radius, which is about what a hand-held spectrophotometer has. At that aperture coated paper reads 99 per cent of its own reflectance and candle wax reads 66. Every curve approaches one from below and none of them reaches it: the kernel's tail is what is being cut, and it falls as one over the aperture rather than exponentially.

Either disc can be the wide one

Every standard on translucent samples says to illuminate a larger area than is measured, and explains it by saying that light leaks out of the lit spot. That is true and it is not the reason, because the instruction works equally well the other way round — measuring a larger area than is lit gives a reading just as exact. The error is a product of two apertures and either one being wide kills it.

applied · Delivery
An aperture and a gloss lobe, apart and together. Six materials, each measured through a four-millimetre radius and each given a gloss lobe, alone and at the same time. The pale bar is what the two cost added together as if they were independent; the dark one is what they cost when both are present. Every material comes out below the sum, by between 0.8 and 3.6 ΔE₀₀. The two departures partly cancel: the aperture removes light that went into the material and came back out too far away, and the interface returns light that never went in at all. Measuring either one alone therefore overstates what both together do, which is the opposite of the way interacting errors are usually assumed to behave.

Two departures that partly cancel

A glossy translucent sample has two of this round's four departures at once, and the expectation was that they would compound. They do the opposite. An aperture takes light away that went into the material and came back too far out; an interface returns light that never went in at all — so measuring either alone overstates what both together do, on every material tested.

difference · Metric
The collection's adaptation census, with its surfaces departed. Each row is one of the fourteen changes of light in this site's adaptation census, and the bar is what a von Kries gain leaves behind. The open marks are the published numbers; the filled ones are the same computation with every one of the hundred and twenty-five test surfaces replaced by what an instrument with an aperture, or a room with a direction in it, actually reports. Nothing moves by more than 9 per cent. A departure that does not depend on the light is very largely absorbed by the observer's own gain, because it changes the reflectance and the gain is applied afterwards. The fourth departure is not on this chart and cannot be: a fluorescent sample has a different curve under every light, so there is no set of reflectances to hand the census at all.

The chart was measured, not photographed

A camera profile is fitted so that the camera's response maps onto the chart's tristimulus values, and those values came out of a spectrophotometer. So the profile's target carries the instrument's departures and the camera does not — a mildly translucent chart read through a four-millimetre aperture supplies targets 2.55 ΔE₀₀ from the truth, which is twice the profile's own fitting error.

imaging · Capture
What an instrument's slit width does to a tabulated colour. The horizontal axis is the full width of a triangular slit, from zero — perfect point sampling — to twenty nanometres; the vertical is the distance from the true colour, logarithmic. For a smooth light the lines are flat: a slit narrower than any feature changes nothing. For a line spectrum they fall off a cliff at the left. Point-sampling a mercury line at five nanometres costs 1.26 ΔE₀₀ and integrating the same spectrum through a five-nanometre slit costs 0.014. A spectrometer does not sample a spectrum; it integrates one, and the blur everybody would remove if they could is what makes a five-nanometre table safe.

The slit is what makes it legal

Point-sampling a mercury line at five nanometres costs a colour difference of one unit, and a laser projector thirty-seven. Integrating the same spectrum through the five-nanometre slit every spectrometer already has costs 0.014 and 0.19. The blur anybody would remove if they could is what makes a coarse table honest.

light · Light
What three fill-in rules cost when a five-nanometre table is read at one. A five-nanometre table read at one nanometre by three rules — hold the value, straight lines, a cubic through four points — each compared with the same tenth-nanometre reference. The dashed rule is the answer obtained by summing the table as it stands, at 0.00000 ΔE₀₀. Two of the three interpolations are worse than not interpolating. That is not a paradox: the summation's error is already small because the normaliser cancels most of it, and an interpolator introduces a shape the original curve did not have, which the cancellation cannot touch. A finer grid is not more resolution when the table is not finer.

A finer reading of a coarser table

Interpolating a five-nanometre spectrum to one nanometre helps a daylight calculation by a factor of five and harms a three-emitter LED by a factor of a hundred and twenty thousand. Both are the same operation on the same table, and which one happens is decided by a property of the light nobody records.

light · Light
How much the answer moves when the 5-nanometre grid is slid through one cell. Each bar is the spread of one light's colour across five grid origins, all at the same 5-nanometre step, in ΔE₀₀. A smooth light barely moves, and what movement it has is the end cells rather than the sampling. The fluorescent tube moves by 3.18 units and the laser projector by 35.0, because their emission lines are narrower than the step and whether a sample lands on one is a coincidence of arithmetic. This is the measurement that separates a quadrature error from an aliasing error, and no average over origins can substitute for it.

Where the grid starts

Holding the step at five nanometres and sliding the grid's origin through one cell moves a fluorescent tube's computed colour by 3.18 ΔE₀₀ and a laser projector's by 35.0. Refining the step does not fix it and averaging over origins hides it. It is the one tabulation fault with no smooth error to cancel against.

light · Light
What each end of the 380–780 nanometre range costs, by light. Two bars per light, on a logarithmic axis: the upper is what extending the range down to 300 nanometres moves the answer, the lower what extending it up to 830 does. The asymmetry is the whole figure. A thermal source has about a fifth of its power outside this collection's range and almost all of it at the long end, where the observer is already zero; what costs money is the short end, where the observer is small but not zero and daylight is still strong. A light with no ultraviolet — an LED lamp, a laser — pays nothing at either end, which is the pairing again: a range only costs what the light puts in it.

Two ends and one is empty

Extending this collection's wavelength range down to 300 nanometres moves a red pigment under daylight by 0.502 ΔE₀₀. Extending it up to 830 moves the same colour by 0.00015. A fifth of a thermal source's power lies outside the range and almost none of its colour does, and confusing those two shares is how a range gets argued about instead of measured.

light · Light
The two tabulation choices over forty-two surfaces, under a 6500 K thermal radiator. Each column is one choice, measured over a family of forty-two analytic reflectances rather than on a single example: an absorption band of stated centre, width and depth. The four marks are the smallest, the median, the ninety-fifth percentile and the largest cost in ΔE₀₀, logarithmically. Under a smooth light the range is worth 9.1 times the step at the median, so a collection wanting one repair should widen its range rather than refine its step — and under a fluorescent tube the ranking reverses outright.

Which end to buy

Refining a five-nanometre grid to one buys a daylight calculation 0.05 ΔE₀₀ and widening its range buys 0.54. Under a fluorescent tube the same two purchases are worth 0.83 and 0.0001. The ranking reverses completely, and what decides it is one length compared against one other length.

light · Light
What the normaliser cancels, per light. Two bars per light, logarithmic. The upper is the colour error a 5-nanometre sum makes when the white it is divided by is computed finely; the lower is the same sum divided by the white computed on the same coarse grid, which is what every colorimetric calculation actually does. The ratio is between 1.3 and 4.1. The grid appears twice in a tristimulus value and the two errors are the same error, so most of it divides out — which is why five nanometres has been good enough for a century without anybody having to be careful about it.

The normaliser carries the error too

A five-nanometre sum gets a red pigment's tristimulus value wrong by two hundredths of a per cent and its colour wrong by six hundredths of a unit. Those two numbers are not the same size because the grid appears twice in a colour — once in the sample and once in the white — and the two errors are largely the same error.

difference · Metric
The rectangle sum against the trapezoid sum, under a 6500 K thermal radiator. Colorimetry's summation is the rectangle rule at the tabulated points. The trapezoid rule differs from it by exactly one thing — half a cell at each end of the range — and the gap between these two lines is therefore that term and nothing else. At five nanometres it is a factor of 14.3, which means the number everybody calls a sampling error is mostly a truncation error wearing the step's clothes. On a light whose lines are narrower than the step the two rules agree to three decimal places, because there the error really is the sampling.

The endpoint term has a name

The five-nanometre error on a smooth light falls linearly with the step, which is not what a sampling error does. It is the half-cell at each end of a truncated range, it is first order where the sampling is second, and halving two weights removes fourteen fifteenths of it for nothing.

light · Light
What this collection's grid does to its own observer audit. Two bars per light: the mean departure of the observer computed on this collection's five-nanometre grid, and the same computation on a quarter-nanometre one. For five of the six lights the two agree to two decimal places, which is what a well-sampled spectrum looks like. For the laser projector the coarse answer is exactly zero and the fine one is 2.34 — the largest in the table. On a five-nanometre grid a three-line spectrum with lines at 465, 532 and 638 nanometres is a one-line spectrum, and a single wavelength is a stimulus every observer agrees about to the last bit. The two departures do not compound here; the first conceals the second.

The grid hid the observer

On this collection's five-nanometre grid a three-laser projector's observer disagreement is exactly zero. On a quarter-nanometre grid it is 2.34 ΔE₀₀ and the largest in the table. The two audits of this round meet here, and the first one does not compound with the second — it removes it.

limits · Limits
Where a point-sampled patch stops resolving a lobe. The horizontal axis is the wall's roughness, logarithmic; the vertical is how far the answer moves when the cone quadrature is refined from eight directions to sixteen, also logarithmic. A patch in a cube subtends a cone of angular radius 25.8° at the face opposite, and a microfacet lobe of roughness a is about a radians wide, so a lobe below about 0.15 is narrower than the quadrature that samples it. The movement at 0.05 is 21.2 ΔE₀₀ and at 0.3 it is 0.033. This is where the method stops, not where the paint does: matt, eggshell and satin finishes are inside it and a high-gloss varnish is not.

Where a patch stops being a point

A patch in a cube subtends a cone of 25.8° at the face opposite. A microfacet lobe of roughness 0.05 is about three degrees wide. Point-sampling the second inside the first returned a chroma of thirty-four thousand and a negative lightness, and the boundary between working and not working is measured rather than declared.

limits · Limits
The two tabulation choices over forty-two surfaces, under a 6500 K thermal radiator. Each column is one choice, measured over a family of forty-two analytic reflectances rather than on a single example: an absorption band of stated centre, width and depth. The four marks are the smallest, the median, the ninety-fifth percentile and the largest cost in ΔE₀₀, logarithmically. Under a smooth light the range is worth 9.1 times the step at the median, so a collection wanting one repair should widen its range rather than refine its step — and under a fluorescent tube the ranking reverses outright.

The grid under the census

The adaptation census is computed on eighty-one wavelengths from 380 to 780 nanometres. Under the daylight and blackbody sources it uses, the range is worth about half a colour difference on ordinary surfaces and the step about a twentieth — so the census carries a tabulation term as well as an observer one, and they are not the same size.

brain · Appearance
The pairing against the direct computation, for each departure that admits both. Each departure can be computed twice: directly, by taking the difference between the fuller model and the integral one, and as a pairing — an inner product of the sample's deviation with the light's. The bar is how far apart the two answers are, relative to the answer, on a logarithmic axis. The three directional rows agree to a part in a thousand billion, which is the arithmetic of one shared quadrature. The lateral row agrees to three parts in a hundred thousand, and the gap there is the radial quadrature rather than the identity: the two integrals are taken over different grids. The pairing is not an approximation to the departure. It is the departure, written so that its two factors are separate.

Three audits and one shape

The tabulation, the observer and the scene solver have nothing in common as subjects. Each turned out to hold a departure that is a pairing of two deviations, vanishes exactly when either is empty, and had been invisible because its parameter had no call site. Three subjects, one shape, and the shape is the round's result.

limits · Limits
What one tolerance accepts, around four colours. The surface in tristimulus values that ΔE₀₀ 1.0 draws around four colours, each outline scaled to its own size so the shapes can be compared. The volumes they enclose differ by a factor of 1.0e+5 across the sRGB cube, and the longest axis of one shell is between 3.3 and 29.9 times its shortest. A tolerance is written as one number and is a different set of samples at every colour it is applied to.

What one number accepts

A delivery tolerance is written as a single colour difference and it acts on three tristimulus values, so what it actually accepts is a closed surface. Measured over sixty-four colours in the sRGB cube, the volume inside that surface varies by a factor of a hundred thousand and its longest axis is between three and thirty times its shortest. The same contract, applied to a dark colour and a light one, is two different requirements.

matching · Gamut
What a code lattice costs, and where. Twelve thousand colours quantised to 8 bits per channel through the sRGB transfer function and read back, with lightness across the bottom and the colour difference the rounding cost up the side. The mean is 0.191 and the worst case is 1.15, a factor of 6.0. The bars are band means, and they rise: the encoding spends its codes in the shadows, so the top of the ramp is where the lattice is coarsest against a metric that does not compress as hard.

A lattice has no derivative

Every departure priced here was priced by perturbing something and reading the answer, which requires the thing being perturbed to have a derivative. A file written on a code lattice does not have one — its output is flat almost everywhere and jumps on a set of measure zero — so quantisation can be bounded and never propagated. The bound is 1.15 colour differences at eight bits per channel against a mean of 0.19, and it is worst where the encoding spends fewest codes.

matching · Gamut
Where the mosaic is filled in, along one row through an edge. A Bayer row across a step from 0.9 to 0.08, in units of the sensor's own ceiling, reconstructed in linear light and reconstructed after the tone curve, with the second undone so the two are compared at the same point in the chain. Away from the edge they agree to 8.3e-14, because a constant interpolates to itself under any curve. At the edge they differ by 5.78 colour differences. Interpolating encoded values pulls an edge towards its dark side.

One step has no choice

Four of a raw converter's operations can be arranged twenty-four ways. The reconstruction cannot be arranged at all — a colour matrix needs three numbers and a mosaic site has one, so filling in the mosaic is forced to the front by arithmetic rather than by convention. What is not forced is whether it happens in linear light or after the curve, and that decision costs 5.8 colour differences at an ordinary edge and nothing at all four sites away from it.

imaging · Capture
A stop taken in raw, and the same lightness reached afterwards. Each row is a stop of exposure applied to the raw values, against a gain applied after the whole pipeline and solved so that an eighteen per cent grey comes out at the same lightness. The two are then the same brightness by construction and differ by 4.2 colour differences at the mean and 11.1 at the worst patch. A stop is a scalar in front of the curve and is not a scalar behind it.

A stop is not a stop afterwards

Doubling the light is exactly a factor of two in raw values and in tristimulus values, which is the one thing about exposure everybody is sure of. A stop taken after the tone curve is a factor of something else, and matching the two on an eighteen per cent grey leaves the rest of the frame between three and four colour differences apart at the mean and up to eleven at the worst patch. The gain that matches one stop is 2.47 rather than 2.

imaging · Capture
What a stated lightness pins down, and where. A lightness quoted to 0.05 of a unit, inverted, and the luminance it fixes. Read as a fraction of the colour's own luminance the requirement is 0.90 per cent at J 10 and 0.097 at J 95, a factor of 9.3. Read in absolute luminance it is the other way round, by a factor of 6.5. Both readings are true and they answer different questions.

A stated lightness is two requirements

A specification quotes an appearance to a stated precision — a lightness to a tenth of a unit, say — and the same precision everywhere. Inverted, a twentieth of a unit of lightness fixes the luminance to nine tenths of one per cent at the bottom of the scale and to a tenth of one per cent at the top, a factor of 9.3. Read in absolute luminance it is the other way round by a factor of 6.5, and both readings are true.
brain · Appearance
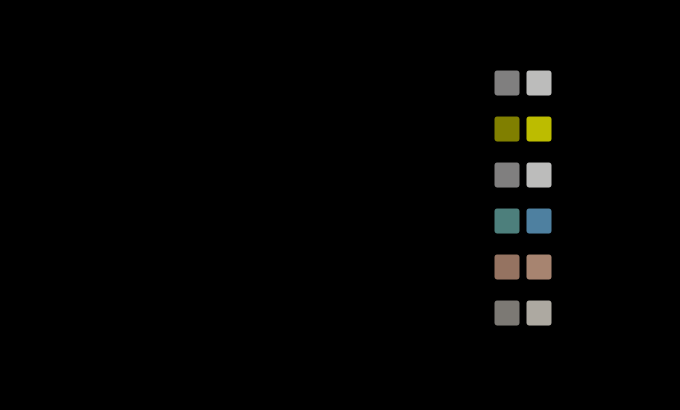
The same blend, taken on the stored values and on the light. Six pairs blended at 50 per cent, once by averaging the values as they are stored and once by averaging the light they stand for. Every resize, every antialiased edge and every transparency composite in an ordinary pipeline does the first. The two land 15.8 colour differences apart at the mean and 19.3 on a red against a green, and the stored-value blend is the darker on all six, by up to 23 units of lightness.

An average on the stored values

A resize, an antialiased edge, a transparency composite and a chroma subsample are all averages, and in almost every pipeline they are taken on the numbers as stored. The numbers as stored are encoded, the encoding is a compression, and a half-and-half blend of black and white taken that way lands 18.7 colour differences from the half-and-half blend of the light — 22.7 units of lightness darker, on every pair, always in the same direction.

applied · Delivery
Which way each tolerance is tightest, colour by colour. Sixty-four colours on a lattice through the sRGB cube, with lightness across the bottom. For each, the tolerance ΔE₀₀ 1 is pulled back into tristimulus values and its shortest and longest axes are found. The filled points are the angle between each colour's shortest axis and the direction common to all of them: a median of 15 degrees, ninety per cent within 32. The open points are the same for the longest axis, at 23. The common short axis is 3.1 degrees from X up and Y down, which is the direction of a*.

A tolerance has a grain

A colour tolerance pulled back into tristimulus values is a long thin shape, and across the whole sRGB cube its shortest axis points the same way, fifteen degrees off at the median — the direction in which X rises as Y falls, which is the direction of a*. So what one colour difference allows depends on which way a delivery drifts. An instrument's X filter may age 1.4 per cent before the tolerance is used up, its Z filter 5.1, and the light on the sample 9.3.

matching · Gamut
What a small neutral deviation costs as the grey darkens, in two lightness scales. The price of a fixed fraction of deviation on a neutral — how much lightness it is worth per unit of luminance — from L 40 down to L 0.25, both axes logarithmic. CIELAB's L is a straight line below L 8 and its price there is exactly flat. The appearance model's J′ has no straight piece: its price keeps rising, by a factor of 5.0 across the same range, as the luminance to the power -0.442 — the derived exponent is -0.441 in an average surround.

The appearance model has no straight piece

CIELAB's lightness is a straight line below L* 8, so a deviation near black has a fixed price and a black has a floor under it. CIECAM16 has no such piece. Its lightness near zero goes as the luminance to a power set by the room, the price of a deviation rises without limit as the black deepens — as Y to the power −0.44 in a lit room and −0.58 in a dark one — and on a projected black a lightness unit in the model allows under half the luminance change a unit of L* allows.

matching · Gamut
A black level slightly wrong, through the balance, under daylight. A grey ramp from half a per cent to seventy-two per cent reflectance, with a pedestal error of a tenth, three tenths and one per cent of white left in all three raw channels before the white balance, against the same ramp with none. The horizontal axis is the grey's reflectance, logarithmic. At a three-tenths error a two per cent grey is 2.4 colour differences off, most of it chroma, and a seventy-two per cent grey 0.21. An equal offset in the raw channels is not equal after three different gains.

A black level is multiplied by the balance

Every raw value carries a pedestal that is subtracted before anything else, and a white balance is then a different gain in each channel. Subtracting a constant and multiplying by one commute only when the constant is zero or the gains are equal. So a pedestal left three thousandths of white too high becomes 2.4 colour differences in a two per cent grey, most of it chroma, in the colour the lamp starves — and pushing that shadow four stops in editing makes it 8.9. An offset in proportion to the lamp's own white is the exception, and it is exactly grey.

imaging · Capture
A 2-nanometre notch, and what two five-nanometre grids record of it. The reflectance of a sample with a 2-nanometre notch at 552.3 nm, drawn finely from 535 to 570 nm. The dark ticks are the samples of a five-nanometre grid starting at 380 nm and the pale ticks those of the same grid started half a step later. The true minimum is 0.06; the first grid's deepest sample reads 0.70 and the second's 0.08. The sample has put a line into a calculation whose light has none.

The line can be in the sample

The rule for which tabulation defect to fix compares the light's narrowest feature with the grid's step, and it named its own failure case — a sample with structure narrower than the step. Given one, a two-nanometre notch under a thermal source with no feature at all costs 2.1 colour differences at five nanometres and moves 2.0 when the grid slides, which is what a fluorescent tube costs on a smooth pigment. Under that tube a notch twelve nanometres wide, more than twice the step, moves 8.1 when it sits on the mercury line.

light · Light
What a five-nanometre grid costs a steep-sided notch, against its width, under a 6500 K source. The cost of a five-nanometre grid starting at 380 nm, against a reference at two hundredths of a nanometre, for a sample with a flat-bottomed notch at 552.3 nm under a 6500 K thermal radiator, against the notch's width from 2 to 30 nm, for edges rising in 0.4, 2.2, 6.6 nm. With the steepest edges the cost is 0.02 at 10 nm, 1.99 at 12.5 and 0.03 at 20: it rises and falls with the step as its period and does not die away as the notch widens. With the softest edges it stays under 0.10 at every width.

The cost of a steep notch repeats every step

A Gaussian notch is safe on a five-nanometre grid once it is a couple of steps wide. A flat-bottomed notch with steep sides never is. Its cost on the grid rises and falls with its width, with the step as its period — 0.02 colour differences at ten nanometres, 1.99 at twelve and a half, 0.03 at twenty — and it does not die away as the notch widens. What sets its size is how fast the edges rise, and an interference filter's edges rise in under a nanometre.

light · Light

Named alongside it

The objects these essays reach for when they reach for this one.

SpecificationQuality controlWavelength gridToleranceQuadratureChromatic adaptationSamplingAuditDeclared inputΔESpectrophotometryStructural choice

All concepts