A dot is larger than it was asked to be
Assumes A halftone is not a mixture and What the instrument reports.
A press is characterised by printing a strip of tints and measuring them. The strip is the same everywhere: a ramp from nothing to solid in steps, one per ink, read on an instrument whose own bandpass is part of the answer, and the difference between what was asked for and what came back is called dot gain and is quoted as a percentage at the fifty per cent tint.
It is the most-measured quantity in the industry, and it is a sum of two mechanisms that the measurement cannot separate.

The claim
The tone ramp is a measurement of the sum of two mechanisms, and the sum is all it contains. Any split between them can be fitted to it, and the splits disagree about patches the ramp does not contain.
This is not a subtle statistical point about identifiability. The two mechanisms are physically distinct, they live in different objects, and one of them is a property of the paper rather than of the press at all. The measurement that every printing standard is written around is blind to the difference.
The two mechanisms
The dot really is larger. Ink is pressed onto a substrate through a blanket, and it spreads. A dot asked to cover fifty per cent of the cell covers more, and how much more depends on the pressure, the ink’s tack, the blanket, the speed and the absorbency of the sheet. It is a mechanical fact about a liquid, and it happens before the light arrives — so unlike almost everything else on this site, it is not a claim about an observer at all.
Modelled here as an increase that vanishes at both ends and peaks in the middle, since a zero per cent dot cannot spread and a hundred per cent dot has nowhere to spread to:
At , a 25 per cent tint prints at 36, a 50 at 66, and a 75 at 86.
The light arrives somewhere else. Paper is a scattering medium. A photon entering bare paper travels sideways some tens of micrometres before it comes back out, and if it comes back out under a dot it is absorbed on the way. The dot catches more light than its area without being any larger at all.
The standard correction is Yule and Nielsen’s, from 1951: average the primaries’ reflectances raised to the power , then raise the result back.
is the plain area average, the case where no light ever crosses sideways. Larger is more scattering. The exponent is not derived from anything; it is fitted, and what it measures is the paper.


What was computed, and how
The demonstration is a small experiment run entirely inside the model, and it is worth stating in the order it was done, because the order is what makes it a test rather than an illustration.
A press was stipulated: 10 per cent mechanical gain, Yule–Nielsen exponent 2.4, coated stock. Its cyan ramp was computed at eleven tints and treated from then on as a measurement — the only thing any later step is allowed to see.
Then a mechanical gain was fitted to that ramp at each of several stated exponents, by minimising the squared lightness error over the eleven tints. The fit has one free parameter, and it lands where it must:
| assumed n | fitted gain | root-mean-square error on the ramp |
|---|---|---|
| 1.0 | 23.2% | 0.66 L* |
| 1.4 | 17.3% | 0.29 |
| 1.8 | 13.6% | 0.12 |
| 2.4 | 10.0% | 0.000 |
| 3.0 | 7.8% | 0.07 |
The true row recovers the true gain to three decimals, which is the check that the fitting works at all. Every other row is a different press that reproduces the same measurement to a fraction of a lightness unit — well inside what an instrument on a shop floor would report, and far inside what press-to-press variation would swamp.
A tone ramp is one equation with two unknowns. The industry solves it by declaring one of them, usually by assuming and reporting the remainder as dot gain.
The patch that tells them apart
The two fits agree because they were fitted to agree. The interesting question is what happens on a patch that was not in the fit, and the answer is that the disagreement is large and lands where nobody is looking.
Fitted at with 23.2 per cent gain, against fitted at with 10 per cent:
| patch | fit at n = 1 | fit at n = 2.4 | ΔE00 |
|---|---|---|---|
| 25% cyan over 25% magenta | L* 69.8, a* 6.9, b* −14.4 | 66.2, 10.5, −21.3 | 5.05 |
| 50% over 50% | 47.5, 12.4, −27.5 | 45.8, 15.5, −33.8 | 3.20 |
| 50/50/50 three-ink | 44.5, 7.3, 6.1 | 42.9, 7.0, 4.2 | 2.13 |
| 70% over 70% | 34.7, 14.2, −36.0 | 34.8, 15.9, −39.6 | 1.29 |
| solid over solid | 24.0, 13.6, −44.1 | 24.0, 13.6, −44.1 | 0.00 |
The solid overprint agrees exactly, and it agrees exactly for the same reason the ends of the ramp do: at full coverage there is no halftone, so neither mechanism has anything to act on. The disagreement is largest in the light overprints, which is precisely where a photograph’s skin tones and a package’s pale backgrounds live, and it falls away towards the solids that a press operator actually inspects.
To put ΔE00 = 5 in context, a paint contract’s tolerance is typically 1.0 and a printing standard’s tolerance for a solid is around 5 with a re-print threshold below that. Two characterisations of the same press, both fitted to the same measurement and both correct on it, differ by more than the tolerance on a patch neither was asked about.
What the ramp does determine
One equation with two unknowns is the right description, and it can be made specific: the equation has a solution set, and the fitting table is five points on it.
Multiplying each row’s fitted gain by its assumed exponent:
| assumed n | fitted gain | product |
|---|---|---|
| 1.0 | 23.2 % | 23.20 |
| 1.4 | 17.3 % | 24.22 |
| 1.8 | 13.6 % | 24.48 |
| 2.4 | 10.0 % | 24.00 |
| 3.0 | 7.8 % | 23.40 |
The product is constant to two per cent while each factor moves by a factor of three. Across the table the gain spans 2.97 to one, the exponent spans 3.00 to one, and their product spans 1.055 to one — thirty-six times more stable than either of the things it is made of.
So the ramp is not silent. It measures one number precisely, and that number is a product rather than
either mechanism. A press characterisation reporting 23.2 per cent dot gain is reporting g × n ≈ 24
divided by an assumed exponent of 1, which is why the industry’s default answer is the largest one the
solution set contains — assuming no scattering assigns the whole product to the press.
The hyperbola is also a better description of the trade-off than the obvious alternative. A straight
line through the two end rows, which is what the two mechanisms add would predict, misses the three
interior rows by 2.4 to 3.4 points; g = 23.9/n misses them by 0.3 and has one parameter rather than
two. The mechanisms trade multiplicatively, not additively, and that has a consequence the additive
picture hides: on an uncoated stock, where the exponent is larger, the same measured ramp implies
proportionally less mechanical gain rather than a fixed amount less. The shop chasing an aim value on
uncoated paper is further from the press than the linear intuition suggests.
Which patch separates them depends on the ruler
The separating patch is chosen on ΔE₀₀, and the four candidates rank differently in plain CIELAB distance — which matters, because the recommendation is that a shop add one patch to a control strip.
| patch | ΔE*ab | ΔE₀₀ | ratio | mean C* |
|---|---|---|---|---|
| 25 % over 25 % | 8.57 | 5.05 | 0.59 | 19.9 |
| 50 % over 50 % | 7.22 | 3.20 | 0.44 | 33.7 |
| 50/50/50 three-ink | 2.50 | 2.13 | 0.85 | 8.8 |
| 70 % over 70 % | 3.98 | 1.29 | 0.32 | 40.7 |
The three-ink patch and the 70 per cent overprint swap. In CIELAB distance the overprint separates the two hypotheses by 3.98 against the three-ink patch’s 2.50; in ΔE₀₀ the three-ink patch wins, 2.13 against 1.29. The reversal is entirely the chroma weighting: the three-ink patch is near-neutral at C* 8.8 and keeps 85 per cent of its Euclidean distance, while the 70 per cent overprint is at C* 40.7 and keeps 32.
That does not disturb the recommendation, because the 25 per cent overprint is first on both rulers and by a wide margin either way. It disturbs the reading of the table. The falling column is not purely the mechanisms losing grip as coverage rises; a third of the fall from 5.05 to 1.29 is ΔE₀₀ discounting the saturated end, and the two effects run in the same direction, which is what makes them hard to see. Ranked on Euclidean distance the disagreement still falls with coverage, so the essay’s account survives — it is smaller than the ΔE₀₀ column makes it look.
The useful form for a pressroom is the one the ratio column suggests: a separating patch should be pale and it should be neutral, and the second requirement is not the same as the first. A light overprint of two inks is pale and chromatic; a light three-ink grey is both, and it is already on every control strip that carries a grey balance patch.
Why the ends are innocent and the middle is not
Both mechanisms have the same signature: zero at 0 per cent coverage, zero at 100 per cent, maximum somewhere near the middle. That is not a coincidence of the models — it is forced.
Mechanical spreading needs a perimeter to spread across, and a cell that is entirely covered or entirely bare has none. Optical scattering needs a boundary for light to cross, and the same two cases have none either. So both mechanisms are functions with the same two zeros and one hump, and any two such functions can be traded against one another over the middle to considerable accuracy.
The one place they behave differently is where more than one ink is present. Mechanical gain changes the areas, and Demichel’s rule then propagates that change through every overprint region; optical scattering changes how the regions’ reflectances are averaged, and the averaging is nonlinear in a way that depends on how far apart those reflectances are. Two inks give four regions with a wider spread of reflectances than one ink’s two, so the nonlinearity has more to work with. Hence the table above.
What the trade reports, and what it does about it
The quantity a printing standard specifies is neither of the two mechanisms. It is tone value increase — the difference between the requested coverage and the coverage the measurement implies — computed by inverting the Murray–Davies equation on a measured density.
That inversion assumes . It is therefore not an estimate of mechanical dot gain at all: it is the sum of both mechanisms, expressed in units of area, under an assumption that one of them does not exist. ISO 12647-2 quotes aim values for it in the high teens at the fifty per cent tint for coated stock, with a tolerance of a few points, and a press is adjusted until it hits them.
This works, and it is worth being clear about why it works, because the essay is not an argument that the practice is broken. The characterisation is used to build a correction curve that is applied to the plates: whatever the sum of the mechanisms is, the plate is written with the tint that will land where the standard says. As long as the same paper, ink and press are used for the correction and the job, a quantity that confounds two mechanisms is a perfectly good thing to correct against, because the confounded sum is what will happen again tomorrow.
The practice fails exactly when the sum is transported. A correction built on one substrate applied on another; a proof made on an inkjet with a different scattering length; a characterisation reused after a paper change that the shop treated as equivalent. In each case the split matters, and the split was never measured.

A dot gain of twenty-three per cent that is not a dot gain
It is worth dwelling on the top row of the fitting table, because it is not an exotic case — it is the industry’s default.
Reporting tone value increase through Murray–Davies is fitting at . On the stipulated press above, that reports 23.2 per cent where the mechanical spreading is 10. More than half of the number a pressroom is adjusting against is light moving sideways inside a sheet of paper, and no adjustment to the press can change it.
The consequence is a familiar frustration with a precise cause. A shop that cannot get its gain down to the aim value on an uncoated stock is often not running badly; it is running against a substrate whose scattering contributes a component the press cannot reach. The remedy is a plate correction, which is what is done, and the diagnosis matters because the alternative remedies — more pressure, less ink, a harder blanket — are attempts to move the half of the number that is already where it should be.
Where this model stops
The exponent is not a physical constant and nothing here pretends otherwise. A proper account would solve a radiative transfer problem inside the sheet with a stated scattering coefficient and a stated dot geometry, and would produce a result that is both more defensible and less usable than a single fitted number. Yule and Nielsen were candid about this in 1951; seventy years of attempts to replace it have not dislodged it.
Real fitted exponents sometimes exceed what any scattering model can produce. Values above about 3 turn up in fits to real data, and they are absorbing everything the model left out — ink penetration, non-circular dots, the instrument’s own aperture — rather than reporting scattering. An exponent is a residue as much as a measurement.
The instrument is idealised here. A real densitometer sees the patch through an aperture of a stated size at a stated geometry, and what it reports is the truth convolved with its own bandpass. Two instruments disagreeing about the same patch is an independent source of the same kind of ambiguity, and it is measured elsewhere on this site at over a ΔE00 of one on structured samples.
Nothing here is about screening technology. A stochastic screen has vastly more perimeter per unit area than a conventional one at the same coverage, so it gains far more mechanically and scatters differently too. That is a real and large effect and it is a separate argument.
The generalisation
The shape of this essay recurs whenever a measurement is used to characterise a system with more mechanisms than the measurement has degrees of freedom.
Two mechanisms with the same functional signature cannot be separated by a measurement that only sees their sum, and the fitted split will be stable, reproducible and wrong. The stability is the trap: refit tomorrow on a new ramp and the same 23.2 per cent comes back, which reads as confirmation.
This site has met the pattern before from the other end. A camera’s colour matrix fitted on one set of surfaces and tested on another has exactly this structure: the fit is excellent where it was fitted and the error is off the sample set. There the missing information is spectral; here it is spatial; in both cases the fix is the same, and it is not a better fit.
The fix is to measure something the fit was not fitted to. One two-ink overprint at 25 per cent, read once, separates the two hypotheses by five ΔE00. It costs a patch on a control strip that already carries forty of them.
What the exponent is a property of
One consequence is worth stating on its own, because it is the practical half of the essay.
The Yule–Nielsen exponent belongs to the paper. The mechanical gain belongs to the press. A shop that changes stock and re-runs its characterisation will find its “dot gain” has changed, and will adjust the press, when what changed was the scattering length of a sheet. The same substrate carries the white point every printed colour is reported against, so a paper change moves two independent things at once and the shop sees one number.

Who found it, and when
Murray and Davies gave the area-average form in 1936, and the equation that carries their names is still the one written on pressroom walls: the density of a tint follows from the fraction of the sheet covered.
Yule and Nielsen published the exponent in 1951 at the Rochester Institute of Technology, explicitly to account for the discrepancy between Murray–Davies and measurement. Their paper is careful about what it is claiming: the power law fits, its exponent varies with the paper, and no derivation is offered.
Clapper and Yule did the derivation in 1953, in a multiple-internal-reflection model of a halftone over a diffusing substrate, and got something that reduces to a power law only approximately. The approximate version won, because it has one parameter.
The two mechanisms have been known to be confounded for as long as both have been named. What is unusual is how little the confounding matters in practice — until a job is proofed on one substrate and printed on another, at which point the split that was never measured becomes the thing that decides whether the proof was any good. That is the subject of a later rung in this field.
Where the ladder goes next
This rung sits directly on the mosaic, because both mechanisms are statements about areas and about light crossing between them, and neither means anything until the halftone is understood as a partition of a sheet rather than a mixture.
Beside it stands the paper as the white point, which takes the substrate’s other contribution — its colour rather than its scattering — and finds it propagating into every number a press reports.
Above, the tone curve stops being a curve and becomes a table: a profile is a table and an inversion, with the same property that it is exact where it was measured and interpolated everywhere else.
Where this goes next
 A halftone is not a mixture
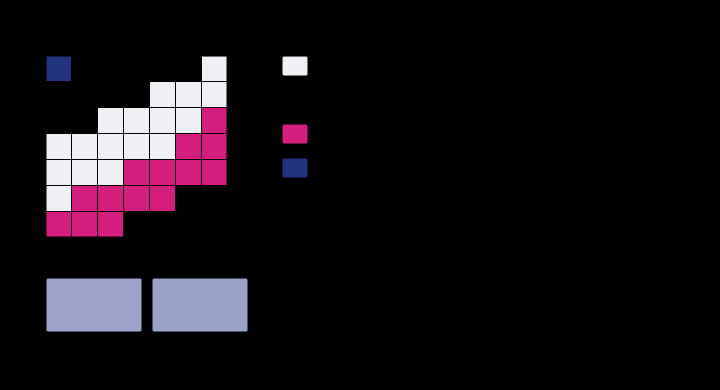
Forty per cent cyan and thirty per cent magenta are not stirred together anywhere. They are laid down as dots, and the sheet is a mosaic of four fully-inked regions in proportions the two coverages fix — which is why the colour is an area average of four spectra rather than a blend of two, and why it lands nowhere near where mixing would put it.
A halftone is not a mixture
Forty per cent cyan and thirty per cent magenta are not stirred together anywhere. They are laid down as dots, and the sheet is a mosaic of four fully-inked regions in proportions the two coverages fix — which is why the colour is an area average of four spectra rather than a blend of two, and why it lands nowhere near where mixing would put it.
 What the instrument reports
A spectrophotometer sees a sample through a slit of finite width, at a finite number of wavelengths. What it writes down is the truth convolved with its own bandpass, and nothing in the file says which values were measured and which were invented.
What the instrument reports
A spectrophotometer sees a sample through a slit of finite width, at a finite number of wavelengths. What it writes down is the truth convolved with its own bandpass, and nothing in the file says which values were measured and which were invented.
 The paper is the white point
A printed colour is reported against the sheet it sits on rather than against the light in the room, and the choice is a switch in every colour engine. Flipped one way, the same separation on coated stock and on newsprint is a 3.04 colour difference; flipped the other, it is 0.13 — and the two answers are about different questions.
The paper is the white point
A printed colour is reported against the sheet it sits on rather than against the light in the room, and the choice is a switch in every colour engine. Flipped one way, the same separation on coated stock and on newsprint is a 3.04 colour difference; flipped the other, it is 0.13 — and the two answers are about different questions.
What this makes readable
Essays that name this one as a prerequisite.
Named alongside this one
Essays reaching for the same objects. Nobody chose these; they are what the index of named objects makes visible.
- A black that is not black halftone · quality control · tone reproduction
- A brand colour for a population process inks · quality control · substrate
- A lamp has a direction quality control · scattering · substrate
- A profile interpolates light process inks · quality control · tone curve
- A tolerance cannot cross a condition halftone · quality control · substrate
- The fifth ink buys a corner halftone · process inks · quality control
What links here
The 8 essays that link to this one and share the most of its objects, of 19 that link here.
The objects this essay names
Each one links to every other essay that touches it.
Dot gainHalftoneMeasurement errorProcess inksQuality controlScatteringSubstrateTone curveTone reproductionThe Yule–Nielsen exponent