Field

What it takes to deliver it

A colour that stays where it was measured is nobody's problem. This is the apparatus that carries one to somebody else — ink on a sheet, a profile, a rendering intent, a proof, and a room — and every stage of it is a map that loses something, chosen deliberately.

70 essays. Read in order: Delivery.
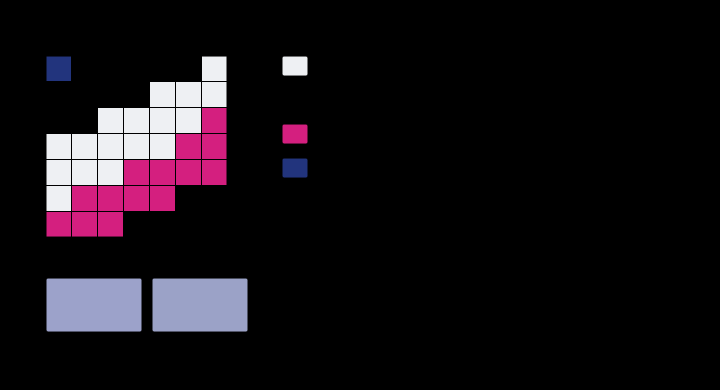
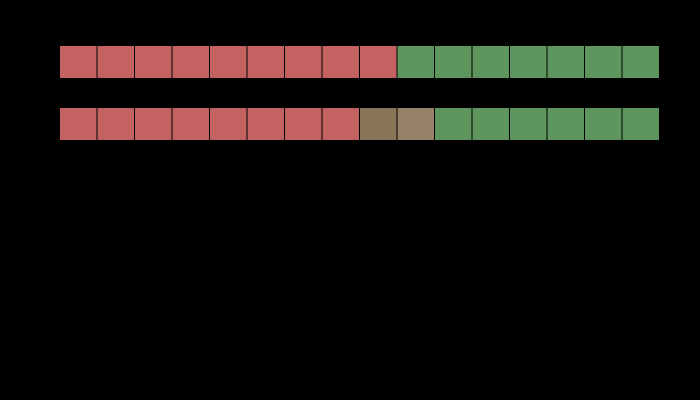
A halftone tint, its four regions, and what they average to. At 40% and 30% coverage the sheet is a mosaic of 4 fully-inked regions, not a mixture of anything. Their areas are the product of the coverages — Demichel's rule, which holds because the screens are rotated to make it hold — and the patch's reflectance is the area-weighted average of theirs, raised to the Yule–Nielsen exponent n = 1.8. Averaging the regions' CIELAB coordinates instead, which is what mixing means to almost everybody, lands ΔE00 = 0.76 away.

A halftone is not a mixture

part 1
Two mechanisms, one ramp, and the patch that separates them. A cyan ramp printed by a press with 10 per cent mechanical gain and a Yule–Nielsen exponent of 2.4. Fitting a mechanical gain at n = 1.0 gives 23 per cent and fitting one at n = 2.4 gives 10 per cent; both reproduce the ramp to under 0.66 of a lightness unit, and the curves lie on top of one another. The two-ink overprint below was in neither fit, and there they are ΔE00 = 3.20 apart.

A dot is larger than it was asked to be

part 2
What a press and a display can reach at L* = 50. A slice through both solids at lightness 50, with the press dashed and the display solid. The boundaries cross: the press reaches past sRGB in 15 of 48 directions and falls inside it in 31. That is the shape of every conversion between them — colours are lost in one direction and gained in the other, and the picture cannot show the gained ones, because it is being displayed on the gamut that cannot reach them. Those are hatched.

Neither gamut contains the other

part 2
How wrong a profile is between its entries. A device profile is a lattice of measured patches and an interpolation. At every node of every grid drawn here the error is exactly zero, which is why a profile checked at its own patches always looks perfect. Sampled between the nodes, a 3-step grid is worst by ΔE00 = 2.93 and a 17-step grid by 0.30. Both are honest tables of the same press.

A profile is a table

part 1
The process inks as reflectance. Each ink is a sum of Gaussian absorbance bands with stated centres, widths and peak densities, and the reflectance shown is the substrate's times the square of the ink's transmittance, because light crosses the film going down and coming back. The first band of each ink is what it is for; the rest are what is wrong with it. Magenta's unwanted absorption in the blue-violet reaches an optical density of 0.46 against 0.95 for the band it exists to have — 48 per cent of its own strength, absorbing exactly where a saturated blue needs light to survive.

The paper is the white point

part 2
The solids, by volume. CIELAB volume, all measured by the same cell count with the same extrapolation, and quoted against sRGB because that is the comparison the estimator supports. The four-colour press reaches 49 per cent of the sRGB solid's volume — and contains colours sRGB does not, which is why "half the gamut" is the wrong summary of a ratio of one half.

The fourth ink is not for colour

part 2
What happens to a tone the destination cannot print. Source lightness along the bottom, destination lightness up the side, for a print whose black is L* = 8. Clipping is the flat segment on the left — 4 of 10 levels in the bottom twenty points of the scale arrive as the same number, and nothing downstream can recover them. Black point compensation is the straight line: all 10 levels survive as different numbers, and every tone in the picture has moved to pay for it.

A black that is not black

part 2
What separates the separations, and under which light. 11 separations of a single colour, differing only in how much of it is carried by black rather than by the three chromatic inks. Under D50 they agree to ΔE00 = 0.00 — the solver was asked for that and delivered it. Under illuminant A they spread to 6.75. They are metamers of one another, and the whole family is invisible to any instrument reading a single illuminant.

The separation is not unique

part 3
A gradient of one hue, mapped into a press's gamut 2 ways. Chroma asked for along the bottom, chroma delivered up the side, for a ramp at lightness 55 and hue angle 25°. A colorimetric intent follows the diagonal until the press runs out and is flat afterwards — the flat part is a gradient arriving as a single colour. The perceptual intent is under the diagonal from the start, which is the price of never going flat.

No mapping preserves everything

part 3
What separates the separations, and under which light. 11 separations of a single colour, differing only in how much of it is carried by black rather than by the three chromatic inks. Under D50 they agree to ΔE00 = 0.00 — the solver was asked for that and delivered it. Under illuminant A they spread to 6.75. They are metamers of one another, and the whole family is invisible to any instrument reading a single illuminant.

The lamp in the shop decides

part 3
A named ink, and the closest four-colour build of it. The ink is one pigment chosen for its own spectrum; the four-colour build is three chosen for everything. The four-colour build reaches it to ΔE00 = 0.37 under D50 and drifts to 4.46 under a tungsten lamp, because the match is metameric — the two curves cross 4 times rather than coinciding anywhere.

A brand colour is an ink

part 3
The solids, by volume. CIELAB volume, all measured by the same cell count with the same extrapolation, and quoted against sRGB because that is the comparison the estimator supports. The four-colour press reaches 49 per cent of the sRGB solid's volume — and contains colours sRGB does not, which is why "half the gamut" is the wrong summary of a ratio of one half.

The fifth ink buys a corner

part 4
Lightness against colourfulness, in a booth and on a screen. Each arrow is one colour, from what the model predicts under a print in a 2000 lux booth to what it predicts under a display in a dim room. Every arrow points the same way, which is the content: a dimmer surround lowers predicted lightness and colourfulness together, so a proof does not merely differ from the print, it differs in a direction — and that is why proofing standards specify the room and not only the numbers.

The proof is a different object

part 4
The tone scale of one display, in four rooms. Code value along the bottom, the lightness it comes out at up the side. The curves are the same display: what changes is the light falling on the screen, which adds a fixed luminance to every pixel. The signal value that means black arrives at L* = 11.7 at 600 lux, against 0.9 in the dark — the lightness of a dark grey card, from a pixel that is switched off.

The screen is not the room

part 4
An edge at 4:2:2, and the colour it arrives as. Above, the row as it was sent and as it arrives after the two chroma planes are averaged 2 samples at a time. Below, the colour difference at each sample. The worst is ΔE00 = 25.88, at a luma step of 0.058 across the edge — an edge of nearly equal luminance. Nothing is wrong with the codec: it discards the differences the eye resolves worst, and this edge is made of nothing else.

Colour thrown away on purpose

part 5
A viewing booth is a lamp, and a lamp has an angle. The same sample at five positions across a booth's plane, with the lamp 55 centimetres above it. The curve is how far each position is from the middle, in the units the judgement is made in. It reaches ΔE00 2.40 against a tolerance of 1, while the illuminance uniformity — the quantity the standard actually bounds — never falls below 73 per cent and stays comfortably inside it. The flat trace is the same booth with a source whose converter is the same thickness in every direction: ΔE00 0e+0, exactly, by construction.

The booth is a luminaire

part 6
What a halftone measures, against what it looks like. A 50 per cent screen, measured by an aperture that averages the patch and seen by an eye that blurs it first and compresses afterwards. At a coarse ruling the two disagree by ΔE00 11.1, and the patch looks 14.3 lightness units darker than it measures — the average of a concave function is below the function of the average, which is Jensen's inequality and not an illusion. The gap falls under a unit above 30 cycles per degree. That is a viewing distance, and the correction a press applies for dot gain has no distance in it anywhere.

Measured with an aperture, seen with an eye

part 6
Media-relative colorimetry is a von Kries adaptation in the worst basis there is. Changing the paper is a change of the light reaching the reader, and the rule colour management uses for it — divide the tristimulus values by the substrate's — is a gain applied in XYZ. That is the one transform the table here describes as the oldest mistake still shipping. On the three stocks a press actually uses the penalty is real and small, because a sheet of paper-mill white is the smoothest change of light in the census. On blue it is 10.2 times the residual the same rule would leave in a cone basis.

Dividing by the paper

part 7
Six sheets, four standard measurement conditions, and every pair of them. How far apart two measurement conditions put the same sample. Darker is further. The top row has no brightener in it and every pair agrees to within a unit except the ones involving M₃, whose difference is cross-polarisation removing the interface reflection and is a change of geometry rather than of spectrum. Every row below it disagrees, and the M₁ against M₂ column reaches ΔE00 7.7 — several times any tolerance a printer would accept, on one sheet measured twice by two instruments that are both working correctly. The numbers under the columns are the means.

An instrument brings its own light

part 8
What a proof on an unbrightened sheet cannot reach. The paper white of a heavily brightened stock beside the paper white of an unbrightened one, both under an ultraviolet-included instrument. They are ΔE00 9.8 apart and 10.3 of that is in the blue-yellow axis. A proofing system on the unbrightened sheet can print towards the brightened one only by adding ink, which makes the paper darker rather than bluer; it cannot add light at 435 nanometres because it has no brightener and its own lamp is the one in the room. This is why a soft proof and a hard proof of the same job disagree about the white, and why the disagreement is in one direction.

A proof cannot glow

part 7
What the next thousand patches buy a printer profile. A profile is a table, exact at its nodes and interpolated everywhere else. Each mark is a grid: the horizontal axis is how many patches somebody had to print and measure, the vertical is the worst error found between the nodes. Going from 135 patches to 3645 — 27.0× the work — buys 8.4× the accuracy. The error falls with the square of the spacing and the count rises with its cube.

A profile is a fit between its nodes

part 9
Three published primary sets, and a fourth chosen for how it adapts. The spectral locus with four triangles inside it. sRGB covers 33.5% of the diagram and leaves an adapted observer 2.36 ΔE00; Display P3 covers 45.4% at 1.22; Rec. 2020 covers 63.3% at 1.09. The fourth triangle is the best adaptation basis available to a display asked to cover 63.5% of the diagram, at 1.02 — and it is a different triangle from Rec. 2020's rather than a smaller one. The largest triangle that fits at all covers 73.9%, which is where the axis of this argument ends.

Primaries chosen for their inverse

part 10
Best on the average, undefined at the edge. Two rows of bars sharing one set of labels. On the left, each adaptation basis's mean residual over the fourteen changes of light the census lists — Bradford is the shortest bar at 1.14 ΔE00 and is what colour management uses. On the right, the same bases against the worst change the same family of painted rooms can produce. Three of the five have no bar there at all, marked instead with the gain that replaced it: under a deep narrow notch their reading of the white passes through zero, so the diagonal is a division by nothing and the model stops being defined rather than merely doing badly. Bradford's middle gain reaches -1.0e+19. CAT16, which exists because CAT02 was withdrawn for going negative in practice, is one of the two that survives.

Best on the average, undefined at the edge

part 11
A primary's tolerance is a shape, and part of it is unreachable. The CIE chromaticity diagram with the spectral locus drawn, and three closed regions marking where each primary of a display designed for its own inverse can sit while the adaptation cost stays within 1 per cent of its best. None of them is round: the widest runs 15.1 times further one way than another, so a single tolerance figure for a primary is the average of a shape the shape never takes. 47 of the 144 boundary directions leave the region a real primary can occupy, which is a second constraint the objective knows nothing about — the cost does not rise there, and the primary cannot go there.

A tolerance is a region

part 11
At a published matrix the slope arrives long before the bowl. One row per basis in this collection's table. Each row is a logarithmic axis of distance in the nine coefficients, with two markers: the radius at which the objective's curvature becomes as large as its slope, and the distance from that basis to the optimum. The first is between 3.2 and 108 per cent of the second. So over almost the whole journey from a published matrix to the best one, the surface is a slope and not a bowl — and a table of eigenvalues taken there describes a neighbourhood the optimum is nowhere near. XYZ scaling is the exception, at 1.08 of the distance, because its slope is the steepest in the table.

The slope arrives before the bowl

part 10
Downhill from every published matrix, one step at a time. Each curve is a steepest-descent walk from one of this collection's published bases, plotted as the objective against the distance walked in the nine coefficients. The horizontal line is the optimum. The first step of each walk is the long one — XYZ scaling closes 41 per cent of its whole gap in one — and every walk then flattens without reaching the line, because the valley floor is nearly flat and the steepest direction is nearly across it. Bradford starts closest and closes least: it is already in the flat part.

Downhill from a published matrix

part 11
Where a delivered colour's error actually comes from. Three bars and two totals. The profile's interpolation between its nodes contributes 0.13 ΔE00; the rendering intent, at the colorimetric setting, moves nothing that was already printable and contributes 0.00; and looking at the result in a dim room rather than the booth it was proofed in contributes 4.30, which is 97 per cent of the total. The two totals are the three added — 4.43 — and combined in quadrature — 4.30. The gap between those two rules is 0.127, about the size of the entire profile stage, and no standard says which rule to use.

A delivery tolerance is three tolerances
part 10
A gradient of one hue, mapped into a press's gamut 3 ways. Chroma asked for along the bottom, chroma delivered up the side, for a ramp at lightness 55 and hue angle 25°. A colorimetric intent follows the diagonal until the press runs out and is flat afterwards — the flat part is a gradient arriving as a single colour. The perceptual intent is under the diagonal from the start, which is the price of never going flat.

A budget drawn through one hue

part 11
Pairs built to sit exactly on a ΔE2000 tolerance, read in every other unit. Twenty-four pairs of surfaces, each constructed by walking one member along a fixed direction until the difference is exactly 1.0 ΔE2000 under D65. The bar spans what those same pairs read in each unit, after calibration, with the tick at the mean. ΔE2000's own row is a point at 1.0 by construction. Every other unit spreads them: ΔE*uv reads them from 0.69 to 1.75, so a contract written at "one unit" accepts and rejects a different set of deliveries depending on which unit it means. CAM16-UCS rejects all twenty-four: it reads the closest of them at 1.43.

A tolerance is a boundary through pairs

part 12
Every figure a surround dial would apply to, weighed. The eleven generators in the appearance family, by the size of the drawing each emits — which is what a dial multiplies, because every frame carries the figure's whole body. The dashed rules are the thresholds the dial policy here is written in: under 3 KB gets thirteen stops, under 6 gets nine, under 10 gets seven, and above about 12 KB nothing gets a dial at all. The median body here is 2.25 KB and 4 of the eleven are inside the most generous tier, against a policy written when the distribution had a median of 4.0 KB. Two phases deferred a surround dial on the grounds that appearance swatches are not small. The exception is unique-hues at 14.1 KB, which is over the ceiling that says it should have no dial — and it has one, on chroma, declared in the same file as the ceiling.

A dial has a price

part 13
The share of a sample's reflectance an aperture recovers, by how wide it is. Six materials, and the fraction of each one's true reflectance that a measurement recovers through an aperture of the stated radius. The horizontal axis is logarithmic in millimetres; the vertical is a share, so 1.0 is the whole of it. The dashed line is a 4-millimetre radius, which is about what a hand-held spectrophotometer has. At that aperture coated paper reads 98 per cent of its own reflectance and candle wax reads 48. Every curve approaches one from below and none of them reaches it: the kernel's tail is what is being cut, and it falls as one over the aperture rather than exponentially.

An aperture is a filter

part 12
The share of a sample's reflectance an aperture recovers, by how wide it is. Six materials, and the fraction of each one's true reflectance that a measurement recovers through an aperture of the stated radius. The horizontal axis is logarithmic in millimetres; the vertical is a share, so 1.0 is the whole of it. The dashed line is a 8-millimetre radius, which is about what a hand-held spectrophotometer has. At that aperture coated paper reads 99 per cent of its own reflectance and candle wax reads 66. Every curve approaches one from below and none of them reaches it: the kernel's tail is what is being cut, and it falls as one over the aperture rather than exponentially.

Either disc can be the wide one

part 12
Four departures from the model equation, each at an ordinary strength. What each of the four assumptions inside a colour integral costs, in ΔE₀₀, on a stated sample under a stated light. The wavelength index is a coated printing paper measured with and without the ultraviolet of D50; the range is the same paper integrated from 300 nanometres and from 380; the place index is a pigmented plastic through a four-millimetre radius; the direction index is an eggshell paint beside a window. The spread is a factor of 7.0. This is a ranking of four examples rather than of four departures — each of them can be made larger by choosing a more extreme sample, and the marble in the same collection of materials reaches 12.7 on the index that comes third here.

Which index to buy an instrument for

part 13
The conditions under which an observer's departure is exactly zero. A departure of the observer is the pairing of something belonging to the observer with something belonging to the stimulus, so emptying either factor empties the product. The axis is logarithmic in what is left when the condition is imposed. Six rows empty the stimulus's factor — a perfectly neutral sample is the same colour for every observer, at any age and any field size — and two empty the observer's, since a gain on each cone and a change of basis are both absorbed exactly. All eight are identities rather than small numbers. The last two are the same two conditions imposed in a published cone space rather than in the observer's own, and they are worth eight and thirteen units: the identity is about the eye, and the arithmetic everybody uses is in somebody else's coordinates.

The instrument is one observer exactly

part 14
Every departure under every light. Six departures across six lights, each cell the difference between two observers in ΔE₀₀, drawn as a bar whose length is the number. The rows are not multiples of one another: the lens is worst under tungsten and the pigment peaks are worst under a three-emitter LED, because a departure is a pairing and which light is being paired with decides it. The laser projector's row is empty, and that is not a fact about lasers — on this collection's five-nanometre grid a three-line spectrum is a one-line spectrum, and a single wavelength is a stimulus every observer agrees about exactly.

The booth and the eye disagree

part 14
Each departure over forty-two surfaces rather than one. The same six departures measured over a family of forty-two analytic reflectances — an absorption band of stated centre, width and depth — with the smallest, the median, the ninety-fifth percentile and the largest marked. Every one of them spans more than a factor of three, and the ranking between them is not stable across the family: what decides a departure's size is which sample it is asked about, because a departure is a pairing and the sample is one of the two factors. Quoting any single number for what an observer's age is worth is quoting a choice of example.

A brand colour for a population

part 15
The budget's three numbers, and the units they are in. The published three-stage budget's own figures, with each one's unit named, beside the same stage re-measured in a single unit over the same colours. Two of the three are colour differences between stimuli and the third is a distance between appearances, and the budget adds them. The fourth row is a stage the budget has no entry for: the colours the separation cannot reach even after the mapping has moved them, which comes to 1.45.

The budget adds two units

part 16
The same blend, taken on the stored values and on the light. Six pairs blended at 50 per cent, once by averaging the values as they are stored and once by averaging the light they stand for. Every resize, every antialiased edge and every transparency composite in an ordinary pipeline does the first. The two land 15.8 colour differences apart at the mean and 19.3 on a red against a green, and the stored-value blend is the darker on all six, by up to 23 units of lightness.

An average on the stored values

part 17
The same colour, delivered from two documents. A ramp of chroma, mapped into a press's gamut under the perceptual intent from two source solids: the whole of sRGB, and the same solid with its chroma limited, which is what a document containing only muted colours amounts to. Under a colorimetric intent the two answers are identical to the floating-point floor. Under the perceptual one they are 0.69 apart at the mean and 2.64 at the worst, on colours the destination could hold either way.

An intent is not a function of the colour

part 17
Out to the device and back, once and again. Each intent applied 3 times in succession to the same ramp. The upper bar is what the first pass moves and the lower is what the second moves. relative-colorimetric is idempotent — the second pass moves nothing, to the floating-point floor — and the other two are not: perceptual moves another 2.73 and saturation moves another 3.09. A file converted twice is not a file converted once.

A second conversion is not a repeat

part 18
A soft proof exact for one observer, as two hundred others see it. Each display is driven to match each of thirty printed patches exactly for the reference observer, so for that observer screen and print are the same colour to fourteen decimal places. The bars are what two hundred observers drawn from the population make of the same pairs: the median observer's difference, median over the patches, and the ninety-fifth percentile observer's: 1.8 and 4.8 on the wide-gamut LCD, 2.0 and 5.4 on the OLED, 3.1 and 7.5 on the laser projector. The narrower a display's primaries, the larger both become.

A soft proof is exact for one reader

part 19
How far the chain falls short of its sum, and how much of that is the unit. For each rendering intent, three ratios of the chain's end-to-end error to the sum of its four stages. The lowest bar is the published one, in the power-corrected unit. The middle bar is what that unit reports for a chain whose stages point the same way and add exactly — the exponent on its own. The top bar is the same chain measured in the model's own Euclidean space. Under the colorimetric intent the published ratio is 0.66, the exponent alone gives 0.74 and the chain in a space that can add 0.84: 77 per cent of the shortfall is the unit.

A chain measured in a unit that cannot add

part 17
One edge magnified four times, three ways: text on a page. A step between the two colours of text on a page, magnified four times by linear interpolation, by bicubic and by a three-lobe Lanczos kernel, once on the stored values and once on the light. The curves are the stored-value result's lightness minus the light's, sample by sample across the edge; below the line the stored-value resize is darker. Linear interpolation is darker everywhere it differs. The two kernels with negative lobes swing above the line beside the edge, where their negative weights fall — bicubic by up to 1.8 colour differences and Lanczos by 3.7.

A resize with a negative weight in it

part 18
The corner of a patch of skin against its own shadow, magnified four times by Lanczos, three lobes. A map of the neighbourhood of one corner of a square patch — the patch fills the lower right, the field the rest — once it has been magnified four times by Lanczos, three lobes. Each cell is shaded by how much lighter (warm) or darker (cool) the stored-value result is than the light's, the deepest shade 18.2 units of lightness. Within three source pixels of the corner the stored-value result is up to 14.5 colour differences lighter, 14.5 outside the patch against 3.1 inside it, and up to 7.3 darker.

The corner of a resized patch is lighter than its edges

part 20
A soft proof exact for one observer, and three proofs tuned for readers. For each display, the median over printed patches of the 95th percentile reader's mismatch between screen and print, for four ways of choosing the display's three drive levels: exact for the reference observer; least squares over a population of a hundred; tuned on that population's 95th percentile; and tuned on the two hundred readers it is scored on, which no workflow could do. On a wide-gamut LCD the four give 4.57, 4.99, 4.74, 4.39, and the three tuned proofs cost the reference observer 0.70, 0.82, 0.69. On an OLED panel the four give 5.12, 5.72, 4.99, 4.86, and the three tuned proofs cost the reference observer 1.35, 0.95, 0.67. On a laser projector the four give 7.54, 7.00, 6.81, 6.50, and the three tuned proofs cost the reference observer 1.88, 1.23, 1.14.

A proof cannot be tuned for readers who disagree

part 20
Three stored-value defects, before the eye and after it, a print at 40 cm. Each defect's largest colour difference between the version computed on stored values and the version computed on light, read twice: as a pixel carries it, and after both images have been through the visual system's three channels at 83 pixels a degree. The two rankings are not the same. The unsharp mask has the largest error per pixel — 16.62 — and keeps only 38 per cent of it; the corner has the smallest at 7.14 and comes out at 9.87. The filter is not a blur applied to a difference: it is applied to each image, and the difference is taken after.

The eye keeps the lightness errors

part 21
The error between a profile's nodes is a bias, not a scatter. Two quantities against the lattice size: the mean colour difference between the nodes, and the mean signed lightness error. If the interpolation erred in both directions the second would be near zero while the first was not. They lie on each other — 0.136 against 0.133 at a nine-step lattice — so the whole of what a profile does between its patches is to lighten. It errs light because a press's response is convex in ink coverage: the first drop of ink removes more light than the last, and a straight line between two points on a convex curve lies above it. At three steps 400 of 400 samples err light.

A profile interpolates light

part 21
One instrument, one uncertainty, six places on the scale. What an absolute uncertainty of 0.001 in measured reflectance is worth in lightness, at six levels from a four-colour solid to the paper. Nothing about the instrument changes between the rows: what changes is the slope of the lightness function, which is a straight line of 903 units per unit of luminance factor below a luminance of 0.0089 and a cube root above it. At the solid the uncertainty is 0.903 lightness units and at the paper 0.043 — 21 times as much, for the same measurement.

The scale hangs from one measurement

part 21
Two tables, two directions of error: 5-node ramps of four inks. For each ink, the mean signed lightness error between the nodes: of the ordinary forward table, which errs light, and of four ways to fill the inverse table, all of which err dark except the one refitted against its own objective. On cyan the forward table errs by +0.206; an inverse filled from the press by -0.317; one inverted from the ordinary table by -0.554, because it inherits the forward table's error on top of its own; one inverted from the refitted table by -0.367; and one refitted in its own right by -0.002.

The inverse table errs dark

part 22
Where an unsharp mask errs, per pixel and as seen: print, 40 cm. The upper-left corner of a patch of skin against its shadow after an unsharp mask, as two maps of the colour difference between the result taken on stored values and taken on light. Left, pixel by pixel: the corner peaks at 16.8 and the middle of the edge at 16.6. Right, after the eye's three spatial channels at a print at 40 cm: the corner is seen at 17.1 and the edge at 7.1, a ratio of 2.40. Darker is larger, on one scale for both maps.

The eye counts a corner's error, not its peak

part 22
Where a sharpened E errs, per pixel and as seen: black type on paper, 10 point. The letter E at 10 point on a 300-dot-an-inch page, black type on paper, sharpened by an unsharp mask on stored values and on light; the two maps show the colour difference between the results, pixel by pixel on the left and after the eye's three spatial channels at 40 centimetres on the right, on one scale. The thin line is the letter's outline and the dashed circles mark two pixels round each corner — 8 outer corners and stroke ends, 4 inside angles. The circled zones are 31% of the outline and hold 28% of the per-pixel error and 25% of the seen error.

Sharpened type errs on its dark side

part 23
A four-ink inverse table's error along the grey axis, 9 nodes, black from L* 60. The colour difference between a grey asked for and the grey printed, from L 92 to 14, for a 9-node inverse table whose separation strategy begins black generation at L 60 (dashed line). Three tables: filled exactly from the strategy, mean 0.073; refitted with each node sliding along the strategy, 0.050; refitted freely, 0.036. To the left of the dashed line the strategy-bound refit lies close to the filled table; to the right it lies close to the free refit. Every table is exact at its nodes, marked on the axis.

A strategy keeps the refit only where black prints

part 23
Where a sharpened serif letter's error is seen, in black type and reversed, 10 point. The serifed letter E at 10 point, sharpened on stored values rather than on light, as the eye's three spatial channels leave the difference at forty centimetres, in black type on paper and in paper-coloured type on black, on one scale. Dashed circles mark the serifs' corners: their tips and their brackets against the stems. In black type the error lies along the strokes' dark side and the serifs' corners hold little of it; reversed, it gathers round the serif tips, which hold 11 per cent of the letter's seen error against 3 in black type.

A serif moves the error and adds little

part 24
The table's cast along the grey axis, with and without a toe. A seventeen-node four-ink inverse table filled from a strategy that begins black at L* 60: the mean chroma of the grey it prints, segment by segment. Above the start every strategy is the same three inks and the cast is about 0.0126. Below it the cast falls under a tenth of that 2, 7, 12, 12 units below the start for the kinked start and toes of 10, 20 and 30 — later with a wider toe, but by less than the toe's width, and nowhere near where black takes over.

A little black ends the cast

part 24
Where a sharpened E with hairline serifs is seen to err, 48 point. The capital E with hairline serifs, a tenth of a stem thick, set at 48 point on a 300-dot page, sharpened on stored values rather than on light, as the eye's three spatial channels leave the difference at forty centimetres: black type on the left, reversed on the right, on one scale. Circles mark the serif tips and the junctions where the middle arm meets the stem. In black type the error follows the ink and gathers in the junctions' inside angles, and the serif tips hold 2 per cent of it; reversed, it spreads into the dark ground and the tips hold 6 per cent.

A hairline spills its error onto the paper

part 25
The cast segment by segment under three toes of width 20. The seventeen-node table's cast from where black begins to the floor, for the three toes and the kinked start. Above the toe's end at L 40 the shapes differ; below it the parabola and the smoothstep draw one line. Between the toe's end and L 20 the returned cast averages 1.94, 0.94, 1.94 thousandths for the parabola, the eased cubic and the smoothstep.

The cast returns where black is steep

part 25
A cap takes the shadows' cast down rather than bringing one back. The seventeen-node table's cast in each segment from L 45 to the floor, for the strategy with black from L 50 to 0.4, uncapped and under caps of 260, 240, 220 and 200 per cent. Uncapped, the cast climbs to 62.6 thousandths in the last segment; under 200 per cent the last segment casts 13.0. The segment in which each cap is first reached is the lowest point on its line.

An ink limit takes the shadows' cast away

part 26
Three weights of one letter, placed by the stem's width in pixels. The four capitals E, H, L and T at three weights — stems six, ten and fourteen cells thick on the same spacing — set in black at 12, 18, 24, 30 and 48 point on a 300-dot page, sharpened on stored values rather than on light and read through the eye at forty centimetres, pooled over four sub-pixel positions: how much of the seen error the junctions of bar and stem hold, over their share of the outline, against the stem's width in pixels.

A junction gathers by the width of its stem

part 27
What closing the counters adds, stem width by stem width. At each stem width, how much larger a share of the seen error the closed spacing's junctions and stroke ends hold than the open spacing's. The junctions gain on average 0.043 and the stroke ends 0.011; width by width the junctions' gain runs from -0.046 to 0.115.

A closed counter adds a little to a junction

part 28
Condensing and shortening each carry half of what closing the counters added. At equal stem widths, the mean gain in the junctions' share of the seen error from the extended letter to the condensed one at one height, from the tall letter to the short one at one width, and from the open spacing to the closed one, which changed both together. The first two are +0.023 and +0.023; together +0.047, against +0.043 for both at once. Each half is within one and a half standard errors of nought.

Width and height each carry half the counter's gain

part 29
A wider knee leaves the capped shadow quieter. For nine light-black separations under caps of 200 to 260 per cent on a seventeen-node table, the mean cast over every segment the cap reaches, by cap, and the mean cast of the segment where the cap is first reached, with the cap met hard and through knees of five, ten and fifteen units of lightness. The capped shadow's cast falls from 11.5 thousandths to 3.0; the binding segment's falls faster.

A knee in the ink limit quiets the shadow

part 27
Off the grey axis a knee trades hue for chroma. For a deep-blue and a brown ray of dark colours printed with four inks, the mean error the table makes between its nodes below where a total-ink cap binds, averaged over every light-black strategy and cap that binds: the chroma it loses and its hue error, with the cap met hard and through knees of five, ten and fifteen units of L*. Every wider knee lowers the hue error and deepens the chroma loss on both rays: on the blue the hue error goes from 0.021 to 0.006 and the chroma lost from 0.176 to 0.188.

Off the grey axis a knee trades hue for chroma

part 30
Doubling the nodes quarters the chroma a table loses. For a deep-blue and a brown ray of dark colours printed with four inks, the mean chroma the table loses between its nodes below where a total-ink cap binds, over every light-black strategy and cap that binds: uncapped, capped hard and through a fifteen-unit knee, on tables of 9, 17, 33 and 65 nodes. Capped hard, the blue loses 0.617, 0.174, 0.0429 and 0.0097: each doubling from seventeen nodes takes about three quarters of it away, the square of the spacing, on both rays and with or without the cap.

More nodes quarter the dulling and leave the knee a larger share

part 31
The hard cap has a corner; the knee has a bend. For the same strategy, the separation's total ink against lightness around where the cap binds: met hard, it rises to 220 per cent and stops in a corner; through the knee it rounds off over several units. The dots mark the 65-node table's nodes and the three placed ones. A straight line between nodes misses a corner by one segment's scallop and a bend by several, which is why placed nodes help the hard cap more than the knee.

Three nodes at the cap's corner cut the dulling by a third

part 32
Shared nodes fail the colours that bind below them and beat their own for the rest. For every strategy and cap on both rays, how much of the hard-cap gain its own three placed nodes buy the shared placement keeps — three nodes one, two and three units below the median binding point, L* 19.4 to 17.4 — against how far above those nodes the case's cap binds. Cases binding below them keep almost none; cases binding more than two units above keep more than all, up to 395 per cent.

Shared nodes belong in the deep shadow

part 33
Easing the cap below L* 20 halves the dulling and more. For every strategy and cap on the deep-blue and brown rays, hard and through the fifteen-unit knee, the mean chroma a 65-node four-ink table loses below the cap with the cap held and eased by a tenth and a fifth on a straight ramp from L* 20 to the floor. Eased by a fifth the blue's hard-cap dulling falls from 9.71 to 4.89 thousandths and the brown's from 9.70 to 1.30.

Easing the cap reaches the deep shadow and no higher

part 34
For the high binders a higher ramp trades one stretch for the other. For the eight cases binding above L 26, the mean hard-cap dulling below L 20, between the binding point and L 20, and over both, against where the ramp starts. From L 26 the upper stretch falls from 6.18 to 2.31 thousandths and the deep shadow rises from 3.85 to 9.33: the total stays at 5.20.

A higher ramp trades one shadow for another

part 35
A sixth gained above L* 20, most of the cure lost below it. For the eight cases binding above L 26, the dulling below L 20 and between the binding point and L* 20, with the cap held, eased straight and eased on the bent ramp. The bent ramp cuts the upper stretch from 6.18 to 5.20 thousandths and raises the deep shadow from 3.85 to 7.16.

A bent ramp takes more ink and dulls more

part 36
Read by size, the steepest ramp triples the brown's error. The same cases read by the mean size of the chroma error, overshoot and shortfall alike. On the ramp from L 17 the brown's low binders err by 15.72 thousandths against 5.04 from L 20; the blue's error is 5.19 against 5.21.

A steeper ramp cures the shadow by overshooting it

part 37
The overshoot follows how fast the cap gives ink back. For each ramp and ease, the brown ray's deepest overshoot — the most its print exceeds the chroma asked — against the rate at which the eased cap returns ink below the ramp's start. A tenth from L 17 and a fifth from L 20 return ink at the same 7.3 points a unit and overshoot by 0.013 and 0.019; a fifth from 17, at twice the rate, by 0.070.

Each dark ray wants its own ease

part 38

All essays