An average on the stored values
Assumes The budget adds two units, Colour thrown away on purpose and The mixture line bows.
Halfway between black and white there is a colour, and everybody knows which one it is: the value halfway between the two numbers. In an eight-bit file that is 128, and 128 is what every resize, every fade and every antialiased edge in an ordinary pipeline produces — a lattice point chosen by arithmetic on the storage.
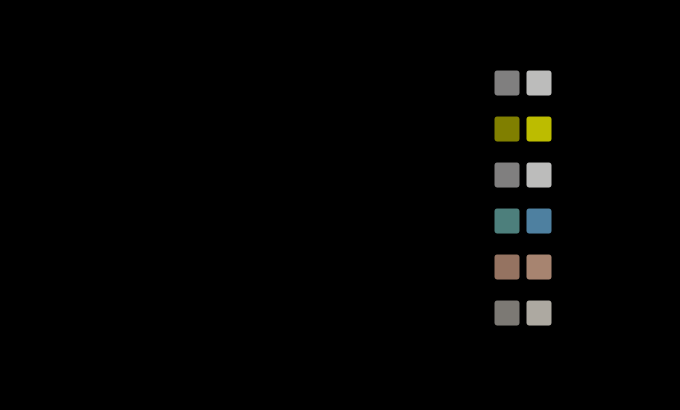
The claim
An average taken on stored values is not the average of the light, and the gap is not a rounding.
- Black against white at half lands 18.7 colour differences apart in the two versions — 22.7 units of lightness.
- The stored-value blend is the darker on every pair, always, because the encoding is concave.
- Over six ordinary pairs the mean is 15.8 and the largest is 19.3, on a red against a green.
- The worst point is not the middle. Along black to white the gap peaks at 32 per cent of the way across, at 28.6.
What the two averages are
A pixel’s stored value is not a quantity of light. It is a code, and the map from the code to the light is the transfer function — a curve with a linear toe and a 2.4 power above it, put there so that eight bits spend their codes where the eye can use them.
An average of two lights is a physical event. Cover half a region with one and half with the other, or turn both on at half strength, or stand far enough away that the eye cannot resolve them: in every case the light that arrives is the sum, and that is exactly linear in tristimulus values.
An average of two codes is arithmetic on the storage. It is what a resampling filter does, what an alpha composite does, what a mipmap does, and what a chroma subsampler does — because the values in the buffer are the codes and averaging them is one instruction.
The two agree exactly when the transfer function is a straight line through the origin, which it is nowhere.

How large it is
Black against white is the extreme case and it is worth doing in full because the numbers are famous and rarely quoted.
The code halfway between 0 and 1 is 0.5. Decoded through the sRGB transfer function that is a relative luminance of 0.214, which is L* 53.4. The light halfway between black and white is a relative luminance of 0.5, which is L* 76.1, and its code is 0.735.
So the two answers differ by 22.7 units of lightness and 18.7 colour differences, on the most ordinary operation in imaging.
The other pairs are not much better. A red against a green gives 19.3, a blue against a yellow 18.7, text on a page 16.1, a sky against foliage 15.6. The smallest is skin against its own shadow at 6.4, and it is smallest because the two colours are close together — the gap is a curvature effect and a short interval crosses less curvature.
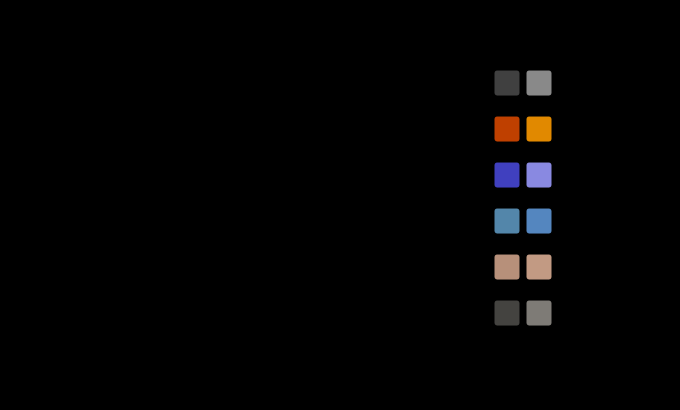
Worked, on the two extremes
Two of the six are worth doing in full because they bracket the range and because the arithmetic is short enough to check.
Black against white. The stored values are 0 and 1, and their average is 0.5. Decoded, that is a relative luminance of 0.2140 and a lightness of 53.4. The light’s own average is 0.5 of the white’s luminance, which is a lightness of 76.1 and re-encodes to a code of 0.7354. So the two answers are 128 and 188 in eight-bit terms, and they differ by 22.7 units of lightness.
Skin against its own shadow. The two are close in the encoded variable — around 0.85 and 0.32 in the red channel — and the curve between them is much less bent than it is between 0 and 1. The two answers differ by 6.7 units of lightness and 6.4 colour differences.
Between them is a factor of three and a half, and what produces it is nothing about the colours except how far apart they are on the curve. That is the same statement as the mixture line’s bow two ladders across, and it is measured here in a different variable and for a different reason: there the two paths were the physical mixture and the reading of it, and here they are two pieces of software.
The subsample, which is a different size
The fourth operation deserves its own paragraph, because it is the one this collection has already measured from another side and its number is much smaller.
A video format discards three quarters of its colour information by averaging chroma over blocks, and this collection found that the cost is small because the eye resolves fine colour detail badly. That measurement is about what is thrown away; this one is about how the averaging is done, and the two are independent.
The chroma channels are differences from luma rather than levels, so the curvature they cross is the curvature of the difference rather than of the value, and it is much gentler. The mechanism is present and the magnitude is a fraction of the others.
That makes subsampling the one of the four where the encoded average is nearly harmless, and it is the only one of the four anybody has published a number for. The three larger cases are the ones with no literature and no row in any budget.
Why it is always darker
The direction is not a measurement; it is a theorem, and having it as a theorem is what makes the finding usable.
The transfer function from code to light is convex — it accelerates. So its inverse, from light to code, is concave, and the average of a concave function is below the function of the average. Averaging the codes and then decoding therefore lands below the light’s own average, on every pair, at every fraction, with no exceptions.
Every pair in the census has a negative lightness difference and the machinery asserts it, so a version of this measurement that produced a positive one would stop the build rather than being published — which is the habit the whole collection runs on.
That has a practical consequence a reader can check without any equipment. Anything a pipeline shrinks gets darker, and the darkening is largest where the contrast is highest. A page of black text resized to a thumbnail comes out darker than the page looks; a starfield resized comes out much darker; a photograph of a face barely moves, because faces are low in contrast.

Where in a chain it happens
Four operations, and none of them is described as an average.
A resize. Every downsampling filter is a weighted average of neighbouring pixels, and in almost every implementation the pixels are the stored codes. Image libraries have offered a linear-light option for years and it is off by default in most of them, because turning it on changes every existing output.
An antialiased edge. A pixel that a shape covers half of is given half the shape’s colour and half the background’s — as codes. The edge that results is darker than a photograph of the same edge, which is why antialiased white text on black looks thinner than it should and black text on white looks fatter — a spatial effect with a colour cause.
A transparency composite. The same arithmetic with an alpha instead of a coverage.
And a chroma subsample. Every video format discards three quarters of its colour information by averaging chroma samples, and the averaging is done on the encoded chroma. That is a smaller effect than the others because chroma is a difference rather than a level, and it is the same mechanism.

None of the four appears in a delivery budget, and the largest of them is bigger than any stage that does.
Why nothing is wrong
The obvious reading is that every pipeline is broken, and it is worth arguing the other side properly, because the defenders have a case.
The operations were designed on encoded values deliberately. Averaging in the encoded variable is averaging in a perceptually flatter quantity, so an edge’s intermediate values are more evenly spaced to the eye and a gradient looks smoother. A resize in linear light produces highlights that bloom — a bright spot averaged linearly with a dark surround dominates the result, which is physically correct and looks wrong.
And the alternative has its own failure. Linear-light resizing of a photograph with specular highlights produces exactly the halos it should, and every reviewer calls them artefacts.
So the choice is a rendering decision rather than an error, and the honest complaint is not that pipelines choose wrongly. It is that the choice is undocumented, is not the same in two pieces of software, and produces a difference of eighteen colour differences on an operation nobody thinks of as a colour operation at all — which is the raw pipeline’s arrangement problem arriving at the other end of the chain.

Where the worst point sits
The peak’s position is worth having because it says which blends to check.
For pairs spanning the whole range — black to white, red to green, text on a page — the gap peaks at 32 per cent of the way across. For pairs that sit in the middle of the range — a sky against foliage, skin against its shadow — it peaks at 63 per cent.
The rule is that the peak sits where the two paths are furthest apart, and where that is depends on where the pair sits on the curve rather than on the blend fraction. A designer checking a fade at its midpoint has checked a point that is 35 per cent below the worst on one kind of pair and 40 per cent below on the other.
What it would take to fix, and what fixing it breaks
The repair is well known and its cost is worth stating, because the cost is the reason it is not the default.
Decode, average, re-encode. Three operations instead of one, on every pixel of every intermediate result. For a resize that is two transfer-function evaluations per channel per sample, which on a large image is not free but is not prohibitive either; every serious library offers it.
What it breaks is every existing output. A pipeline that switches produces different images from the same inputs, and for an organisation with an archive of rendered assets that is a migration rather than a bug fix. The same argument kept eight-bit sRGB in place for two decades after better encodings existed.
And it breaks some things that were relying on it. An antialiased font rendered on stored values has a particular weight, and type designers have been compensating for it for thirty years; switching to linear-light antialiasing makes light-on-dark text visibly heavier and dark-on-light text visibly lighter, and both look wrong to anybody used to the old rendering.
So the honest position is the one this round has reached three times already. The operation is a colour decision, both answers are defensible, the difference is large, and nothing records which was taken. The repair that is actually available is not to change the default but to say what the default is.
The one number to carry
A reader who takes one thing from this rung should take the direction rather than the magnitude.
The magnitudes depend on the pair, the fraction, the encoding and the filter, and they run from six to twenty-nine colour differences over the cases measured. The direction does not depend on any of them: an average taken on stored values is darker than an average of the light, always, because the map from light to code is concave and Jensen’s inequality has no exceptions.
That is a check anybody can run on any piece of software in a minute. Make an image of alternating black and white lines, shrink it, and look at the result. If it comes out mid-grey the software is averaging light; if it comes out dark the software is averaging codes. Almost all of them come out dark.
What was computed, and how
Each pair is two sRGB triples. The stored-value blend interpolates the encoded values; the light’s blend decodes both, interpolates, and re-encodes. Both are then converted to CIELAB through the sRGB matrix and compared with ΔE₀₀.
The six pairs are chosen to span the cases: two extremes of the cube, two device primaries, and two ordinary photographic pairs. The census is a demonstration rather than a sample — a random draw over the cube would give a mean of the same order and would say less about which cases a reader meets.

Nothing here models a real resampling kernel. A bicubic filter’s negative lobes make an average that is not a convex combination, and the sign argument above does not cover it; the effect’s size is of the same order and its direction is not guaranteed.
Where the model stops
Two-colour blends only. A real resize averages many pixels, and the gap for an average of many is set by the variance of the set rather than by the distance between two — larger for a noisy or textured region and smaller for a smooth one.
The sRGB transfer function only. A file in a wider or absolute encoding has a different curve and a different gap; the direction is the same for every encoding that is concave from light to code, which is all of them.
And no viewing model at all. The gap is measured in a matching unit between two stimuli, which is the right question for are these the same colour and not for does the resized image look right — the second needs the spatial machinery this collection has and this essay does not use.
The generalisation
The habit is about an operation that is not thought of as being about the quantity it is about.
A resize is filed under geometry, a composite under compositing, a subsample under compression. None of them is filed under colour, so none of them is reviewed by anybody who would ask which variable the arithmetic is being done in. The arithmetic is the same either way and the variable is a colour decision.
The move is to list every operation in a pipeline that averages, in any sense, and to ask of each one which variable it averages. The list is longer than it looks, and the answer is usually whatever was in the buffer.
The failure mode is not a wrong answer but an unattributed one. A resized image that is darker than it should be looks like a resized image, and the difference is never traced to the resize, because nobody is looking for a colour error in a geometric operation.
Who found it, and when
The gamma-incorrect resize is a well-known defect and has been written about at length since at least the mid-2000s; the demonstration with a scaled-down pattern of alternating black and white lines is a standard illustration and shows exactly the 22.7 units above.
What is less standard is putting the number in a colour unit and beside the other stages of a delivery chain. Eighteen colour differences on a resize is the largest single figure in this ladder, and it belongs to the one operation the chain’s own budget has no row for.
Where the ladder goes next
An average is one operation the chain performs without naming it. A rendering intent is an operation the chain names carefully — and the perceptual one is not a function of the colour at all: the same colour in two documents is delivered as two colours, and nothing in the file says which document it was in.
Where this goes next
 The mixture line bows
Grassmann's second law says an additive mixture is exactly linear in tristimulus values, and tested here it is exact to floating point. Nothing downstream of the three numbers preserves it. The physical half-and-half mixture of two colours sits a median of 5.5 colour differences from the midpoint of their two readings and up to thirty; on a green and a blue display primary it is twenty-one, which is a quarter of the distance between them.
The mixture line bows
Grassmann's second law says an additive mixture is exactly linear in tristimulus values, and tested here it is exact to floating point. Nothing downstream of the three numbers preserves it. The physical half-and-half mixture of two colours sits a median of 5.5 colour differences from the midpoint of their two readings and up to thirty; on a green and a blue display primary it is twenty-one, which is a quarter of the distance between them.
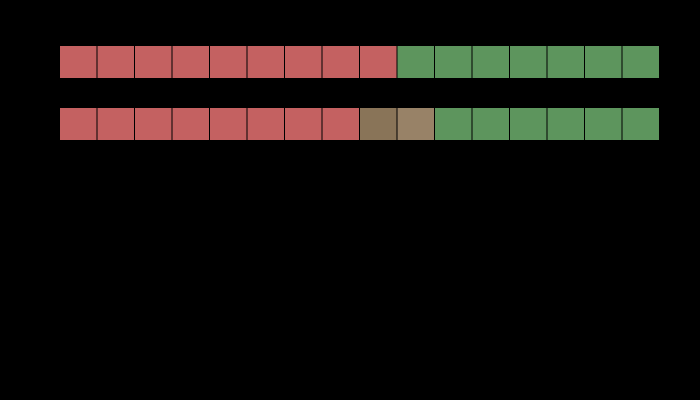 Colour thrown away on purpose
Every video format in use discards three quarters of its colour information and keeps all of its luminance, because the eye resolves fine colour detail badly. On an edge that carries luminance the loss is exactly zero. On an edge of nearly equal luminance it is a colour difference of forty-three, and the two edges are the same edge to the codec.
Colour thrown away on purpose
Every video format in use discards three quarters of its colour information and keeps all of its luminance, because the eye resolves fine colour detail badly. On an edge that carries luminance the loss is exactly zero. On an edge of nearly equal luminance it is a colour difference of forty-three, and the two edges are the same edge to the codec.
 One step has no choice
Four of a raw converter's operations can be arranged twenty-four ways. The reconstruction cannot be arranged at all — a colour matrix needs three numbers and a mosaic site has one, so filling in the mosaic is forced to the front by arithmetic rather than by convention. What is not forced is whether it happens in linear light or after the curve, and that decision costs 5.8 colour differences at an ordinary edge and nothing at all four sites away from it.
One step has no choice
Four of a raw converter's operations can be arranged twenty-four ways. The reconstruction cannot be arranged at all — a colour matrix needs three numbers and a mosaic site has one, so filling in the mosaic is forced to the front by arithmetic rather than by convention. What is not forced is whether it happens in linear light or after the curve, and that decision costs 5.8 colour differences at an ordinary edge and nothing at all four sites away from it.
What this makes readable
Essays that name this one as a prerequisite.
Named alongside this one
Essays reaching for the same objects. Nobody chose these; they are what the index of named objects makes visible.
- A stop is not a stop afterwards declared input · lightness · measurement error · specification · structural choice · transfer function
- A contrast control is three controls declared input · lightness · specification · structural choice · transfer function
- Two converters and one highlight colour management · declared input · specification · structural choice · transfer function
- A chain measured in a unit that cannot add colour management · declared input · specification · structural choice
- A mean is not a difference colour management · interpolation · measurement error · specification
- A stated lightness is two requirements declared input · lightness · measurement error · specification
What links here
The 8 essays that link to this one and share the most of its objects, of 9 that link here.
- An intent is not a function of the colour
- A profile interpolates light
- A resize with a negative weight in it
- The corner of a resized patch is lighter than its edges
- Clipped noise does not average away
- The eye counts a corner's error, not its peak
- Sharpened type errs on its dark side
- The average surface does not look average
The objects this essay names
Each one links to every other essay that touches it.
Additive mixtureColour managementDeclared inputInterpolationLightnessMeasurement errorSamplingSpecificationStructural choiceTransfer function