Concept

Chromatic adaptation — where it appears

The eye rescaling its three signals so that whatever it is looking at goes on counting as white. It is a diagonal transform in some set of axes, which means it removes exactly the part of a change of light that is diagonal in those axes and nothing else.

Named by 104 essays across 9 fields — each of them below, with the objects they name alongside it.
One reflectance, two illuminants, two colours. A reflectance peaking near 580 nm, and the colours it produces under D65 and A. The object has not changed. The light has, and colour is a property of the pair.

Constancy is the default

A sheet of paper looks white in daylight and white under a tungsten lamp, although the light reaching the eye differs enormously. The visual system is solving one equation with two unknowns, and it solves it by assumption.

brain · Appearance
Four adaptation transforms, measured against CAT16 (D65 to D50). Twenty-seven colours moved from D65 to D50 by each transform, compared with the current recommendation. Bars are the worst disagreement in CIELAB, the number beside each is the mean. Plain XYZ scaling — still shipping, still called von Kries by people who have not read von Kries — misses by up to ΔE 13.7, which is many times any tolerance a supplier would be held to.

Four ways to move a white point

Every chromatic adaptation transform is the same three lines with a different matrix. The matrices disagree by more than any tolerance a supplier is held to, and the oldest one — still shipping, still called von Kries — is not a cone basis at all.
brain · Appearance
The process inks as reflectance. Each ink is a sum of Gaussian absorbance bands with stated centres, widths and peak densities, and the reflectance shown is the substrate's times the square of the ink's transmittance, because light crosses the film going down and coming back. The first band of each ink is what it is for; the rest are what is wrong with it. Magenta's unwanted absorption in the blue-violet reaches an optical density of 0.46 against 0.95 for the band it exists to have — 48 per cent of its own strength, absorbing exactly where a saturated blue needs light to survive.

The paper is the white point

A printed colour is reported against the sheet it sits on rather than against the light in the room, and the choice is a switch in every colour engine. Flipped one way, the same separation on coated stock and on newsprint is a 3.04 colour difference; flipped the other, it is 0.13 — and the two answers are about different questions.

applied · Delivery
Mixtures of 2700 K and 6500 K, on the diagram colour temperature is defined on. Both sources are Planckian radiators, so both sit exactly on the locus. Every mixture of them lies on the straight line between them, because mixing is addition and chromaticity is a projection of it — and the locus is curved, so the line is a chord. The equal mixture sits -0.0064 off the locus at a correlated colour temperature of 3953 K: a light that is measurably pink, specified by a number that says nothing about it.

Two lamps do not average

Light adds, band by band, and every number a lamp is sold by is a projection of the sum rather than a sum of the projections. Two radiators sitting exactly on the Planckian locus mix into a light that is measurably pink; two poor lamps mix into a better one than either.
light · Light
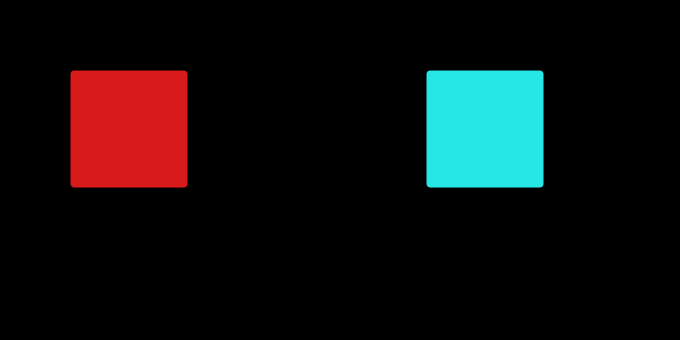
One adapting colour, two answers. The left patch is what was stared at. The middle is the afterimage the cone-gain arithmetic predicts at 15 per cent adaptation; the right is the inverted code values. They are 22.1 ΔE00 apart. The gains that produced the middle patch are 0.95, 1.06, 1.69 on the long, medium and short cone classes — the reciprocal of what each class had been receiving, taken 15 per cent of the way.

An afterimage is an adaptation

The demonstration everybody gives is an inverted image, which is a statement about a file format. Running the receptoral arithmetic instead puts the afterimage of a saturated red sixty degrees of hue away from the inverse — and outside what any display can show.

brain · Appearance
How far a judgement is from the settled one, second by second. The light changed from one white to another at t = 0 and nothing else moved. The model has one degree of adaptation and no clock, so the distance plotted is what a clock adds: 3.6 CAM16-UCS units half a second in, still 1.3 after a minute, and 0.11 after five. Every appearance number on this site is the value at the right-hand end.

The model has no clock

An appearance model takes a stimulus and a situation and returns what it looks like. It does not take a time, and adaptation is not instantaneous — half a second after the light changes a judgement is three and a half CAM16-UCS units from the settled one, and a minute later it is still 1.3.

limits · Limits
Colour temperature, and the number nobody quotes beside it. The Planckian locus in the 1960 UCS diagram — the only diagram on which correlated colour temperature is well defined — with four sources and the perpendicular from each to its nearest point. The temperature is where the foot of the perpendicular lands; Duv is how long the perpendicular is. halophosphate sits 0.0246 off the locus at 4513 K, which is a visible green cast that its colour temperature does not mention.

White is a region

A lamp is not sold as a chromaticity. It is sold as 4000 K, and what that means is that its chromaticity fell inside a quadrangle — which two lamps can occupy at opposite corners, eleven ΔE00 apart. In a room with either of them, the same twelve surfaces differ by one unit.
light · Light
An afterimage, as the local pool coming back to equilibrium. The local pool has adapted to the patch and the global pool has not, so the gain change is exactly the local share of a full von Kries change — which is why afterimage's free strength parameter is not free here. The dwell is 20 seconds. The swatches are the predicted appearance of the test surface at four moments. They are predictions of hue and direction; there is no response compression in this model, so the chroma is a ceiling rather than an estimate.

A gain has a time constant

An afterimage and the clock on chromatic adaptation were built in different files from what the last phase said was one mechanism. Joining them removes a free parameter, reproduces both, and predicts a third thing — that two people in one room, at one moment, looking at one patch, do not agree about its colour.

brain · Appearance
The eye's own drift, and what it does to every spatial frequency. A pattern of f cycles per degree, drifting across the retina at 0.5 degrees a second, arrives at each receptor at f × 0.5 hertz. The curve is the temporal sensitivity at that rate, against the pattern's spatial frequency. Every frequency the eye can resolve stays above a quarter of the temporal peak, and the band of drift speeds for which that holds is 0.02–0.71 degrees a second — with the measured drift inside it. Faster and the finest detail is carried past 60 hertz, where there is no sensitivity at all.

The eye is never still

A perfectly stabilised retinal image disappears within seconds. What keeps the world there is a drift of about half a degree a second between the microsaccades — fast enough to keep the finest detail modulating and slow enough not to carry it past fusion, in a band whose upper edge is at 0.71 degrees a second.
brain · Appearance
One light, two eyes. The same stimulus through two sets of ocular media differing only in macular pigment (0.35 and 0.41) and lens age (55 and 55 years). Compared under one white the two differ by ΔE00 1.00; compared with each eye adapted to its own long-run white — which is what the visual system does — by 0.00. The second number is why nobody notices, and the first is why a person who has had one lens replaced reports that the other eye has turned yellow.

Nobody here has two eyes

One person's two eyes differ in macular pigment and lens density, so the same light produces two colours — a whole ΔE00 apart for an ordinary pair, seven for one replaced lens. Adaptation hides it exactly, which is why nobody notices and why nothing in colorimetry has a term for it.

limits · Limits
Coming back from a bleach, against the clock already measured. A 94 per cent bleach, and the pigment returning at its own time constant of 120 seconds. The lower curve is the site's slow neural adaptation constant, 60 seconds, started from the same place — it is finished while the chemistry is barely half done. Regeneration does not speed up because the light went away: the rate constant is the same one it always was, which is why the recovery is slow while the bleaching was fast.

The slowest clock is chemical

An earlier essay here joined the afterimage to the adaptation clock and named what was still missing — a third gain, upstream of both, in the pigment itself. It is twice as slow as anything measured before it, it leaves a coloured after-tint from a white field, and at steady state it cancels exactly, which is why nobody has ever needed to model it.
eye · Cones
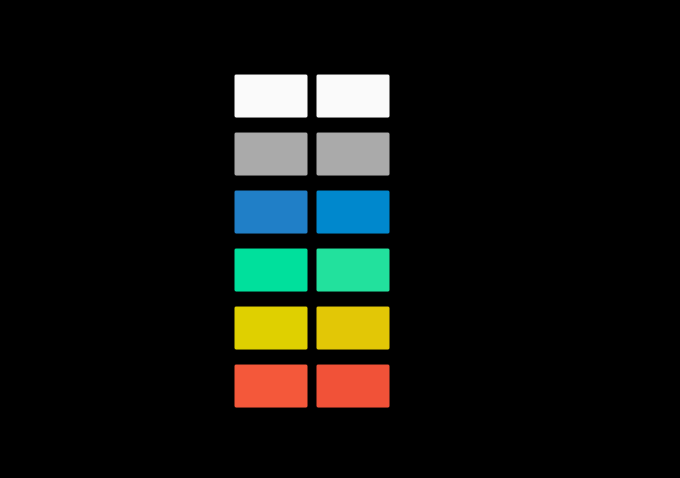
What the same eye reports about one field, in the middle and at the edge. Each row is a uniform field, drawn at the most saturated version of itself this page can show — the percentage is how much of the full stimulus survived, the rest being the adapting light added to bring it inside the gamut. The left patch is what the centre of gaze reports and the right one what 10 degrees out reports, each adapted to the same light as that position sees it. The adapting white comes out identical to 5e-13, because an adapted eye cancels its own filter exactly. Nothing else does, and the largest difference is in the blue. tungsten light is not drawn: it cannot be shown at any useful saturation, and at full strength it differs by ΔE00 1.87.

One person is two observers

The macular pigment is a yellow screen over the fovea and nowhere else, so a cone at the centre of gaze and a cone ten degrees away have different colour-matching functions in the same eye. A match made in the middle comes apart at the edge by six units — and fitting one filter to the gap between the CIE's two standard observers gives a density of 0.40 against a measured 0.35.

eye · Cones
A surface in a room, from the moment the light goes on. How far a blue surface is from the colour it will settle at, second by second, for an observer who walked in from the snow as the lamp was switched on. It starts ΔE00 27 away, is still 6.1 away after a minute — the point at which the eye is conventionally said to have adapted — and does not fall under a unit until 295 seconds.

The room settles after the eye does

Four clocks run in a room and only three of them are in the observer. The slowest is the lamp, which takes four hundred seconds to reach nine tenths of its colour change — so a minute after the light goes on, when the eye is conventionally said to have settled, most of what is left is the lamp, and three quarters of that could not be adapted away by an observer of any speed.

light · Light
The appearance model's three rooms, read as three moments. CIECAM16's degree of adaptation is a function of the surround and the adapting luminance and of nothing else — the model has no time in it. Solving for the moment at which an observer who will adapt completely has got that far turns each of the three tabulated surrounds into a reading on a clock. At 100 candelas per square metre they are 106, 49, 21 seconds. They are presented as three rooms. They are also one observer, in one room, at three times in the first two minutes.

A viewing condition is a moment

CIECAM16's degree of adaptation is a function of the surround and the adapting luminance and of nothing else, because the model has no time in it. Solving for when an observer who will adapt completely has got that far turns the standard's three surrounds into three clock readings — 107, 50 and 21 seconds — and the two readings are distinguishable by waiting.

brain · Appearance
How much of the gamut changes name, and what changed it. The eleven basic terms are quoted as centroids in CIELAB, and a colour is named by which one it is nearest. Two things nobody records decide the answer. Changing the distance function renames 20.5 per cent of the displayable gamut. Changing the room — the same colours, the same words, a different surround, through the appearance model — renames up to 26.8 per cent. The centroids were measured in one viewing condition and are applied here in every essay as though a name were a region of a space with no room in it.

A name moves with the room

Eleven basic colour terms are quoted as centroids in CIELAB and a colour is named by which one it is nearest. Two things nobody records decide the answer — which distance function is used, which renames a fifth of the displayable gamut, and which room the colour is in, which renames more than a quarter of it.

brain · Appearance
A corner moves the spectrum and the viewing condition at once. A coloured patch in a corner of coloured walls, against how enclosed the corner is. The top curve is what a colorimeter set up at the door reports: light that has bounced carries the surrounding reflectance again, so the patch is lit by something the room is not. The middle curve is what is left once the patch is read against the corner's own white — most of it goes, because a corner is a change of illuminant and that is what chromatic adaptation is for. The bottom curve is the other thing a corner is: a brighter place, 1.76 times the light, which moves the appearance through the Hunt effect with the white point held still and cannot be adapted away at all.

A corner moves both terms

The interreflection essays compute what a corner does to a spectrum, which is one of the two things a corner does. It is also a brighter place with a differently coloured background — a viewing condition, not a stimulus — and adaptation removes most of the first and none of the second. At an enclosure of six tenths that is 63 per cent of seven units gone and a further unit arriving from the extra light alone.

scene · Scene
Every change of light this site models, and how much of it a gain removes. Each row is a change of illumination. The pale bar is how far it moves an ordinary surface for an observer who does not adapt; the solid bar at its left end is what is left after the observer has applied the one gain adaptation gives them, which is the ratio of the two whites in the CAT16 basis and is not fitted to anything. Sorted by the fraction left rather than by the size of the change, because the two orderings are different: the largest change here is removed almost entirely and the worst row is a change less than a third its size.

What no adaptation can remove

A change of light is exactly a 3×3 matrix on tristimulus values, and adaptation is a diagonal one. Putting every change of illumination this site models through that distinction sorts them by how much of themselves they leave behind, and the smallest residual in the census belongs to a filter inside the eye.

limits · Limits
Every published adaptation transform, and one computed from daylight, on every change. What each basis leaves an adapted observer with, row by row. Darker is worse. The last column is not a published transform: it is the basis in which a change from D65 to D50 is exactly diagonal, computed in closed form from the two spectra with nothing fitted. It is far the best on the daylight rows and it is beaten on the discharge lamps, which is the trade the published transforms are sitting in — they were fitted to data containing both kinds of light and are therefore optimal for neither. Over the census as a whole the winner is Bradford at ΔE00 1.14.

A gain needs a basis

Adaptation scales three signals, and which three is a choice. The basis in which a change from D65 to D50 is exactly diagonal can be computed in closed form from the two spectra, it beats every published transform on daylight by a factor of five, and it loses to all of them on a fluorescent tube.

brain · Appearance
The same census, sorted by where the change of light came from. Each row is a change of illumination. The pale bar is how far it moves an ordinary surface for an observer who does not adapt; the solid bar at its left end is what is left after the observer has applied the one gain adaptation gives them, which is the ratio of the two whites in the CAT16 basis and is not fitted to anything. Sorted by where the change came from. The two kinds of light that existed before electricity sit at the top and leave the smallest share of themselves behind; the discharge lamps are worse, and the worst of them is d65 to a triphosphor tube at 33 per cent.

Which lamp changes are free

The changes of light that existed before electricity commute with one another to a couple of parts in a thousand, so one set of axes handles all of them. The lights the lighting industry invented do not, and the worst pair in the census is seventy-six times further from commuting than the best.

light · Light
The same wall, applied once and applied twice. A room lit by light that has bounced off its own walls is a change of illumination like any other, and a corner is the same change applied twice. Squaring a reflectance sharpens it, a sharper change of light is further from being a gain, and the residual an adapted observer is left with therefore grows faster than the change does: the second bounce is 1.33 times the change and 1.96 times the residual. This is the adaptation half of what a corner does to a metameric match.

The same wall applied twice

A bounce off a painted wall is a change of illumination, and adaptation handles it about as well as it handles a change of colour temperature. A corner applies the same reflectance twice, which sharpens it — and leaves an adapted observer with 1.96 times as much for a change only 1.33 times as large.

scene · Scene
The share of itself each change leaves behind, and the smallest is inside the eye. The residual as a fraction of the change rather than as a colour difference, which sorts the census differently. At the top is the macular pigment — the filter in front of the central few degrees of one's own retina — leaving 2.4 per cent of itself. It is a fixed transmittance multiplying the light and the white together, which is as close to a pure gain as anything here gets, and it is why nobody notices they have one.

The filters inside the eye

The macular pigment leaves 2.4 per cent of itself after adaptation — the smallest share of anything in this site's census of light changes, and less than half the next smallest. Fifty years of lens yellowing leaves 7.9 per cent, and the difference between the two says what a gain is actually good at.

eye · Cones
The basis a camera balances in is a different basis for every light. A camera's white balance is a per-channel gain on raw values, which is a von Kries adaptation in whatever basis the filter dyes give it. That basis is not a property of the dyes alone: it is the dyes and the light in the room, and it moves when the light does. Each bar is how far the basis has turned, in degrees, from where it sits under D65. A sensor satisfying the Luther condition would have a bar of exactly zero on every row, because for such a sensor the light cancels — which is the one property nobody buys a sensor for.

A camera balances in another basis

White balance is a per-channel gain on raw values, which makes it a von Kries adaptation in whatever axes the filter dyes happen to give. Those axes are not a property of the dyes alone — they move with the light, by up to seventeen degrees across the adaptation census — and the sensor for which they would not move is the one that adapts worst of all.

imaging · Capture
Media-relative colorimetry is a von Kries adaptation in the worst basis there is. Changing the paper is a change of the light reaching the reader, and the rule colour management uses for it — divide the tristimulus values by the substrate's — is a gain applied in XYZ. That is the one transform the table here describes as the oldest mistake still shipping. On the three stocks a press actually uses the penalty is real and small, because a sheet of paper-mill white is the smoothest change of light in the census. On blue it is 10.2 times the residual the same rule would leave in a cone basis.

Dividing by the paper

Media-relative colorimetry divides tristimulus values by the substrate's, which is a von Kries adaptation applied in XYZ — the one basis the table here describes as the oldest mistake still shipping. On a paper-mill white it costs a few hundredths of a unit. On a tinted sheet it costs ten times what the same rule costs in a cone basis.

applied · Delivery
A tolerance of one unit, re-measured under every light in the census. Every one of the 23 pairs behind this figure is at exactly ΔE00 1.000 under D65 by construction. Each bar is what those same pairs measure under another light, after the observer has adapted to it: the line is the median and the bar spans the pairs. A tolerance is written as a property of a pair and it is not one — the light multiplies both members, and the difference between two products is not the product of the difference. The widest row is a lens at twenty against a lens at seventy, spanning 0.81 to 1.57.

One unit in another room

Twenty-three pairs built at exactly ΔE00 1.000 under D65, re-measured under every change of light this site models with the observer adapted to each, come out anywhere between 0.64 and 1.57. A tolerance is written as a property of a pair and it is a property of a pair and a room.

difference · Metric
Three ways to dim a lamp, and only one of them is free. What an adapted observer is left with, as the same lamp is taken down to one per cent by each of the three methods. Duty-cycle dimming lies exactly on zero at every depth: it scales the spectrum, a scaling is a gain in every basis, and adaptation removes all of it. Current dimming moves the pump and the phosphor apart and leaves 0.15 at a tenth. A filament follows the Planckian locus, which is the largest chromaticity change of the three and leaves 3.63 — the ordering by chromaticity and the ordering by what a person sees are not the same ordering.

Only one dimmer is invisible

An earlier essay separated the three ways to dim a lamp by the chromaticity each arrives at. Asked instead what an adapted observer is left with, the ordering is different and one method comes out at exactly zero — a duty cycle is a scaling, a scaling is a gain in every basis, and adaptation removes all of it at every depth.

light · Light
Four devices, and what each of them can do about a change of light. The mean over the census of what each device is left with. A press has no mechanism, so its number is the whole change — a printed sheet does not adapt to the room it is read in. A display can move its white point, which is a gain in its own primaries. A camera applies a gain in whatever basis its filter dyes happen to give it. And the sensor that satisfies the Luther condition exactly is worse than the silicon one — satisfying the condition means its channels are the matching functions, and a per-channel gain on the matching functions is the transform this site calls the oldest mistake still shipping.

Only one of these devices adapts

An eye, a camera, a display and a press all meet the same changes of light, and each has at most one thing it can do about them. The press has nothing at all, so its column is the whole change; and this collection's sensor built to satisfy the Luther condition exactly is the one that adapts worst.

limits · Limits
A camera matrix fitted under each light, used under each light. Mean ΔE00 over the same surfaces, with the matrix fitted under the row's light and the scene under the column's. The diagonal is what a profile's data sheet quotes and is between 1.0 and 1.2 everywhere. Off it the numbers rise steeply: the matrix fitted under illuminant A reports 1.17 there and delivers 9.34 under a 9000 K daylight, a factor of 8.0. Nothing about the camera changes between cells.

A matrix is fitted under one light

A camera's colour matrix is nine numbers determined by a chart photographed under a particular illuminant, and the error it quotes is the error under that illuminant. Fitted under a tungsten lamp and used under a cold sky it delivers eight times as much — and the two-matrix scheme every real profile uses turns out not to be a compromise at all.

imaging · Capture
Where each published matrix puts the confusion points, whether or not it meant to. Every matrix from tristimulus values to cone responses commits itself to three confusion points, because the point is the direction the other two rows annihilate. The first row is the construction from the measured points and returns them exactly. The rest were chosen for other reasons and land elsewhere — Hunt–Pointer–Estévez, which this collection uses everywhere, misses the deuteranope's point by 1.28 in chromaticity. The worst here is 4.09.

The cones an appearance model uses

CIECAM16 adapts in three axes whose rows are labelled L, M and S, and they were fitted to corresponding-colour experiments rather than measured on receptors. Run the dichromat construction backwards on them and they commit to a deuteranope confusion point 1.45 away in chromaticity from the measured one — which is a test the axes were never asked to pass.

brain · Appearance
Four different bases, one adaptation model, one number. The middle row of the basis built from the confusion points multiplied by 0.21, 1, 3.7 and 11 in turn, with the resulting adaptation residual drawn as a bar in each case. The four bars are the same height to 9e-16 of a ΔE00, because the row's scale cancels exactly between the gain and the inverse. Three of the nine numbers a colour match leaves free are invisible to an adaptation model, which is why the six the dichromat data supply determine it outright with nothing left to fit.

The three numbers a gain cannot see

Colour matching leaves nine numbers free. Three dichromat confusion points fix six of them and three choices of unit fix the rest — and it turns out that a von Kries gain is exactly blind to those last three. So the dichromat data do not merely constrain an adaptation basis. They determine it, with nothing left over to fit.

eye · Cones
How cone-like a basis is, against how well it adapts. Each basis placed by how far its own implied deuteranope confusion point falls from the measured one (horizontal) and by how much an adapted observer is left with in it (vertical). The construction from the confusion points sits at zero on the horizontal by definition and near the top on the vertical. Nothing near the left of the picture is near the bottom: the closer a basis is to the receptors, the more a von Kries gain leaves behind. The unconstrained winner sits at 1.63 on the horizontal, further from the measurement than any published transform except CAT02 and Bradford.

The best axes are not receptors

If the axes that make a von Kries gain work were nearly the cone fundamentals, the published adaptation transforms would be cone-like and their departures would be slack in a fit. They are not. Minimise the residual over all nine free numbers and the winner sits further from the measured dichromat confusion points than any of them.

eye · Cones
Every basis against both objectives at once. A scatter with the mean adaptation residual across the illumination census on the horizontal axis and the mean axis ratio of MacAdam's ellipses in a lightness–chroma space on the vertical. Lower is better on both. The two winners sit at the two ends of an empty diagonal: the basis that adapts best leaves 7.70 on the vertical and the basis that discriminates best leaves 1.79 on the horizontal, each worse on the other objective than every published transform. The basis built from the dichromat confusion points is at (1.65, 2.60) — best at neither and within a factor of two of both floors, which no other entry in the picture manages.

No basis is good at both

The same nine numbers decide how well a von Kries gain reproduces a change of light and how nearly a lightness–chroma space makes the discrimination ellipses circles. Minimise either one and the other collapses. The basis built from the receptors is best at neither and is the only entry in the table respectable at both.

brain · Appearance
How far from circles every basis leaves the ellipses. Eight bases ranked on the mean ratio of the long to the short axis of MacAdam's twenty-five discrimination ellipses, measured in a lightness–chroma space built on that basis. The range runs from 1.61 for best for discrimination to 7.70 for best for adaptation. The ordering is not the ordering on the other objective and is nearly its reverse.

One matrix doing two jobs

CIECAM16 adapts in CAT16 and then applies its response compression in the same axes, so a single matrix decides both how well the model handles a change of light and how uniform the space it produces is. The two jobs have different best answers, and the matrix was chosen against only one of them.

brain · Appearance
Every change of light in the census, under three bases. Fourteen changes of illumination, each drawn three times: the residual left by a gain in the basis built from the dichromat confusion points, in CAT16, and in the basis that minimises the average. The ordering between the three is the same on nearly every row, and — the part an average hides — the worst row is the same row for every basis nobody fitted, which is two bounces off the same wall. The difficulty belongs to the change rather than to the choice of axes — except for the fitted winner, whose worst row is D65 to a triphosphor tube instead. What a fit buys is not a uniform improvement; it is the abandonment of the one change everybody else is beaten by.

Which changes of light pay for it

A fitted adaptation basis beats the receptors by 0.68 units on average, and an average is a poor description of what it does. On six of fourteen changes of light it is worse, and the whole of its advantage comes from four — a tungsten lamp and three coloured walls.

light · Light
Every change of light in the census, under three bases. Fourteen changes of illumination, each drawn three times: the residual left by a gain in the basis built from the dichromat confusion points, in CAT16, and in the basis that minimises the average. The ordering between the three is the same on nearly every row, and — the part an average hides — the worst row is the same row for every basis nobody fitted, which is two bounces off the same wall. The difficulty belongs to the change rather than to the choice of axes — except for the fitted winner, whose worst row is D65 to a triphosphor tube instead. What a fit buys is not a uniform improvement; it is the abandonment of the one change everybody else is beaten by.

Everyone is beaten by the same wall

Eight candidate adaptation bases, fourteen changes of light, and seven of the eight have their worst row in the same place — not a lamp, but a green wall reflecting twice. The one that does not is the one that was fitted, and what its fit bought was permission to give up on that row.

light · Light
Three published primary sets, and a fourth chosen for how it adapts. The spectral locus with four triangles inside it. sRGB covers 33.5% of the diagram and leaves an adapted observer 2.36 ΔE00; Display P3 covers 45.4% at 1.22; Rec. 2020 covers 63.3% at 1.09. The fourth triangle is the best adaptation basis available to a display asked to cover 63.5% of the diagram, at 1.02 — and it is a different triangle from Rec. 2020's rather than a smaller one. The largest triangle that fits at all covers 73.9%, which is where the axis of this argument ends.

Primaries chosen for their inverse

Moving a display's white point is a gain on its R, G and B, so a display adapts in the inverse of its own primary matrix — a basis chosen by committees for gamut coverage and phosphor availability. Pose the design problem properly and the answer costs one per cent of the gamut argument and reaches within two per cent of the best basis there is.

applied · Delivery
A display's primaries, scored as the adaptation basis they are. Four primary sets ranked by the mean ΔE00 an adapted observer is left with when the white point moves — which for a display is a gain on R, G and B, and so a von Kries adaptation in the inverse of its own primary matrix. sRGB leaves 2.36, as much as scaling XYZ directly and therefore as much as having no cone basis at all. Rec. 2020 leaves 1.09, better than every published adaptation transform fitted to corresponding-colour data. Nobody chose that: it is what wanting a wider gamut does to a primary's spectral selectivity.

The gamut race chose the basis

Twenty years of arguing about how much of the diagram a display should cover has produced primaries whose inverse is a better adaptation basis than any transform ever fitted to corresponding-colour data. On the invariant count of what those displays can actually show, the same twenty years produced nothing at all.

matching · Gamut
The dyes a camera has, and the dyes an adaptation basis would want. Three sensor sensitivities drawn twice: faintly, the silicon-and-filter-array set this collection models, and boldly, three Gaussian dyes chosen to make the inverse of their own response matrix a good basis for a white-balance gain. The designed dyes sit at 610, 542, 449 nm with widths of 35, 26, 30 nm — narrower and further apart than the real ones, which is what sharpening looks like when a search rather than a committee does it. They leave 0.97 ΔE00 against the real sensor's 1.62, and they are held within 0.28 of the Luther condition so that the result is still a camera.

A sensor designed for its inverse

A camera's white balance is a gain in a basis made from its own dyes and the light in the room. Choose the dyes for that basis instead of for cost and quantum efficiency, hold the sensor within a stated distance of the Luther condition, and the design reaches the best adaptation figure any basis achieves — and then the room moves it.

imaging · Capture
Four cameras that all satisfy the Luther condition exactly. Four sensors whose sensitivities are linear combinations of the colour-matching functions — the theoretical ideal, satisfying the condition to machine precision, each with an adaptation basis that does not move when the light does. They differ only in which linear combination, which the condition does not constrain, and they leave 2.46, 0.97, 1.65, 2.37 ΔE00 after a white balance. The best of them reaches 0.974, which is the best any basis at all achieves. Being a perfect colorimeter costs nothing in adaptation; what costs is the mixing matrix, and the control measured here carries one nobody chose.

The condition chooses no axes

It has long been said here that a sensor satisfying the Luther condition exactly adapts worse than a silicon one, and offered a reason — that its channels are the matching functions, and a gain on those is the oldest mistake in the subject. The measurement was of one sensor. The condition leaves the axes entirely free.

imaging · Capture
The same optimum, along its narrowest direction and its widest. The adaptation objective along two straight lines through its own minimum, both of unit length in the nine coefficients. Along one of them the cost rises steeply; along the other the same step costs 8.0 times less, and a design constrained to move that way gives up almost nothing. That is why restricting the nine numbers to be the inverse of three realisable primaries — three degrees of freedom gone — costs about one per cent, while requiring them to hit the three dichromat confusion points costs seventy. Counting what a constraint removes predicts neither number; what matters is which way it points.

A constraint costs what it points at

Three primary chromaticities remove three of the nine numbers in an adaptation basis and cost one per cent. Three dichromat confusion points remove six and cost seventy. Counting what a constraint removes predicts neither, because an optimum is a long bowl and what matters is which way the constraint points.

limits · Limits
The points a ratio needs are proportional to the ratio. A scatter of 133 points on logarithmic axes, one per MacAdam ellipse under each of six coordinate systems. The horizontal position is that ellipse's true axis ratio; the vertical is the smallest sample size, from a sequence of doublings, at which the sampled ratio comes within one per cent and stays there. A line of slope 0.94 runs through them, against a predicted 1 — the minimum's notch is 0.88 σ₂/σ₁ radians wide, so resolving it takes a number of points proportional to σ₁/σ₂, and nothing about the basis or the ellipse enters beyond that. An ellipse with a ratio of two needs seventeen points and one with a ratio of twenty-six needs a hundred and ninety-two.

An extremum is not a sample

Three separate measurements in this collection took a maximum or a minimum over a sample of a set — forty-eight points round an ellipse, twenty-four directions out of an optimum, fourteen changes of light off a list. All three are wrong, all three are wrong in the same direction, and the error in each grows with the very quantity being measured.

limits · Limits
Nine eigenvalues, six of which exist. Nine points on a logarithmic vertical axis: the eigenvalues of the Hessian of the adaptation residual at its own optimum, largest to smallest. The first six run from 6.8×10² down to 7.6×10⁻¹, a condition number of 890. Then the axis drops: the seventh is 1.9×10⁻⁴, and the last three are separated from the sixth by a factor of 4.0×10³. Those three are not small curvatures. They are the finite-difference truncation error on directions along which the objective is exactly constant, and a shaded band marks them as the numbers the objective does not have.

The rank is the invariance

A von Kries gain cannot see the scale of a row of its basis. That is an identity, proved in a line, and it can be measured instead — as the rank of a second-derivative matrix. Both objectives this collection minimises over the observer's nine free numbers have a Hessian of rank exactly six, and the three directions they cannot see are the three scalings, to a hundredth of a degree.

eye · Cones
The bowl the eigenvalues describe and the bowl a sample found. Six points on a logarithmic vertical axis — the distance from the optimum of the adaptation residual to a 5 per cent rise along each of the six directions the objective can see — with a shaded band behind them showing the whole range 24 random directions reported. The eigen-radii run from 1.2e-2 to 3.6e-1, a factor of 29.8. The band runs from 2.2e-2 to 1.8e-1, a factor of 8.0, and sits entirely inside the ends of the true range: a random direction in nine dimensions carries a share of every eigenvector and so reports the middle of the bowl, never an end of it.

How long is the bowl

The optimum of an adaptation objective is twenty-nine times longer one way than another, and the two ends have names — the stiffest direction is almost entirely the short-wavelength row of the basis, the flattest almost entirely the long-wavelength one. Twenty-four random directions reported a factor of eight, and no number of them would have done better.

matching · Gamut
What a constraint costs is how far it pushes, in the directions that are seen. A scatter of every constraint imposed here on the nine free numbers. The horizontal axis is the length of the displacement from the optimum measured only in the six directions the objective can see; the vertical, on a logarithmic scale, is the excess cost that displacement actually carries. Requiring the basis to be the inverse of three realisable display primaries sits at the bottom left, at 0.068 and 0.022 ΔE00 — it removes three degrees of freedom and moves the answer almost nowhere. Requiring it to hit the three dichromat confusion points removes six and pushes 13 times as far, for 0.68. The vertical spread at similar horizontal positions is the part a count of parameters cannot predict.

A constraint is a direction and a distance

Four restrictions on the same nine numbers cost nothing, nothing, two per cent and seventy. How many parameters each removes predicts none of it. What does is the quadratic form evaluated along the displacement — and showing that it does means walking in towards the optimum rather than arguing at the edge, because at the edge the prediction is out by a factor of three.

limits · Limits
The cheapest direction to give ground in is the flattest one. Six bars, one per direction the adaptation objective can see, showing how much of the other objective a fixed budget of adaptation buys if it is spent along that direction. The rate is the slope of the second objective divided by the square root of the first's curvature, so it rewards a direction the second objective wants and punishes one the first is stiff in. The flattest direction wins at 10.68 against 3.29 for the next best and 0.54 for the stiffest — a factor of 20. Spending 1 per cent of the adaptation optimum there moves the anisotropy from 7.70 to 5.02.

The trade only runs one way

Standing at the basis that adapts best, one per cent of adaptation buys forty-four per cent of the way to the discrimination floor. Standing at the basis that discriminates best, the same one per cent buys under two. The scatter that shows two objectives pulling apart looks symmetric and is not, and the asymmetry is what a committee choosing between them would most want to know.

brain · Appearance
The worst case is wherever the box stops. Four horizontal tracks, one per parameter of a painted wall. Each track spans the range an ordinary paint is allowed to occupy, with a second, wider range drawn behind it, and two markers show where the search for the worst change of light came to rest under each. Under the narrower box the answer sits on the wall in centre and width; under the wider one, in centre, width, base. The residual rises monotonically towards a narrower notch at a shorter wavelength on a darker wall, so there is no interior maximum to find. The worst change of light is 21.3 ΔE00 under one box and 28.4 under the other, and the census's own worst row is 3.37.

The worst case is where the box stops

The worst change of light this collection quotes is two bounces off a green wall, and it is the worst of fourteen changes somebody wrote down. Searching the family those fourteen were drawn from reaches six times further — and does not stop, because the residual rises monotonically towards a narrower notch on a darker wall. There is no worst case in this family, and the number anybody quotes for one is a number about their own constraint.

scene · Scene
Best on the average, undefined at the edge. Two rows of bars sharing one set of labels. On the left, each adaptation basis's mean residual over the fourteen changes of light the census lists — Bradford is the shortest bar at 1.14 ΔE00 and is what colour management uses. On the right, the same bases against the worst change the same family of painted rooms can produce. Three of the five have no bar there at all, marked instead with the gain that replaced it: under a deep narrow notch their reading of the white passes through zero, so the diagonal is a division by nothing and the model stops being defined rather than merely doing badly. Bradford's middle gain reaches -1.0e+19. CAT16, which exists because CAT02 was withdrawn for going negative in practice, is one of the two that survives.

Best on the average, undefined at the edge

Bradford has the lowest mean residual of any adaptation transform over the census of illumination changes, which is why colour management uses it. Inside the family that census was drawn from, its middle row's reading of the white passes through zero — so the gain is a division by nothing, and the model stops being defined rather than merely doing badly. CAT16, which exists because its predecessor did this, does not.

applied · Delivery
What the confusion points charge, across a population. A histogram of 200 members of a population of eyes, each scored by what the adaptation basis their own confusion points determine leaves after the gain. It runs from 1.22 to 2.24 ΔE00 with a median of 1.78. Vertical marks show the unconstrained floor at 0.97, the published transforms, and the single observer this site quotes at 1.65. The distribution straddles Hunt–Pointer–Estévez and reaches below CAT16: 18 per cent of members are better served by their own receptors than by a matrix built to make a gain behave, and 2 per cent than by the current recommendation.

The price is also the person

The receptor construction costs seventy per cent above the unconstrained floor, which is a number usually quoted as a property of the construction. Propagated across a population of eyes it runs from a quarter above the floor to a hundred and thirty per cent above it, and the population's own spread is wider than the entire gap between the published transforms the seventy per cent was being compared against.

limits · Limits
How far a fitted transform is from anybody's eyes. Five groups of three bars: for each published adaptation transform, the distance from the population's own cloud to the confusion point that transform is committed to, measured in the population's standard deviations on that point. On the protanope's point every one of them is between 2.2 and 14.4 out, and on the deuteranope's between 3.7 and 11.8. On the tritanope's, 5 of the five are within three standard deviations — indistinguishable from a member of the population. The claim that these matrices are not cone responses is safe, and the evidence for it is two points out of three.

Two points out of three

Every published adaptation transform implies three dichromat confusion points, whether or not it was fitted to any. Measured in the population's own standard deviations they are two to fourteen out on the protanope's point and four to twelve on the deuteranope's — and between half a standard deviation and two and a half on the tritanope's, which is inside the population. The claim that these matrices are not cone responses is safe. The evidence for it is two points.

matching · Gamut
A population of receptor bases, in the plane the published ones live in. The two axes this collection scores an adaptation basis on — the residual across the illumination census on the horizontal, ellipse anisotropy on the vertical, lower better on both — with 200 extra points on it. Each is the basis a member of the population's own confusion points determine. The cloud is not a point: it runs from 1.22 to 2.24 ΔE00 horizontally, which is wider than the whole spread of the published transforms marked on it. The observer this site quotes sits inside the cloud and near one edge of it, and the sentence "the receptor basis costs seventy per cent" is a sentence about that one point rather than about the construction.

A trade between matrices, not people

Across the space of possible bases, adapting well and discriminating well pull in opposite directions — the two optima sit at the ends of an empty diagonal. Across a population of actual observers the same two costs move weakly together, at a correlation of +0.29. The trade-off is a property of the set of matrices somebody could choose, not of the eyes anybody has. One measurement inside the population does trade, and it is the macular pigment.

brain · Appearance
Which of a camera's three dyes each direction moves. A grid with one column per direction — stiffest on the left, flattest on the right — and one row per parameter of a camera's three dyes. Each cell's bar length is that parameter's share of that direction, so a column with one long bar is a direction that moves one thing. The stiffest column is dominated by blue centre, at a weight of 0.96. The flattest column is spread across blue width, red width, green width — a combination rather than any single number, which is why a specification listing one tolerance per parameter cannot express it.

Where a camera is blind to itself

A colour filter array is six numbers — three dye centres and three bandwidths — and how well the resulting sensor adapts is far more sensitive to some combinations than to others. The stiffest direction is almost entirely where the blue dye sits. The flattest is all three bandwidths at once, and the design can move twenty-five times further along it for the same cost.

imaging · Capture
A primary's tolerance is a shape, and part of it is unreachable. The CIE chromaticity diagram with the spectral locus drawn, and three closed regions marking where each primary of a display designed for its own inverse can sit while the adaptation cost stays within 1 per cent of its best. None of them is round: the widest runs 15.1 times further one way than another, so a single tolerance figure for a primary is the average of a shape the shape never takes. 47 of the 144 boundary directions leave the region a real primary can occupy, which is a second constraint the objective knows nothing about — the cost does not rise there, and the primary cannot go there.

A tolerance is a region

How far a display's red primary can move before its adaptation behaviour costs anything is not a distance. It is a closed region on the chromaticity diagram, fifteen times longer one way than another, and about half of it lies outside the area a real primary can occupy — where the objective does not rise and the primary cannot go.

applied · Delivery
Every adaptation number here assumes a complete adaptation. Three curves and their mean: the colour difference an adapted observer is left with after a change of light, against the degree of adaptation from zero — no adaptation at all — to one. Every adaptation figure in this collection is computed at one, the right-hand end. The appearance model's own formula puts the degree at 0.941 for an average surround at a hundred candelas, marked, where the residual is 2.21 ΔE00 rather than 1.27 — larger by a factor of 1.74. The left-hand end is exactly the unadapted change, which is not an approximation but an identity, and is what says the curve interpolates between the two things it claims to.

A discount nobody measured

Every adaptation number in this collection assumes an observer who adapts completely. The appearance model's own formula says they do not — it puts the degree at 0.94 in an ordinary room — and the difference is not a rounding. It is a factor of 1.7 on the residual every one of those figures reports.

brain · Appearance
A quadratic is believed least far at the one place anybody takes one. One bar per basis: the radius, in the nine coefficients, within which the second-order model predicts the objective to within ten per cent in every one of eighteen directions. The shortest bar is the objective's own optimum, at 2.3×10⁻², and the longest is XYZ scaling at 1.1×10⁻¹ — several times further. The reason is not that the model is worse at a minimum but that it has less to do there: away from one the linear term is exact and carries most of the change, so a ten per cent error in the prediction takes longer to accumulate. It does not make a Hessian at a minimum wrong; it says the picture drawn from it describes the smallest neighbourhood in the table.

How far a quadratic can be believed

A second-order model has a radius inside which it describes a surface and outside which it does not, and that radius can be measured. Measured at eight places on one objective, it is smallest at the optimum — the one place anybody ever takes a Hessian.

limits · Limits
Room is not safety: two orderings of the same three claims. Three pairs of bars, one pair per published statement about the confusion points. The upper bar in each pair is the margin — how far the measured number is from the threshold that makes the statement true, as a ratio. The lower bar is the headroom — the factor by which one declared width of the population model would have to be wrong for the statement to fail. Both start at one, which is the line. Ordered by margin the three read the protan margin, the tritan margin, the deutan margin; ordered by headroom they read the protan margin, the deutan margin, the tritan margin, and the middle two change places. Every one of the three is inside a factor of two of failing, which the margins do not say.

What would have to be wrong

A great many statements here have thresholds written into them, which turns out to make an audit possible — for each one, the smallest change in a declared input that would stop it holding. Most are unreachable. One is inside a factor of one and a third.

limits · Limits
The family does have a worst case, at a band no pigment can cut. The worst change of light a painted wall can produce, at each band width, with the wall's centre wavelength, depth and base optimised at every point. The horizontal axis is logarithmic in the width. The curve rises as the band narrows, turns over at about 6.02 nanometres, and falls again — a band that narrow returns too little light to move the white much. The previous round's search reported no worst case because its box stopped at ten nanometres, marked, which is on the wrong side of the turn. The peak is 28.54 ΔE00 against 28.38 at that floor, which is 0.6 per cent higher: wrong in principle, right in practice to a fraction of a per cent.

A notch a pigment cannot cut

The worst change of light a painted room can produce has no maximum inside the box the search was given, which the previous round reported as a family with no worst case. Bounded by what a molecule can actually do, it has one — at a band six nanometres wide, narrower than any pigment and narrower than the box.

light · Light
The winner survives the census's own construction; the middle of it does not. One row per perturbation of a constant the adaptation census is built from — the imaginary wall's centre wavelength, its width, its depth, its base, the macular filter's density and the two lens ages — each moved by an amount plausible for that quantity in its own units, up and down, and then all of them together. Each row shows where the five published transforms rank under it. Bradford holds the first column in all 14 rows. The second and third columns, which the table as built separates by six parts in a thousand, change places in 2 of them — so that ordering was never a fact about the transforms.

The census is a construction too

Five of the fourteen changes of light this collection scores adaptation transforms against are not measurements of anything — they are a wall somebody invented, at a wavelength somebody chose. Moving those constants by amounts plausible in their own units moves the mean residual by two fifths and never changes which transform wins.

light · Light
A camera's dye widths are free under one requirement and not under another. Three panels, one per dye. In each, a pair of bars per requirement: how far that dye's centre wavelength and its bandwidth can move before the requirement gets five per cent worse. Under the adaptation objective — the one the previous round measured — every width has far more room than its centre, which is the finding that put a tolerance budget on the centres. Throughput and the colour matrix's noise gain, the two requirements that objective was said to be silent about, reach the edge of the search in every direction and hold nothing. What tightens the widths is the Luther residual, which was in the model already. The bottom pair in each panel is what survives all four.

The widths were free because nothing else was asked

A camera's three dye bandwidths carry almost all of the flattest direction of the adaptation objective, so that objective says a tolerance budget belongs on the centre wavelengths. The two requirements it was said to be silent about turn out not to bind either — and the one that does was in the model already.

imaging · Capture
What a camera's dye 1 is allowed to be, under four requirements. The plane a colour-filter dye is designed in: its centre wavelength across, its bandwidth up, both in nanometres, so the two axes are comparable and the shapes mean something. Four outlines, one per requirement, each the set of dyes within five per cent of the designed one on that requirement; the shaded region is where all four hold. Two of the four — throughput and the colour matrix's noise gain — reach the edge of the search in every direction and are invisible as boundaries. The intersection is ±6.8 nanometres of centre and ±13.3 of width, against the adaptation objective's own ±20.6 in width alone.

Two tolerances do not meet in a tolerance

A specification lists requirements separately and a manufacturer has to satisfy them together. Where two long thin regions cross at an angle, what is left is much smaller than either, its longest direction is neither of theirs, and no list of tolerances describes it.

imaging · Capture
A room applies its wall a different number of times at each wavelength. The mean number of bounces the surviving light has made, wavelength by wavelength, in a closed room whose walls are the green paint the adaptation census uses. It runs from 0.33 in the band the wall absorbs to 5.67 in the band it reflects — a factor of 17.00 — because the light that survives many bounces is the light the wall was reflecting all along. The census has one bounce and two bounces as separate rows and a search treats the count as a free integer; a room has neither, and what it has is bounded by the walls reflecting less than everything.

A room bounds its own bounces

The adaptation census has one bounce and two bounces as separate rows, and a search over the family treats the count as a free integer it always takes to the largest value offered. A room offers no integer at all — it applies a geometric mixture of every number of bounces, and that mixture is bounded by the walls reflecting less than everything.

scene · Scene
The three worst walls, drawn as the reflectances they are. Three reflectance curves, one per bound: the wall each search settled on. All three are dark over most of the spectrum with a single band near the short-wavelength end — the arithmetic bound's is 10 nanometres wide, the physical one's 40, and a paint somebody sells the same. None of them is a saturated colour: their excitation purities are 0.18, 0.52, 0.52 against a ceiling of 0.6, which is why the purity constraint never bites. What breaks an adapted observer is a wall that takes most of the light away, not one that is a strong colour.

The darkest wall anybody sells

Asked which property of a paint decides the worst change of light a room can produce, anybody would answer how saturated it is allowed to be. A ceiling on saturation never comes near binding, because the worst wall is dark rather than colourful — and the constraint that does bind is one nobody would nominate.

scene · Scene
What a display's red primary is allowed to be, under four requirements at once. A close view of the chromaticity plane around one designed primary, 0.101 units across. Four outlines: the set of positions the primary can take before each of four requirements gets one per cent worse — how well a gain in the display's own basis undoes a change of light, how much of the diagram the three primaries enclose, how many real surfaces fall inside them, and whether a light of that colour exists at all. The shaded region is where all four hold. It is 5% of the smallest outline's area, because the outlines are long and thin and cross at an angle rather than nesting. adaptation holds 42% of its boundary, gamut holds 10% of its boundary, realisable holds 48% of its boundary.

A primary is chosen for four things

A display's primaries have to adapt well, cover the diagram, hold the surfaces anybody photographs, and be colours a light can actually have. Drawing all four tolerance regions around one primary shows that no single requirement decides where it can go, and that one of the four never decides anything.

matching · Gamut
Exactly flat everywhere, and eigenvectors at one point only. Two columns over the same nine places. On the left, how far from zero the objective's second derivative is along a row-scaling direction, on a logarithmic axis — it is between 10⁻⁹ and 10⁻⁶ of the largest eigenvalue at every one of them, which is a numerical zero. Scaling a row of the basis is a straight line along which the cost does not change, and that is true at every point, not only at the optimum. On the right, the angle between those three directions and the Hessian's own three smallest eigenvectors: 0.025 degrees at the optimum and up to 88 away from it. An invariance is a property of the function; being an eigenvector is a property of the function at a minimum, and the two coincide only where everybody computes.

Only the flat directions keep their names

Three of the nine numbers a colour match leaves free do nothing, and they do nothing everywhere — exactly, at every basis in this collection's table. They are the objective's own principal directions at one point only, and everywhere else the directions carrying the curvature have turned by tens of degrees.

matching · Gamut
At a published matrix the slope arrives long before the bowl. One row per basis in this collection's table. Each row is a logarithmic axis of distance in the nine coefficients, with two markers: the radius at which the objective's curvature becomes as large as its slope, and the distance from that basis to the optimum. The first is between 3.2 and 108 per cent of the second. So over almost the whole journey from a published matrix to the best one, the surface is a slope and not a bowl — and a table of eigenvalues taken there describes a neighbourhood the optimum is nowhere near. XYZ scaling is the exception, at 1.08 of the distance, because its slope is the steepest in the table.

The slope arrives before the bowl

The adaptation transforms colour management actually uses are not optima of anything. At every one of them the objective has a slope, and the slope is the larger term over almost the whole distance to the best matrix — so a table of curvatures taken there describes a bowl nobody meets on the way anywhere.

applied · Delivery
Downhill from every published matrix, one step at a time. Each curve is a steepest-descent walk from one of this collection's published bases, plotted as the objective against the distance walked in the nine coefficients. The horizontal line is the optimum. The first step of each walk is the long one — XYZ scaling closes 41 per cent of its whole gap in one — and every walk then flattens without reaching the line, because the valley floor is nearly flat and the steepest direction is nearly across it. Bradford starts closest and closes least: it is already in the flat part.

Downhill from a published matrix

Walking steepest descent from each adaptation transform in use closes between a quarter and nine tenths of its distance to the best one, and most of that in the first step. The direction it sets off in is eighty to eighty-seven degrees away from the answer, and that turns out not to be an artefact of the three directions nothing can see.

applied · Delivery
What one change of light costs, surface by surface — daylight to tungsten. A rising curve of 125 points, one per surface in the test set, sorted from the surface this change of light costs least to the one it costs most, with the published mean drawn across it as a horizontal line. The published residual for daylight to tungsten is 1.635 ΔE₀₀. The curve runs from 4.4e-14 — 5 of the surfaces are flat greys, on which an adapted observer's gain is exactly right and the residual is exactly zero — to 3.058, which is 1.87 times the mean. The mean line crosses the curve about two thirds of the way along, so most surfaces cost less than the published number and a minority cost a great deal more. This is what a single published residual is a summary of.

A mean has a set under it

Every adaptation number this collection publishes is an average over a hundred and twenty-five surfaces that were written down once, in one file, with no argument for how many there should be or how saturated. The average runs from exactly zero to twice itself across them, and the set has never been varied.

scene · Scene
Every census row under five constructions of the same test set. A slope chart with 5 columns — lattice, coarse, fine, uniform, natural — and one line per change of light in the census, each line joining that row's mean residual under each construction. Four of the five columns describe the same region of surfaces walked at different densities or against different measures; the last is the clamped, realistic family, which is not linear in its parameters and is therefore answering a slightly different question. The levels move: between the coarse and fine lattices every row shifts by seven to nine per cent, in the same direction, which is a common-mode factor no published residual here has ever carried. The order almost survives. Inside the region exactly one pair crosses, and it is the pair the standard error had already flagged; under the clamped set two more cross, including one the error separates by nearly nine standard errors. The crossing lines are drawn heavy.

A lattice is a quadrature rule

Walking a set of test surfaces more finely does not converge on a better answer, because refining a lattice under a constraint changes which corners of the region get sampled and not only how densely. The lattice used here turns out to be a two per cent biased estimate of the integral it stands for.

difference · Metric
The error on a gap is not the two rows' errors added. Two bars for each of the 13 adjacent pairs in the census ranking. The upper, shorter bar is the standard error of the gap taken as a paired difference — the same 125 surfaces score both rows, so a surface that is awkward under one change of light is usually awkward under the other and the difference is quieter than either. The lower bar is the two rows' own errors added in quadrature, which is what comparing error bars by eye amounts to. Pairing is worth a factor of 1.78 on average and 3.36 on the pair it helps most, and it is the difference between 6 adjacencies unordered and 4. The gain is largest where the two rows are two daylights or two tungstens, because then the surfaces they find awkward are nearly the same surfaces.

The error on a gap is not the errors at its ends

Comparing two rows of a table by looking at whether their error bars overlap is the wrong comparison, and here it is wrong by a factor of up to 3.4. The same 125 surfaces score both rows, so the difference between them is quieter than either — and how much quieter is a measurement of how alike the two rows are.

difference · Metric
Which steps of the census ranking the test set actually resolves. A horizontal bar for each of the 13 adjacent pairs in the census's ranking, from the smallest mean residual to the largest. A bar's length is the gap between the two rows in ΔE₀₀; the whisker on its end is twice the standard error of that gap, computed as a paired difference because the same 125 surfaces score both rows. Where the whisker reaches back past zero the pair is not ordered by this test set, and 4 of the 13 are in that state — marked. The largest steps, at the two ends of the ranking, are twenty standard errors wide and are not in doubt at all. The smallest is four parts in ten thousand between two rows the table prints as different numbers.

Four steps the test set cannot order

The adaptation census prints fourteen numbers to four figures and its ranking is asked to say which lamps adaptation handles worst. Nine of its thirteen steps are established beyond any doubt the test set can raise; the other four are not, and three of them are consecutive — a tungsten lamp, a halogen lamp and a white LED are simply not ordered.

light · Light
Every census row under five constructions of the same test set. A slope chart with 5 columns — lattice, coarse, fine, uniform, natural — and one line per change of light in the census, each line joining that row's mean residual under each construction. Four of the five columns describe the same region of surfaces walked at different densities or against different measures; the last is the clamped, realistic family, which is not linear in its parameters and is therefore answering a slightly different question. The levels move: between the coarse and fine lattices every row shifts by seven to nine per cent, in the same direction, which is a common-mode factor no published residual here has ever carried. The order almost survives. Inside the region exactly one pair crosses, and it is the pair the standard error had already flagged; under the clamped set two more cross, including one the error separates by nearly nine standard errors. The crossing lines are drawn heavy.

The instrument named the pair that moved

A standard error over a test set flagged four steps of the adaptation census as unresolved. Rebuilding the set three different ways reversed exactly one pair, and it was one of the four. Rebuilding it to a different rule reversed a pair the error separated by nearly nine standard errors — which is not a failure of the instrument but a statement of what it is about.

limits · Limits
What a fourth reflectance dimension costs the theorem that a change of light is a matrix. Four rising curves on axes of the fourth dimension's amplitude, left to right, against what is left of daylight to tungsten after the exact 3×3 change-of-light matrix has been applied, in ΔE₀₀. All four begin at exactly zero: on the three-dimensional family the matrix is solved rather than fitted and there is no remainder at all, which is the theorem this collection's adaptation argument is built on. Adding a fourth reflectance dimension breaks it, and how badly depends far more on the fourth function's shape than on its size — at five per cent amplitude the four shapes cost 0.329, 0.572, 0.063, 0.124 ΔE₀₀ respectively, a factor of 9.1 between the dearest and the cheapest. For scale, the smallest von Kries residual anywhere in the census is 0.26 ΔE₀₀, so the cheapest of the four is a quarter of it and the dearest is twice it.

A theorem about a family

A change of light acts on the test surfaces used here as an exact 3×3 matrix with no residual whatsoever, and the whole adaptation argument is built on that being exact. It is exact because the surfaces span exactly three dimensions, and they span exactly three dimensions because three basis functions were written down.

scene · Scene
Which fourth dimensions are expensive, and how fine is too fine to matter. Two curves on axes of how many half-cycles a cosine fourth basis function makes across the visible band, against what it costs the matrix theorem in ΔE₀₀, at a fixed ten per cent amplitude. Both curves touch zero at exactly one and two half-cycles: those are the family's own second and third basis functions, so a fourth coefficient along them adds no dimension and a change of light stays exactly a matrix. Between them the cost climbs, reaches a maximum, and — for the smooth source — falls away again, because structure finer than the scale on which three broad cone sensitivities differ integrates to nearly nothing. The two curves part company at the fine end. Under daylight-to-tungsten the cost has fallen by a factor of 2.2 from its peak; under daylight-to-a-triphosphor-tube it has barely fallen at all, because a source with three narrow emission lines has structure of its own at that scale for the surface's structure to beat against. The observer is identical in both curves.

A fourth dimension has a shape

How much a fourth reflectance dimension costs spans a factor of nine across four equally plausible shapes at one amplitude, and the expensive ones are not the shapes a variance figure would identify. The band that hurts is set by the illuminant rather than by the eye, which is why a triphosphor tube and a tungsten lamp disagree about it.

light · Light
The census as the surfaces stop being three-dimensional. A slope chart with three columns — a test set with no fourth reflectance dimension, one with a fourth dimension at ten per cent amplitude, and one at twenty — and a line per change of light. Almost every line rises: a surface with structure the observer's three channels cannot follow is a surface an adaptation gain handles worse. Two lines are drawn heavy. daylight to a three-primary display rises fastest, by 90 per cent, because a source made of three narrow lines is precisely the instrument that cannot see a fourth reflectance dimension. And daylight to a triphosphor tube falls — the only row that does — because a triphosphor tube already samples the spectrum at three places, so extra structure in the surface is partly averaged away rather than added. The order of the middle of the table is not the same at the two ends; the extremes do not move.

The row a fourth dimension improves

Giving the test surfaces one more degree of freedom makes almost every change of light harder for an adapted observer — but not all of them, and which one it helps depends entirely on what the extra dimension looks like. A triphosphor tube is improved by one shape and hurt more than anything else in the census by another.

light · Light
How far each census row moves when the test set's own description does. A grid of bars, one row per change of light in the census and one bar in each row per number that describes the region the test surfaces are drawn from: how saturated they are, how bright, and how far the two modulations may go together. A bar's length is the elasticity — the proportional change in the published residual for a proportional change in that number. Saturation runs from 0.49 to 0.91 and brightness averages 0.104, so a test set's chroma range is nearly everything and its lightness range is nearly nothing. For scale, the largest elasticity found anywhere among this collection's five declared population widths is about a half — and those at least have declared ranges, while these three numbers have never been quoted with one.

Saturation is nearly everything

The set of test surfaces has three numbers describing it, and only one of them matters. How saturated the surfaces are carries an elasticity of about 0.7 on every result computed over them; how bright they are carries 0.10. A test chart's chroma range decides its answer and its lightness range does not.

difference · Metric
How far each census row moves when the test set's own description does. A grid of bars, one row per change of light in the census and one bar in each row per number that describes the region the test surfaces are drawn from: how saturated they are, how bright, and how far the two modulations may go together. A bar's length is the elasticity — the proportional change in the published residual for a proportional change in that number. Saturation runs from 0.49 to 0.91 and brightness averages 0.104, so a test set's chroma range is nearly everything and its lightness range is nearly nothing. For scale, the largest elasticity found anywhere among this collection's five declared population widths is about a half — and those at least have declared ranges, while these three numbers have never been quoted with one.

The input nobody declared

An audit that swept every declared width in this collection found the largest elasticity anywhere to be about a half. The most elastic input turns out to be one that was never declared, never quoted with a range and never varied — and being undeclared is exactly why it escaped the audit that was looking for it.

limits · Limits
No one surface carries the answer, and the set is smaller than it looks. A falling bar chart of the 125 surfaces in the test set, ordered by how much each contributes to the published mean for daylight to tungsten. The tallest bar is 1.50 per cent of the total, so the mean is not a few awkward objects with a crowd behind them and a leave-one-out would move it by well under a per cent. The tail is the other half of the story: 5 surfaces contribute essentially nothing, because a flat grey is a surface an adaptation gain handles exactly. Counting the set by how evenly it contributes rather than by how many members it has gives 108.5 effective surfaces out of 125, which is what "a mean over a hundred and twenty-five surfaces" is really worth.

The surfaces that answer nothing

Five of the hundred and twenty-five test surfaces contribute exactly zero to every number the adaptation census reports — not approximately, exactly — and the reason is the one fact about von Kries adaptation that makes it worth having at all. Counting the set by how much it contributes gives about a hundred members rather than a hundred and twenty-five.

eye · Cones
A published residual is a mean, and the worst object in the room costs twice it. Three bars for each of the 14 changes of light in the adaptation census, ordered by how uneven the change is across surfaces. The first bar is the published mean residual. The second is the worst single surface in the audit's published test set. The third is the worst surface anywhere in the region that set is drawn from, found by search rather than by reading a maximum off a lattice. The mean-to-worst ratio runs from 1.90 to 4.02 and averages 2.43, so every published adaptation number has a worst case about twice it that no essay had ever quoted. The gap between the second and third bars is the other finding: a maximum over 125 sampled points understates the region's own maximum by up to 34 per cent.

A mean is not a worst case

Every adaptation number this collection publishes is an average over objects, and the reader asking whether adaptation will fail them is asking about the object it fails on. That object costs between 1.9 and 4.0 times the published figure, and how uneven a change of light is across objects turns out to be a property of the change rather than a constant.

limits · Limits
A published residual is a mean, and the worst object in the room costs twice it. Three bars for each of the 14 changes of light in the adaptation census, ordered by how uneven the change is across surfaces. The first bar is the published mean residual. The second is the worst single surface in the audit's published test set. The third is the worst surface anywhere in the region that set is drawn from, found by search rather than by reading a maximum off a lattice. The mean-to-worst ratio runs from 1.90 to 4.02 and averages 2.43, so every published adaptation number has a worst case about twice it that no essay had ever quoted. The gap between the second and third bars is the other finding: a maximum over 125 sampled points understates the region's own maximum by up to 34 per cent.

An extremum is still not a sample

Two rounds ago three measurements turned up that took a maximum over a sample of a set and were short by up to a factor of two. The same error was live in a fourth place the whole time, on the set of surfaces every adaptation number is averaged over, and it is short by up to a third.

matching · Gamut
Every worst surface sits on a number somebody typed. The region the test surfaces are drawn from, in its own two modulation coordinates: a square of allowed depths with a diamond inscribed in it, the diamond being the requirement that the two depths sum to no more than 0.7. The 14 marked points are the worst surface for each change of light in the adaptation census, found by search over the whole region. Every one of them lies exactly on the diamond, and every one is also at the brightest level the region allows — both declared constraints active, on all 14 rows, with no interior maximum anywhere. That is the opposite of what bounding the wall gave: there the worst case turned over at a band width of six nanometres because a narrow band returns too little light, which is physics. Here the worst case is a reading of two numbers. The one constraint that is about the world — a paint's excitation purity may not exceed 0.6 — is slack everywhere: the most saturated surface the region admits reaches 0.459.

Every worst surface sits on a declaration

Bounding the wall in a painted room produced a real worst case — the residual turns over at a band six nanometres wide because a narrower band returns too little light. Bounding the surfaces the residual is averaged over produces nothing of the kind, because all fourteen answers sit exactly on two numbers somebody typed and the one constraint that comes from the world never binds at all.

scene · Scene
The same claim in nanometres of pigment, where no declared width can reach it. Five horizontal bars on a scale of nanometres, one per published chromatic-adaptation transform, each showing how far the medium-wave cone pigment's absorption peak would have to move for the receptors' own protan confusion point to land where that transform puts it. Zero is the measured peak. The bars run from -10.5 to 18.2 nanometres — in both directions, so two of the transforms want the pigment shorter and two want it longer. Drawn across them is the 25 nm separation between the L and M pigment peaks, which is the whole basis of red-green vision and is not a number this collection declared. The nearest transform asks for a displacement of 30 per cent of that separation, and the span across the table is 28.7 nanometres — larger than the separation itself. No population, cloud or standard deviation appears anywhere in the statement.

The claim, in nanometres

For four rounds the claim here has been that every published adaptation transform puts the protanope's confusion point outside any real population of eyes, stated in standard deviations of a population whose widths were declared rather than measured. Restated as a pigment displacement it needs no population at all — and the nearest transform asks the medium-wave cone to move thirty per cent of the way to the long-wave one.

eye · Cones
The same claim in nanometres of pigment, where no declared width can reach it. Five horizontal bars on a scale of nanometres, one per published chromatic-adaptation transform, each showing how far the medium-wave cone pigment's absorption peak would have to move for the receptors' own protan confusion point to land where that transform puts it. Zero is the measured peak. The bars run from -10.5 to 18.2 nanometres — in both directions, so two of the transforms want the pigment shorter and two want it longer. Drawn across them is the 25 nm separation between the L and M pigment peaks, which is the whole basis of red-green vision and is not a number this collection declared. The nearest transform asks for a displacement of 30 per cent of that separation, and the span across the table is 28.7 nanometres — larger than the separation itself. No population, cloud or standard deviation appears anywhere in the statement.

Five transforms and the space between them

Every appearance prediction here chooses one of five published adaptation transforms, and the five disagree about where a protanope's confusion lines meet by more than the distance between the two pigments the disagreement is about. That spread is itself a scale, and using it needs no population model at all.

brain · Appearance
Every census row under five constructions of the same test set. A slope chart with 5 columns — lattice, coarse, fine, uniform, natural — and one line per change of light in the census, each line joining that row's mean residual under each construction. Four of the five columns describe the same region of surfaces walked at different densities or against different measures; the last is the clamped, realistic family, which is not linear in its parameters and is therefore answering a slightly different question. The levels move: between the coarse and fine lattices every row shifts by seven to nine per cent, in the same direction, which is a common-mode factor no published residual here has ever carried. The order almost survives. Inside the region exactly one pair crosses, and it is the pair the standard error had already flagged; under the clamped set two more cross, including one the error separates by nearly nine standard errors. The crossing lines are drawn heavy.

What the audit still cannot reach

Two rounds have now swept every declared width in this collection and one of its structural choices. Three structural choices remain, none of them has a multiplier to sweep, and the reason each resists is different — which makes the list a description of where this kind of audit ends rather than a queue of work.

limits · Limits
The adaptation census in six units, calibrated onto one scale. Each line is one of the fourteen changes of light in the adaptation census, drawn across the six units the results could have been published in. Every unit is multiplied by the single factor that best carries it onto ΔE2000 over a reference sample of surface pairs, so the vertical axis means the same thing in every column and a sloping line is a disagreement rather than a change of scale. The levels move by up to a factor of two. More to the point, the lines cross: ΔEok puts 10 of the 91 pairs of rows in the other order, and CAM16-UCS, the only appearance unit here, puts the fewest — 2.

The census in six units

Recomputing every change of light in the adaptation census under six colour-difference formulae, with the scale factor divided out, leaves a table whose levels move by up to a factor of three point seven. The rows that move most are the mild ones, which is the opposite of what a reader would guess and is a property of where each formula was fitted.

light · Light
Which steps of the census ranking a change of unit reverses. Every adjacent pair in the published census ranking that at least one unit puts the other way round. The bar counts how many of the five other units reverse it. The marker on the left says whether the test set had already declared the pair unresolved — a gap smaller than twice its own paired standard error, which is a statement about sampling over 125 surfaces and shares no arithmetic with a change of ruler. The two pairs every unit reverses are both flagged, which is the agreement. The pair at the bottom is the disagreement: the test set resolves it at 9.1 standard errors and four of the five units reverse it anyway, because a sampling error cannot see a change of ruler and a change of ruler cannot see a sampling error.

Two instruments and one ranking

A sampling error over a hundred and twenty-five surfaces and a change of colour-difference formula share no arithmetic at all, and they were asked the same question of the same table. Every adjacency the whole menu reverses had already been flagged as unresolved. And one the test set settles at nine standard errors is reversed by four of the five formulae, which is what makes them two instruments rather than one.

limits · Limits
Two sensitivities from two libraries, under every unit. Two quantities that share no code, no test set and no physical question: how much the adaptation census's residual depends on how saturated its surfaces are, and how much a camera profile's reported error depends on how saturated its test chart is. The first is a mean over fourteen changes of light built from cosine combinations; the second is one number about one silicon sensor scored on Gaussian bumps. Under the published unit they sit at 0.687 and 0.656. Across the whole menu they move together, from about 0.5 under the appearance unit to about 1.15 under plain CIELAB, staying within 12 per cent of each other at the worst point. Two numbers agreeing once is a coincidence; two curves agreeing at six points across a factor of two and a half is a shared mechanism, and the mechanism is the compression the unit applies to a chroma difference.

The coincidence was a mechanism

Two sensitivities from two libraries with no shared code came out two per cent apart, and the claim made about them was that they share a mechanism rather than a number. That claim has a colour-difference formula inside it, so it can be tested by changing the formula — and both curves move together across the whole menu, from 0.5 to 1.15.

imaging · Capture
What six of this collection's published numbers do when the unit changes. Six quantities, from six calculations that share nothing: a change of light after an observer has adapted, a camera profile's error, the gap between the two standard observers, a metameric pair under the lamp that breaks it, the same image on two papers, and an observer two seconds into a new room. Each is recomputed under all six units and every unit is calibrated onto ΔE2000's scale first, so the bar is not a change of units in the ordinary sense. The bar is the ratio of the largest reading to the smallest, and it runs from 1.71 to 2.30. Five of the six are printed in ΔE2000 by the essays that report them; the sixth is printed in CAM16-UCS, because the model it comes out of defines that unit.

A model judged in another model's unit

An appearance shift is a change in what an observer would report, not a change in a stimulus, so measuring one with a matching difference means first asking what stimulus a settled observer would need to be shown to give the same report. That step is not bookkeeping — it is the whole distinction the field rests on, and it costs a factor of 1.7 across the menu.

brain · Appearance
What an observer is left with, by how much it is allowed to know about the room. Six ways of discounting a change of light, averaged over the fourteen changes in the adaptation census and 125 test surfaces each. The bar is what each leaves behind, on a logarithmic axis because the models span two orders of magnitude. The second line under each name is the count that matters: how many numbers about this room the model has to be given. Doing nothing leaves 15.7 ΔE₀₀. A single gain read off the two whites' luminances leaves 15.3. A matrix fitted across half the census and then applied everywhere, knowing nothing about the room at all, leaves 12.5. The published von Kries gain, which is told the white and nothing else, leaves 1.312 — and bolting a fixed correction onto it, at no cost in scene information, leaves 1.368, which is very slightly worse. The exact matrix leaves nothing and is not on the chart: its nine numbers are the change of light, which is the quantity being discounted.

Three numbers the scene supplies

An adaptation model's parameters are not all the same kind of thing. Some are numbers an observer must estimate from the room it is standing in; others could have been settled once by evolution. Counting them separately turns the diagonal gain from a crude approximation into the only model of the set that gets a large answer from information the observer can actually have.

scene · Scene
How much of the residual a partial correction removes. Between the diagonal gain and the exact matrix there is a line: apply the correction that would make a row exact, but only a fraction of it. The horizontal axis is that fraction and the vertical is the share of the row's residual it removes, for all fourteen census rows. The straight diagonal is where a correction worth exactly its fraction would fall, and in the published unit every curve lies on it to within 2.2 percentage points. The lower band of curves is the same interpolation measured in CAM16-UCS, which departs by up to 17 points — because its distance is a power of the Euclidean one and a power is not homogeneous along a ray, where every ordinary norm is. The straight line is therefore a property of the ruler rather than of the correction, and the exception is what says so.

A partial correction is worth its fraction

Between a diagonal gain and the exact matrix there is a line, and a bounded observer's natural hope is that the first part of it is worth a disproportionate share. It is not. On all fourteen changes of light, at every setting, the share of the residual removed matches the share of the correction applied to within 2.2 percentage points — which closes the last way the gap could have been cheap.

scene · Scene
A correction an observer could have been born with, fitted on half the census and tested on the other. The same six models, each scored twice: on the seven census rows the fixed matrices were fitted to, and on the seven they were not. The split alternates by position so both halves contain daylight changes and discharge lamps. The upper bar is in sample and the lower is out, on a logarithmic axis. For the four models with nothing fitted the two bars differ only because the halves are different questions. For the two fitted ones the gap is the finding, and it is largest where it matters least: bolting a fixed correction onto the von Kries gain takes it from 1.2724 to 1.2592 on the rows it was fitted to, and from 1.3511 to 1.3679 — worse — on the rows it was not. There is no correction to the diagonal that an observer could arrive with.

A model is a claim about what can be known

The exact answer to chromatic adaptation is nine numbers, and the nine numbers are the change of light itself. A model whose parameters are quantities the observer cannot obtain is not a worse model of the same thing — it is a model of something else, and counting parameters without asking where they come from hides the difference.

scene · Scene
What six of this collection's published numbers do when the unit changes. Six quantities, from six calculations that share nothing: a change of light after an observer has adapted, a camera profile's error, the gap between the two standard observers, a metameric pair under the lamp that breaks it, the same image on two papers, and an observer two seconds into a new room. Each is recomputed under all six units and every unit is calibrated onto ΔE2000's scale first, so the bar is not a change of units in the ordinary sense. The bar is the ratio of the largest reading to the smallest, and it runs from 1.71 to 2.30. Five of the six are printed in ΔE2000 by the essays that report them; the sixth is printed in CAM16-UCS, because the model it comes out of defines that unit.

Three choices reached

Two rounds ago this collection named three things it rested on and could not audit — a unit, a diagonal and a template. All three are now reached, and the interesting part is not the three answers but that four of the round's own predictions were refused by the arithmetic and one of its measurements was wrong in a way only a cross-check caught.

limits · Limits
The two tabulation choices over forty-two surfaces, under a tungsten lamp at 2856 K. Each column is one choice, measured over a family of forty-two analytic reflectances rather than on a single example: an absorption band of stated centre, width and depth. The four marks are the smallest, the median, the ninety-fifth percentile and the largest cost in ΔE₀₀, logarithmically. Under a smooth light the range is worth 6.3 times the step at the median, so a collection wanting one repair should widen its range rather than refine its step — and under a fluorescent tube the ranking reverses outright.

A neutral has no grid

A perfectly flat reflectance computes to exactly the same colour on every wavelength grid, through every slit, at every origin, and for every observer — not nearly, but to the last bit of a floating-point number. The condition is an identity rather than a limit, and what makes it one is the white point.

difference · Metric
What the normaliser cancels, per light. Two bars per light, logarithmic. The upper is the colour error a 5-nanometre sum makes when the white it is divided by is computed finely; the lower is the same sum divided by the white computed on the same coarse grid, which is what every colorimetric calculation actually does. The ratio is between 1.3 and 4.1. The grid appears twice in a tristimulus value and the two errors are the same error, so most of it divides out — which is why five nanometres has been good enough for a century without anybody having to be careful about it.

The normaliser carries the error too

A five-nanometre sum gets a red pigment's tristimulus value wrong by two hundredths of a per cent and its colour wrong by six hundredths of a unit. Those two numbers are not the same size because the grid appears twice in a colour — once in the sample and once in the white — and the two errors are largely the same error.

difference · Metric
The conditions under which an observer's departure is exactly zero. A departure of the observer is the pairing of something belonging to the observer with something belonging to the stimulus, so emptying either factor empties the product. The axis is logarithmic in what is left when the condition is imposed. Six rows empty the stimulus's factor — a perfectly neutral sample is the same colour for every observer, at any age and any field size — and two empty the observer's, since a gain on each cone and a change of basis are both absorbed exactly. All eight are identities rather than small numbers. The last two are the same two conditions imposed in a published cone space rather than in the observer's own, and they are worth eight and thirteen units: the identity is about the eye, and the arithmetic everybody uses is in somebody else's coordinates.

A neutral is everyone's colour

Two eyes differing by fifty years of lens yellowing, by a factor of three in macular pigment and by six nanometres of long-wavelength peak agree about a grey card to four parts in ten thousand billion. The agreement is an identity rather than a coincidence, and it says exactly what an observer disagreement is a disagreement about.

eye · Cones
The three cone absorptances at two settings of the cone optical density. Solid and dashed are the same construction at the two ends of two standard deviations of the reported spread. The curves are built from one pigment template through its ocular media, which is the same model its population of two hundred eyes is drawn from. The largest difference between the two sets is 18.8 per cent of the peak, and where it sits along the wavelength axis is what decides which stimuli the two observers disagree about — a departure concentrated in the blue is invisible on a sample with no blue in it.

A gain is not an observer

Multiply one eye's three cone sensitivities by 1.6, 0.7 and 2.4 and it is not a different eye. The white-point division is that multiplication's inverse, so the two agree exactly — and most of what a cone optical density change does is that multiplication, which is why the largest number in the table of individual variation is the one that matters least.

eye · Cones
What choosing a space to divide the white out in is worth. Three pairs of routes to the same colour, over forty-two surfaces: dividing the white out in tristimulus values, in a published cone space, and in the observer's own cones. The first two agree to 0.59 ΔE₀₀ at the median. Either of them differs from the observer's own cones by more than fifteen. That is why the two exact conditions in this round are exact only in the eye's own coordinates: the identity belongs to the receptors, and every published arithmetic works in a basis somebody else chose.

The identity is in the eye's own coordinates

Two conditions in this round are exact — a gain on each cone is not a different observer, and three curves for one space are one observer. Imposed in a published cone space rather than the eye's own they leave 13.0 and 8.11 ΔE₀₀ standing. The identities belong to the physiology and every arithmetic in use works somewhere else.

eye · Cones
Each departure over forty-two surfaces rather than one. The same six departures measured over a family of forty-two analytic reflectances — an absorption band of stated centre, width and depth — with the smallest, the median, the ninety-fifth percentile and the largest marked. Every one of them spans more than a factor of three, and the ranking between them is not stable across the family: what decides a departure's size is which sample it is asked about, because a departure is a pairing and the sample is one of the two factors. Quoting any single number for what an observer's age is worth is quoting a choice of example.

The census under another observer

This collection's largest computed result is an adaptation census — fourteen changes of light judged over a hundred and twenty-five constructed surfaces. Every number in it was computed through one observer, and the observer's own departures are between one and two and a half units on the same surfaces, which is the size of the effects the census reports.

brain · Appearance
The two tabulation choices over forty-two surfaces, under a 6500 K thermal radiator. Each column is one choice, measured over a family of forty-two analytic reflectances rather than on a single example: an absorption band of stated centre, width and depth. The four marks are the smallest, the median, the ninety-fifth percentile and the largest cost in ΔE₀₀, logarithmically. Under a smooth light the range is worth 9.1 times the step at the median, so a collection wanting one repair should widen its range rather than refine its step — and under a fluorescent tube the ranking reverses outright.

The grid under the census

The adaptation census is computed on eighty-one wavelengths from 380 to 780 nanometres. Under the daylight and blackbody sources it uses, the range is worth about half a colour difference on ordinary surfaces and the step about a twentieth — so the census carries a tabulation term as well as an observer one, and they are not the same size.

brain · Appearance
The angle between the lens and the macular pigment, before and after adaptation. On each of 120 surfaces the angle, in the local metric, between what an older lens does to the reading and what a denser macular pigment does, binned in ten-degree steps. Read without adaptation, where both filters yellow the observer's white along with everything else, the two point nearly the same way: a median of 8 degrees. Read after each observer has adapted to its own white, the median is 156, and the two together cost less than the larger alone on 115 of the 120.

Two yellow filters cancel on a slope

An older lens and a denser macular pigment both take blue out of the light, and read before adaptation they move a colour in nearly the same direction, eight degrees apart. Once each eye has adapted to its own white they point a median 156 degrees apart on smooth reflectances and together cost less than the lens alone. On surfaces with a narrow absorption band they still sit 26 degrees apart and add. What decides it is the width of the surface's own features.

difference · Metric
A gloss finish's loss of colour, read by the light and by a viewer in the room. Four changes against the matt room as the coloured walls are made glossier, from roughness 0.8 to 0.15: the chroma of the room's reflected light as a colorimeter reads it; the mean chroma of the six faces as CIECAM16 sees them adapted to the lamp and adapted to the room's own average light; and how far the faces sit from that average in the model's uniform space. At roughness 0.2 the light loses 8.3 per cent, the faces 8.6 per cent to the lamp-adapted viewer and 13.9 to the room-adapted one, and the spread 11.0 per cent against 11.2 read against the lamp.

A gloss room looks less colourful than it measures

A gloss finish takes 8.3 per cent of the chroma out of a green room's reflected light, and a viewer adapted to the room should discount a loss that affects everything alike. The appearance model says the opposite. Adaptation removes the colour the whole room shares, leaves the colour that differs from face to face, and the finish takes as large a share of that as of anything — so to a viewer standing in the room the faces lose 13.9 per cent of their chroma, not 8.6.

scene · Scene
What the choice of adopted white is worth, in a room lit by two lights. A room lit half by daylight and half by an incandescent lamp. The light on the surfaces is fixed; what varies is the white the model is told the observer has adapted to, running from the lamp on the left to the window on the right. The median of twelve surfaces moves 32.6 CAM16-UCS units if the lamp is adopted and 24.5 if the window is, against the room's own mixture in the middle. The model offers no way to choose, and its degree of adaptation is 0.94 at every point of the dial.

A room with two lights has no white

An appearance model takes one adapting white. A desk beside a window has two, and the mixture falling on the paper is not the same thing as the white the person reading it has adapted to. Mixing the lights is arithmetic. Choosing the white is not, and the choice is worth sixty units of appearance — most of which is a cast, and not all of which is.

brain · Appearance
One grey scale, three backgrounds. CIECAM16's lightness against the luminance factor of a neutral sample, with only the background changed. A grey reflecting 19% reads 46.7 on a near-black background and 32.8 on a near-white one. The three curves are not three shapes: each is the same curve raised to a different power, because the background reaches lightness only through the exponent z, which runs 1.621 to 2.374 across the three.

A dark background moves every difference and no match

CIECAM16's background is one number, and it reaches lightness as one exponent. That is enough to change what a grey looks like and not enough to change which of two greys is lighter — so a match survives the background exactly, a corresponding colour is invariant to it, and a tolerance is not. The effect the background is usually invoked to explain is absent from the model entirely.

brain · Appearance
A satin finish pulls each room towards the lamp's white — a 3000 K radiator. Six rooms lit by a 3000 K radiator, on the ab plane of an instrument referenced to daylight, whose own white is the cross at the centre. Each open circle is a matt room and the arrow runs to the same room with satin walls. The filled diamond is the lamp's own white on that plane. Every arrow points within 9.2 degrees of the diamond and covers between 8.1 and 11.5 per cent of the distance to it. Whether the daylight instrument then reads more chroma or less depends only on whether the room was nearer the cross than the diamond is.

A finish adds colour only to a daylight meter

Measured against daylight's white, a satin finish under six lamps and six wall colours takes anything from −6 to 42 per cent of a room's colour, and one room reads as more colourful glossy than matt. Measured against the white of the lamp each room is actually lit by, the same thirty-six rooms lose between 7.7 and 12.9 per cent and none gains. The whole spread was the lamp's own colour, and the finish does one simple thing to every room: it pulls the room's colour a tenth of the way towards the lamp's white.

scene · Scene
Thirty-six rooms as a viewer adapted to each would see them. Each cell is one room at a satin finish: wall colour down, lamp across. The large number is the share of the faces' chroma a viewer adapted to the room's own light loses, read through CIECAM16; the small number under it is what the room's light loses against the lamp's white. The viewer loses between 12.8 and 30.9 per cent, always more than the light, and the rows differ far more than the columns: a deep red room loses about twice what a green one does under every lamp.

What an adapted viewer loses is set by the wall

A satin finish takes about a tenth of a room's colour, measured on the room's light against its lamp's white. Read through an appearance model by a viewer adapted to the room, the same thirty-six rooms lose between 12.8 and 30.9 per cent — 1.4 to 2.4 times as much — and the wall colour decides the multiplier: a deep red room loses twice what a green one does, under every lamp. A test on the bare wall predicts it. Add a little of the lamp's white to the wall's own colour and ask the model what that costs: the answer orders the thirty-six multipliers at 0.95.

scene · Scene
An orange ink's tints on three papers: which way the hue turns. The hue of each tint of an orange ink, from the solid to a tenth coverage, against the solid on the same paper, in degrees of Oklab hue: on a coated sheet, an unbrightened uncoated sheet and a newsprint. Solid lines are read against daylight's white, as an instrument reads them; dashed lines against the paper's own white, as a reader adapted to the page. At a tenth coverage, read against daylight, the coated sheet's tint has turned -8.7 degrees and the newsprint's 21.8; read against each paper's white, -8.7 and -1.1.

Newsprint turns a tint with its colour, not its gain

A halftone tint turns its hue the way a mixture of light does, by less, because optical dot gain carries it part of the way towards a paint tint. The straight line through a coated sheet's gain predicted that an uncoated sheet's larger gain would carry the orange past the crossing at a factor of 3.2, so that the same ink would turn opposite ways on two papers. It does turn opposite ways — on newsprint the orange's pale tints swing 13 degrees one way where a coated sheet's swing 8 the other. But the gain is not what does it. The road towards paint bends and stops at 60 to 70 per cent of the way, the orange needs a factor of 5.4 to cross, and newsprint's reversal comes almost entirely from the paper being yellow. Read against the paper's own white, as a reader looking at the page is adapted, it goes away.

brain · Appearance
How far a mesopic match moves as the S weight opens: two rooms against one field. For every pair of the five lamps, the median over forty-two surfaces of how far a match moves as the rod signal's weight into the S channel goes from nothing to equal: pale for the two-room match, each half adapted to its own lamp; dark for a bipartite field whose two halves share one adaptation. The field's signal is larger for every pair, by ×1.5 to ×7.7.

One field keeps what two rooms divide out

An asymmetric match can measure how strongly the rods feed the blue-yellow pathway, but set with the observer adapted to each lamp in turn it needs seventy-five settings on the best pair of lamps and hours of waiting between them. Putting the two lamps on the two halves of one field was proposed as the quick version, at the cost of a weaker signal. The signal is not weaker. Under one shared adaptation it is three times stronger for daylight against a white LED, and the best pair needs six settings. The adaptation that makes the slow version slow is also what was dividing the rods' contribution out of each half.

eye · Cones

Named alongside it

The objects these essays reach for when they reach for this one.

The von Kries transformBasisTest setReflectanceIlluminantCAT16AdaptationCone fundamentalsAssertionSpecificationWhite pointResidual

All concepts