An afterimage is an adaptation
Assumes Four ways to move a white point and Constancy is the default.
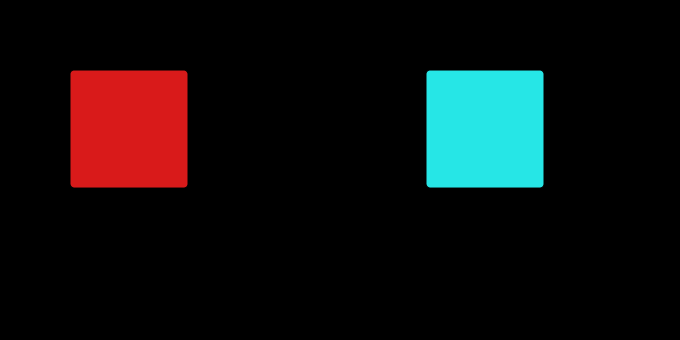
Stare at a red square for thirty seconds and look away, and something cyan appears. The demonstration in every textbook and every explainer is an image with its colours inverted, and the explanation is that the opponent channels are tired.
The inversion is a statement about a file format. The tiredness is a statement about a mechanism nobody has to guess at, because the arithmetic is the same arithmetic this site already uses for chromatic adaptation.
The claim
An afterimage is the same von Kries gain change that produces colour constancy, applied locally and to the wrong scene. The prediction is arithmetic:
with the adapting patch’s cone excitations, the field’s, how far the gains have moved, and running over the three cone classes. At each class is fully scaled by the reciprocal of what it has been receiving, which is exactly what an adaptation transform does to a white point — the only difference being that here it happens to a patch of retina rather than to a whole scene.
And the prediction is not the inverse of anything. Over four adapting colours the two answers differ by up to 45 units of ΔE00, and by up to sixty degrees of hue.
The gains
For a saturated red adapting patch, at fifteen per cent adaptation, the three gains come out as
| cone class | gain |
|---|---|
| long | 0.82 |
| medium | 1.22 |
| short | 3.77 |
The short-wavelength gain is enormous because a saturated red delivers almost nothing to the S cones, and the reciprocal of almost nothing is large. That single asymmetry is why the predicted afterimage is blue rather than cyan, and it is invisible to any account that works in red-green-blue code values, where “the opposite of red” is a symmetric statement.
The measured hue displacements, at the same adaptation:
| adapting colour | predicted afterimage | inverted code values | hue gap |
|---|---|---|---|
| red | 256° | 196° | 60° |
| green | 314° | 334° | 21° |
| blue | 83° | 94° | 11° |
| yellow | 300° | 304° | 4° |
Red is the worst case and it is also the case every demonstration uses.
Why the naive version is close enough to survive
Inverting code values is not a random procedure; it is an approximation with a reason, and it works about as well as it does because the sRGB primaries are roughly aligned with the cone-opponent directions. Subtracting each channel from its maximum moves a colour to the other side of the neutral axis, which is broadly where the afterimage is.
Where it fails is the shape of the move. The reciprocal is nonlinear and asymmetric — a channel receiving one tenth of the field’s stimulation gets a gain of ten, and a channel receiving twice gets a gain of a half — while the subtraction is linear and symmetric. So the two agree near neutral, where the gains are near one, and diverge for saturated adapting colours, where the whole demonstration lives.

What the display cannot show, and what that means
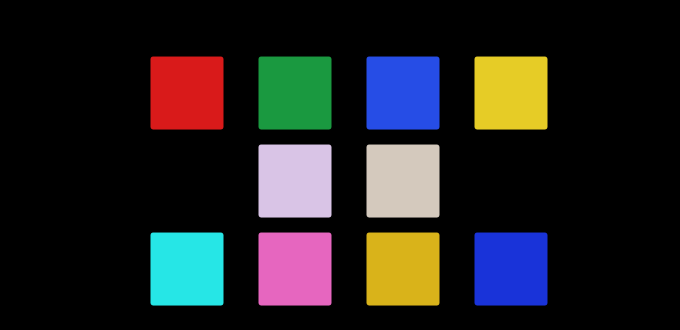
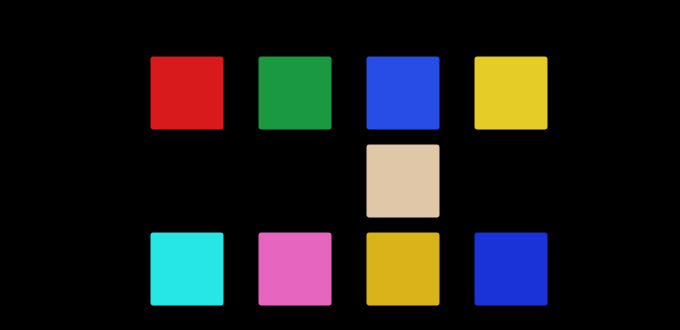
Every predicted afterimage in this essay is drawn with the site’s standing rule: a colour outside the display’s gamut is hatched rather than clipped. At fifteen per cent adaptation three of the four predictions are already outside sRGB, and by thirty per cent all of them are.
That is not a defect in the drawing. It is the honest form of a real fact: the afterimage of a saturated stimulus is more saturated than a display can produce. An adaptation state raises a cone class’s gain without bound, and there is no code value that corresponds to “the field, with the short-wavelength channel multiplied by 3.8”.
It is also why the model over-predicts. There is no response compression in this arithmetic, so the chroma it returns is a ceiling rather than an estimate — the strongest prediction here is more saturated than anybody reports seeing. What the model is trusted for on this page is the hue and the direction, and the chroma is quoted as a bound.
The controls
Two, and both are exact.
Adapting to the field itself leaves nothing. Set the adapting patch equal to the blank field and every gain is exactly one, so the field comes back unchanged to within 10⁻⁹. A model that produced an afterimage from staring at nothing would be producing it from arithmetic.
And the effect grows monotonically with the adaptation. Chroma rises from 0 at zero strength through 60, 101 and 134 to 162 at complete adaptation, with the hue fixed. The zero is exact.
Those two are what make the interesting number — the gap between the prediction and the inversion — worth anything. The gap is asserted to exceed ten units and comes out at up to forty-five.
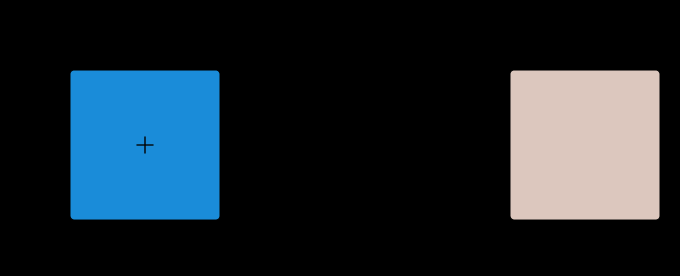
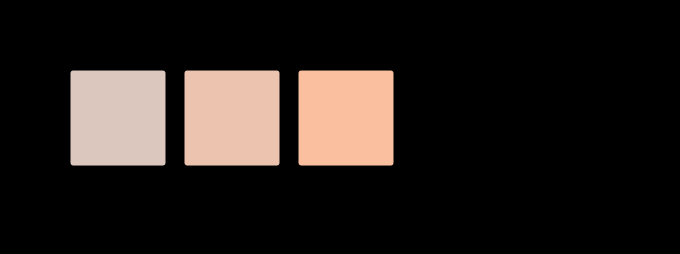
Two more readings of the same construction say how much of the predicted afterimage is the adapting colour and how much is how far the gains have moved.
The convention survives because the correction is undrawable
There is a reason the inverted image has held its place for a century that is better than nobody having checked, and this essay’s own figures are the evidence for it.
Every prediction here at a strength worth demonstrating is outside the display’s gamut and comes out hatched. So a textbook, a lecture slide or a web page setting out to illustrate the receptoral account cannot do it: the colour it would have to print or display is not available in print or on a display. What such a page can draw is the inversion, because an inverted sRGB image is by construction inside sRGB.
The medium can render the approximation and cannot render the thing it approximates. That is a much stronger form of selection than inertia. Anybody who worked out the correct answer over the last hundred years then had to choose between publishing a figure they could not draw and publishing one they could, and the second is what appears in the books.
It also explains why the error is largest in the case everybody uses. A demonstration wants a vivid adapting patch, because a weak one gives a weak afterimage; a vivid patch is exactly what starves one cone class, which is exactly what makes the reciprocal diverge from the subtraction. The conditions that make the demonstration work are the conditions that make the shortcut wrong, and the two have never been separable on a page.
The one place they are separable is a reader’s own retina, which is not a display and has no gamut. That is the whole reason the fixation figure exists on a site that otherwise refuses to assert anything it has not computed.
What else follows if the prediction is right
The single checkable claim above is an absolute judgement — closer to blue than to cyan — and absolute judgements about a private afterimage are the least reliable kind. The same arithmetic yields a comparative one, which is easier to trust and harder to talk oneself into.
The discrepancy is not uniform across adapting colours. Red is 60 degrees out, green 21, blue 11, yellow 4. So a reader who runs the demonstration on a saturated yellow patch should find the inverted-image account essentially correct, and the same reader running it on a saturated red patch should find it plainly wrong. Two experiments, five minutes, and the comparison between them does not require anybody to name a hue in absolute terms.
If both came out fine, the receptoral account is adding nothing over the convention. If both came out wrong, something other than the gains is doing the work. Only the split result — wrong on red, right on yellow — is what this model predicts, and it is a pattern rather than a value, which is the kind of prediction a private observation can actually bear.
That is also the honest reading of the table. The convention is not wrong; it is wrong in one place, and the place is the one it is always demonstrated in.
The same arithmetic, three situations
What makes this worth an essay rather than a footnote is that one three-line transform covers three things usually taught separately.
Colour constancy is the gain change tracking the scene’s illuminant, so that a sheet of paper looks white under daylight and under tungsten. The visual system is solving one equation with two unknowns and the gains are its answer.
An afterimage is the same gains left over from a scene that has gone. The mechanism is doing exactly what it does all day; it is simply wrong about what is in front of it now.
And a white-balance algorithm is the same operation performed deliberately by a camera, with the adapting state estimated from the picture rather than accumulated by staring. Every estimator is an assumption about the world — grey world, the brightest patch, the highlight — and each produces a gain triple that is then applied precisely as above.
Seeing the three as one transform with three ways of choosing its argument is more useful than three separate stories, and it makes the failure modes transferable: a camera that white-balances on a red wall produces the same error a person’s eye does after staring at one.
The failure modes are transferable and their consequences are not, which is worth one more line. The eye’s version repairs itself: the gains relax, and a minute later the observer is right again with no record that they were ever wrong. The camera’s version is written into a file. A photograph white-balanced on a red wall carries that error to every subsequent viewer, through every later correction, with nothing in it saying which estimate was made — and the person who made it had, at the moment of making it, an eye that was making the same mistake about the same room.
What was computed, and how
The cone basis is CAT16’s, which is the transform CIECAM16 adapts in and is available here as one of four. Choosing a different basis changes the gains by a few per cent and the argument not at all, which is a claim the machinery can check because all four transforms are already implemented here.
The adapting patch and the field are put at the same luminance before the ratio is taken, so that the gains are a statement about the balance of what each class has been receiving rather than about the exposure. Leaving them at their own luminances was the first version’s bug: it produced gains in the hundreds and an afterimage at a chroma no colour has.
The blank field is a mid-light grey — sixty per cent of the display white — rather than white. An afterimage raises the gain of the classes that were not stared at, and against a field already at the top of the display’s range there is nowhere for them to be lifted to; every prediction lands outside the gamut and every swatch comes out hatched. At sixty per cent the weaker predictions are drawable, and the level is stated in the code.
And the inverted code values are computed as per channel in encoded sRGB, which is what an image editor’s invert does, so the comparison is against the thing people actually use rather than against a straw version of it.
Where the model stops
No time. The gains are a parameter, not a trajectory. How fast they move, how long they persist and how they decay are all measured quantities and none of them is here — the adaptation clock is a different essay and models the scene-wide version.
No compression. A receptor’s response saturates; this arithmetic does not, which is why the chroma is a bound.
No rods, no spatial structure, and no filling-in. A real afterimage has an edge, drifts with the eyes, fades in a particular pattern and is filled in by the surrounding field — all of which are the interesting parts to a vision scientist and none of which is in a per-pixel gain model.
And no claim about the mechanism’s location. Photoreceptor bleaching, post-receptoral adaptation and cortical processes all contribute in proportions this arithmetic cannot separate. What is computed is what a receptoral account predicts; that it gets the hue roughly right is evidence, not proof.
A green patch is the case where the predicted direction is least like the inverted code values, which is what makes it the useful test.

The generalisation
The habit this essay is really about is: prefer the mechanism’s arithmetic to the demonstration’s convention.
Inverting an image is a convention. It survives because it is one line of code, because it looks approximately right, and because nobody checked it against the alternative. The alternative was not hard — it is the same three-line transform this site already uses for constancy — and it disagrees by sixty degrees of hue in the case everybody demonstrates.
The same shape appears elsewhere on this site whenever a convention stands in for a computation. Simulating colour blindness by desaturating an image is the same class of error, and the correct construction is again a projection in a cone space. The “opposite” of a colour on a hue wheel is a third: the wheel’s geometry is a drawing convention and the unique hues are measurements, and they disagree by tens of degrees.
The test that separates them is always the same question: what would this be if it were computed from what the receptors do?
Who found it, and when
Afterimages are older than colour science; they are described in classical antiquity, and Goethe made them central to his account of colour in 1810.
The receptoral explanation is von Kries’s, at the end of the nineteenth century: independent gain control in each of the three receptor classes, which is the same hypothesis that underlies every chromatic adaptation transform in use today and every white-balance algorithm in every camera. That an afterimage and colour constancy are the same mechanism seen in two situations is the substantive claim, and it is over a century old.
What is more recent is knowing how incomplete the receptoral story is. Adaptation happens at several stages, afterimages have components that follow the eyes and components that do not, and filling-in is a cortical process. The arithmetic here is the first term of a longer expansion, and it is the term that gets the hue right.
A stronger gain change makes the disagreement with the folk version larger without changing which way either points.
What the pictures cannot show
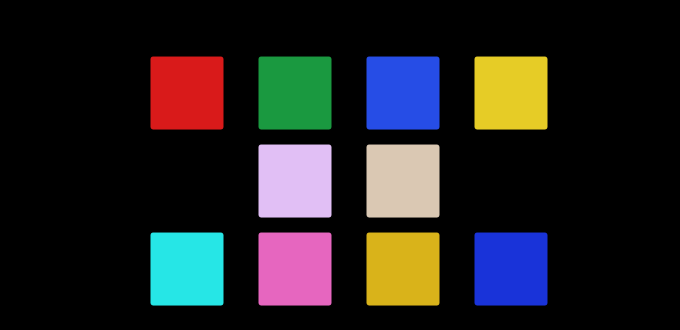
The afterimage itself. Every prediction on this page is drawn as a patch beside the adapting colour, which is precisely the arrangement in which no afterimage occurs — the reader is looking at both at once. The only figure that could show the effect is the one that asks the reader to do the experiment, and its result is a private judgement rather than anything the page can assert.
And most of the predictions are unreachable anyway. At any adaptation strong enough to be worth demonstrating, the predicted colour is outside the display’s gamut and is hatched. That is the site’s rule working as intended, and it means the strongest claims in this essay are ones the medium is structurally unable to illustrate.
The one number a reader can check
Everything in this essay is a prediction about a private experience, with one exception worth stating separately: the hue of the afterimage of a saturated red is closer to blue than to cyan.
That is a comparison rather than a measurement, it needs no apparatus, and it is the sharpest way to test the receptoral account against the inverted-code-values one. The prediction is 256 degrees of hue angle against the inversion’s 196 — sixty degrees apart, which is not a subtle distinction — and the reason is one line: a saturated red delivers almost nothing to the short-wavelength cones, so their gain rises most.
If the effect looked cyan, the model would be wrong in a way that mattered. It is the kind of claim this site likes: cheap to make, cheap to refute, and derived rather than asserted.
Where the ladder goes next
The obvious continuation is the clock. Gains that move take time to move, and an afterimage is the transient of a system whose steady state is constancy — so a model with a time constant would predict both the afterimage’s growth and its decay from one mechanism. The adaptation clock builds the scene-wide half of that, and joining the two is a phase’s worth of work rather than an essay’s.
The second is spatial, and it is where a receptoral account plainly runs out. An afterimage has a shape, it is filled in by whatever surrounds it, and it interacts with the edges of the new scene — which are all statements about the spatial machinery rather than about cone gains. A model with both would be able to say why an afterimage’s edge is the last part to fade.
Where this goes next
 Four ways to move a white point
Every chromatic adaptation transform is the same three lines with a different matrix. The matrices disagree by more than any tolerance a supplier is held to, and the oldest one — still shipping, still called von Kries — is not a cone basis at all.
Four ways to move a white point
Every chromatic adaptation transform is the same three lines with a different matrix. The matrices disagree by more than any tolerance a supplier is held to, and the oldest one — still shipping, still called von Kries — is not a cone basis at all.
 Constancy is the default
A sheet of paper looks white in daylight and white under a tungsten lamp, although the light reaching the eye differs enormously. The visual system is solving one equation with two unknowns, and it solves it by assumption.
Constancy is the default
A sheet of paper looks white in daylight and white under a tungsten lamp, although the light reaching the eye differs enormously. The visual system is solving one equation with two unknowns, and it solves it by assumption.
 Three cones, two axes
The retina does not send three receptor signals down the optic nerve. It sends a sum and two differences, and the reason falls out of the statistics of natural light rather than out of anything the eye intended.
Three cones, two axes
The retina does not send three receptor signals down the optic nerve. It sends a sum and two differences, and the reason falls out of the statistics of natural light rather than out of anything the eye intended.
What this makes readable
Essays that name this one as a prerequisite.
Named alongside this one
Essays reaching for the same objects. Nobody chose these; they are what the index of named objects makes visible.
- The filters inside the eye adaptation · assertion · chromatic adaptation · cone fundamentals · individual variation · the von kries transform
- A gain is not an observer assertion · chromatic adaptation · cone fundamentals · individual variation · the von kries transform
- A gain needs a basis adaptation · assertion · chromatic adaptation · cone fundamentals · the von kries transform
- A viewing condition is a moment adaptation · assertion · chromatic adaptation · colour appearance · the von kries transform
- A camera balances in another basis adaptation · assertion · chromatic adaptation · the von kries transform
- A gamut has a population assertion · cone fundamentals · gamut · individual variation
What links here
Every essay whose body links to this one.
The objects this essay names
Each one links to every other essay that touches it.
AdaptationAfterimageAssertionChromatic adaptationColour appearanceCone fundamentalsGamutIndividual variationOpponent processingThe von Kries transform