Series

Appearance — the series

53 essays on one idea, from the one that introduces it to the one that assumes the rest.
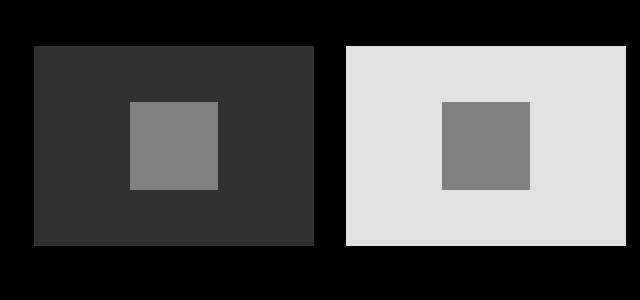
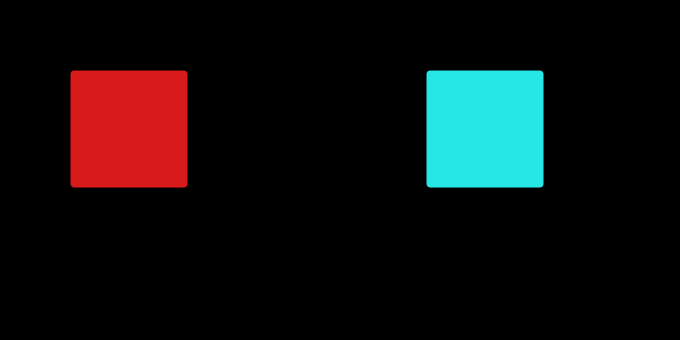
  1. Two identical grey patches on different surrounds. Both inner squares are #818181. The one on the dark field looks lighter. The values are checked to be equal before the figure is drawn, so the claim is a fact about the drawing rather than a promise.

    These two patches are identical

    It is the most repeated and least checkable sentence in visual perception, because the whole point is that it does not look true. Every instance here is computed, and checked before the figure is drawn.

    part 1 · brain
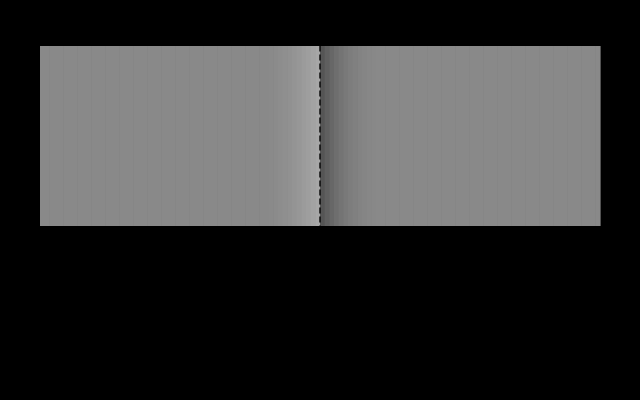
  2. The Cornsweet edge, with its luminance profile. The two plateaux are both #898989 and are flat to exactly — the profile below shows that everything which differs lies within a narrow band at the boundary. Cover the centre line and the two halves become obviously identical.

    Brightness is inferred from edges

    The Cornsweet effect makes two identical regions look different by altering nothing except a narrow band at the boundary between them. Cover the boundary and the difference vanishes, which says the visual system is reconstructing surfaces rather than reading off intensities.

    part 2 · brain
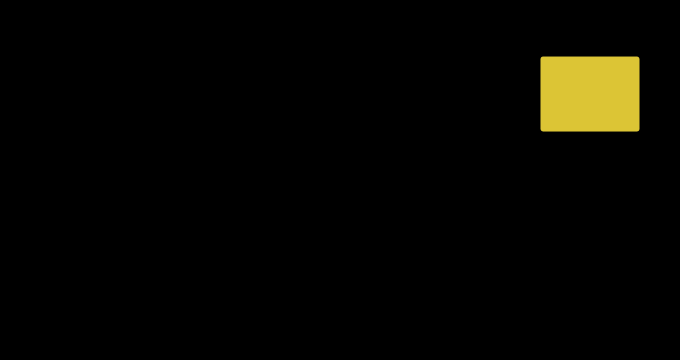
  3. One reflectance, two illuminants, two colours. A reflectance peaking near 580 nm, and the colours it produces under D65 and A. The object has not changed. The light has, and colour is a property of the pair.

    Constancy is the default

    A sheet of paper looks white in daylight and white under a tungsten lamp, although the light reaching the eye differs enormously. The visual system is solving one equation with two unknowns, and it solves it by assumption.

    part 2 · brain
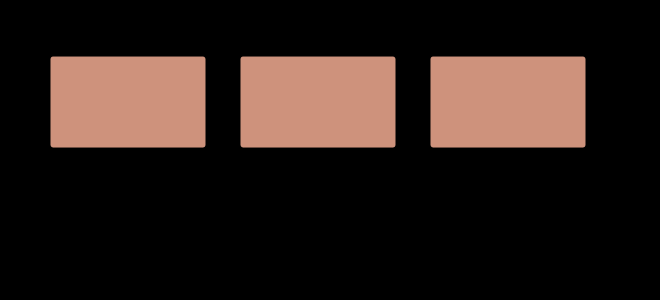
  4. One stimulus, three rooms, three appearances. The same XYZ in a dark, a dim and an average surround. The stimulus does not change and is drawn identically in all three panels; what changes is what CIECAM16 says it looks like. Predicted lightness runs from 65.6 to 57.5 — a spread of 8.1 — with chroma and colourfulness moving too. Colorimetry returns one answer here because it has nowhere to put the room.

    A viewing condition is an argument

    An appearance model takes a stimulus and a situation. The second argument is not a refinement of the first — it is the content of the claim, and a model that returns an appearance from a colour alone has assumed a room without saying which.

    part 3 · brain
  5. Four adaptation transforms, measured against CAT16 (D65 to D50). Twenty-seven colours moved from D65 to D50 by each transform, compared with the current recommendation. Bars are the worst disagreement in CIELAB, the number beside each is the mean. Plain XYZ scaling — still shipping, still called von Kries by people who have not read von Kries — misses by up to ΔE 13.7, which is many times any tolerance a supplier would be held to.

    Four ways to move a white point

    Every chromatic adaptation transform is the same three lines with a different matrix. The matrices disagree by more than any tolerance a supplier is held to, and the oldest one — still shipping, still called von Kries — is not a cone basis at all.

    part 3 · brain
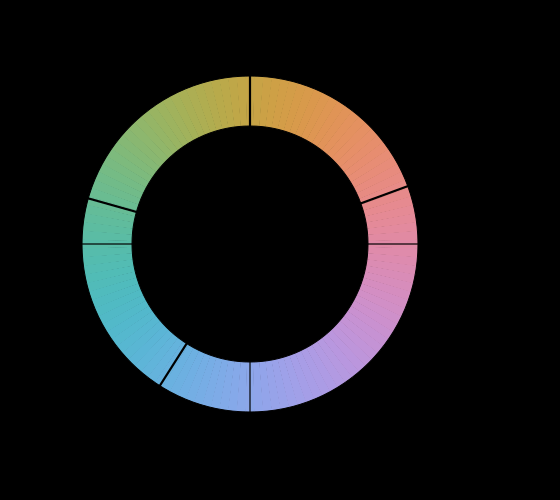
  6. The four unique hues, and the axes they are said to define. A constant-lightness, constant-chroma ring in CIECAM16, with the four unique hue anchors marked and CIELAB's a and b axes drawn through the same circle. If a* really were the red-green axis the anchors would fall on the crosshairs. Unique red sits 25° off, and the four are not 90° apart in any case. Hatched sectors are hues this display cannot reach at this chroma.

    Why there are four unique hues

    Observers agree that four hues are elementary and that no colour is reddish green. Nothing in the three receptors predicts either fact, and the axes of every standard colour space miss the four by tens of degrees.

    part 3 · brain
  7. One adapting colour, two answers. The left patch is what was stared at. The middle is the afterimage the cone-gain arithmetic predicts at 15 per cent adaptation; the right is the inverted code values. They are 22.1 ΔE00 apart. The gains that produced the middle patch are 0.95, 1.06, 1.69 on the long, medium and short cone classes — the reciprocal of what each class had been receiving, taken 15 per cent of the way.

    An afterimage is an adaptation

    The demonstration everybody gives is an inverted image, which is a statement about a file format. Running the receptoral arithmetic instead puts the afterimage of a saturated red sixty degrees of hue away from the inverse — and outside what any display can show.

    part 3 · brain
  8. Colourfulness rises with light level; apparent contrast does not. Predicted colourfulness M for one stimulus across four decades of adapting luminance, and the exponent of the lightness curve over the same range. M rises by a factor of 2.24 — the Hunt effect, which the model does predict. The lightness exponent changes by -2.2%, and in the wrong direction — the Stevens effect, which it does not.

    Brighter looks more colourful

    Colourfulness rises with light level and the model predicts it. Apparent contrast is supposed to rise too, and the model does not — which turns out to be right, because the thing that actually carries contrast is the surround.

    part 4 · brain
  9. Brightness against chroma, at exactly constant luminance. Seven stimuli of identical luminance and rising chroma at hue 25. The model's brightness moves by 2.2 per cent across the whole sweep, and at some hues it moves the other way. The Helmholtz–Kohlrausch effect — measured repeatedly, by several methods — is that a saturated colour looks as bright as a neutral of 1.3 to 2 times its luminance, shown as the band. The gap is the model's, and nothing here closes it: the term that would is not in CIECAM16 and is not invented for the occasion.

    Brightness is not luminance

    Photometry is additive because the CIE defined it that way. Brightness is not, and a saturated colour looks as bright as a neutral of one and a half times its luminance — an effect this site's appearance model moves by two per cent, in a direction that depends on the hue.

    part 4 · brain
  10. One light, seven rooms. The same stimulus — fixed in XYZ, unchanged throughout — shown against whites from 12 to 800 candelas per square metre. Its lightness falls from 152 to 16 and its brightness rises, because one of those is a ratio to the white and the other is not. Brown is the low-lightness end: a colour that exists only when something brighter is present, which is why no lamp is brown and no star is.

    There is no brown light

    Brown is dark orange, dark is a ratio to a white, and a light in a dark room has no white to be dark against. The same stimulus, unchanged in XYZ, runs from lightness 152 to lightness 16 as the surround is raised — and only the bottom of that range has a name.

    part 4 · brain
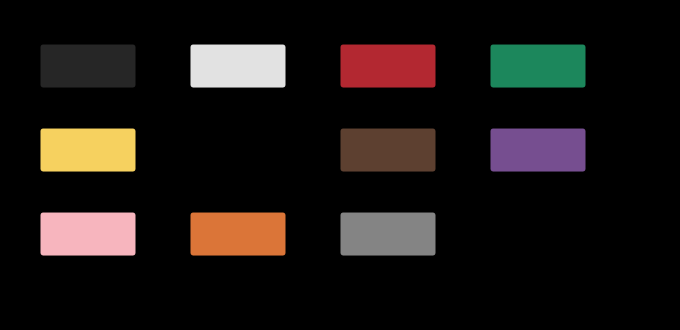
  11. The eleven basic colour terms, at their quoted centroids. Each patch is the CIELAB centroid quoted for that term, converted to a stimulus and drawn — except blue, whose focal colour is outside the sRGB gamut and is therefore hatched rather than clipped, which is the rule for an unreachable colour everywhere else and applies here too. The centroids are rounded to 5 units in each coordinate, and moving them by that much either way leaves the same term outside.

    A colour has a name

    Every quantity here is a number, and the question a reader arrives with is what colour something is called. The eleven basic terms of English divide the space into territories that differ by a factor of five, the metric accounts for fifteen per cent of that, and one of the eleven focal colours cannot be shown on this page at all.

    part 4 · brain
  12. five greens, no neutral, under D65 — four guesses at the illuminant. The scene's surfaces as they reach the eye, and each estimator's angular error in degrees against the illuminant that actually lit them. Grey-world 43.1°, Max-RGB 27.7°, Shades-of-grey (p = 6) 31.4°, Grey-edge 34.4°. The best here is Max-RGB, which is best because this scene happens to satisfy its assumption — something reflects fully in every band — and not because it is the better algorithm. Any hatched patch is a surface this display cannot show under this light.

    The algorithms that guess the light

    What reaches a sensor is an illuminant multiplied by a reflectance, and no arithmetic separates a product into its factors. Every white-balance algorithm therefore works by assuming something about the world — and the interesting content of each is not its formula but the assumption, because a scene can violate it.

    part 5 · brain
  13. One stimulus, three rooms, three appearances. The same XYZ in a dark, a dim and an average surround. The stimulus does not change and is drawn identically in all three panels; what changes is what CIECAM16 says it looks like. Predicted lightness runs from 65.6 to 57.5 — a spread of 8.1 — with chroma and colourfulness moving too. Colorimetry returns one answer here because it has nowhere to put the room.

    A patch is not a scene

    A paint chip is the wrong size, on the wrong background, at the wrong luminance, in the wrong surround. Every one of those is a term in an appearance model, and the model says how much each of them moves the answer — which is the difference between a caution and a prediction.

    part 5 · brain
  14. An afterimage, as the local pool coming back to equilibrium. The local pool has adapted to the patch and the global pool has not, so the gain change is exactly the local share of a full von Kries change — which is why afterimage's free strength parameter is not free here. The dwell is 20 seconds. The swatches are the predicted appearance of the test surface at four moments. They are predictions of hue and direction; there is no response compression in this model, so the chroma is a ceiling rather than an estimate.

    A gain has a time constant

    An afterimage and the clock on chromatic adaptation were built in different files from what the last phase said was one mechanism. Joining them removes a free parameter, reproduces both, and predicts a third thing — that two people in one room, at one moment, looking at one patch, do not agree about its colour.

    part 5 · brain
  15. The eye's own drift, and what it does to every spatial frequency. A pattern of f cycles per degree, drifting across the retina at 0.5 degrees a second, arrives at each receptor at f × 0.5 hertz. The curve is the temporal sensitivity at that rate, against the pattern's spatial frequency. Every frequency the eye can resolve stays above a quarter of the temporal peak, and the band of drift speeds for which that holds is 0.02–0.71 degrees a second — with the measured drift inside it. Faster and the finest detail is carried past 60 hertz, where there is no sensitivity at all.

    The eye is never still

    A perfectly stabilised retinal image disappears within seconds. What keeps the world there is a drift of about half a degree a second between the microsaccades — fast enough to keep the finest detail modulating and slow enough not to carry it past fusion, in a band whose upper edge is at 0.71 degrees a second.

    part 5 · brain
  16. How large a step changes the name, across the ab plane at L* 60. At each point, the smallest ΔE00 step in any direction after which the probability of two people using the same word has halved. It runs from 4.8 to 33.8 units across this one plane, in eight quantised levels: the palest cells are where a name is finest — a short step changes it — and the strongest are the middles of large territories, where a colour can move twenty units and keep its word. The ragged edge is the sRGB boundary at this lightness rather than a property of the vocabulary. The boundary softness is a stated parameter of the model, and the map barely moves when it is changed fourfold, because what sets this quantity is how far apart the centroids are.

    A name is not a threshold

    Two colours have to move about ten times a just-noticeable difference apart before people stop calling them the same thing, and how far varies threefold across one plane of the space. A tolerance and a word are answering different questions, and nothing in colorimetry converts between them.

    part 5 · brain
  17. The appearance model's three rooms, read as three moments. CIECAM16's degree of adaptation is a function of the surround and the adapting luminance and of nothing else — the model has no time in it. Solving for the moment at which an observer who will adapt completely has got that far turns each of the three tabulated surrounds into a reading on a clock. At 100 candelas per square metre they are 106, 49, 21 seconds. They are presented as three rooms. They are also one observer, in one room, at three times in the first two minutes.

    A viewing condition is a moment

    CIECAM16's degree of adaptation is a function of the surround and the adapting luminance and of nothing else, because the model has no time in it. Solving for when an observer who will adapt completely has got that far turns the standard's three surrounds into three clock readings — 107, 50 and 21 seconds — and the two readings are distinguishable by waiting.

    part 6 · brain
  18. How much of the gamut changes name, and what changed it. The eleven basic terms are quoted as centroids in CIELAB, and a colour is named by which one it is nearest. Two things nobody records decide the answer. Changing the distance function renames 20.5 per cent of the displayable gamut. Changing the room — the same colours, the same words, a different surround, through the appearance model — renames up to 26.8 per cent. The centroids were measured in one viewing condition and are applied here in every essay as though a name were a region of a space with no room in it.

    A name moves with the room

    Eleven basic colour terms are quoted as centroids in CIELAB and a colour is named by which one it is nearest. Two things nobody records decide the answer — which distance function is used, which renames a fifth of the displayable gamut, and which room the colour is in, which renames more than a quarter of it.

    part 6 · brain
  19. Every published adaptation transform, and one computed from daylight, on every change. What each basis leaves an adapted observer with, row by row. Darker is worse. The last column is not a published transform: it is the basis in which a change from D65 to D50 is exactly diagonal, computed in closed form from the two spectra with nothing fitted. It is far the best on the daylight rows and it is beaten on the discharge lamps, which is the trade the published transforms are sitting in — they were fitted to data containing both kinds of light and are therefore optimal for neither. Over the census as a whole the winner is Bradford at ΔE00 1.14.

    A gain needs a basis

    Adaptation scales three signals, and which three is a choice. The basis in which a change from D65 to D50 is exactly diagonal can be computed in closed form from the two spectra, it beats every published transform on daylight by a factor of five, and it loses to all of them on a fluorescent tube.

    part 7 · brain
  20. How much of what a display can show each name owns. Every point on a 5-unit CIELAB lattice inside the sRGB gamut is given to its nearest centroid under ΔE00, and the shares counted. They run from 21.1 per cent for purple to 4.6 for blue, a factor of 4.6. The three terms that carry no chroma at all — black, grey and white — hold 20 per cent between them. A share here is a statement about the names and about the gamut they are counted over, and the gamut is sRGB.

    A name in the model's own words

    The eleven basic colour terms move when the room does, and the obvious objection is that they were being measured in a space with no room in it. Quoting them in an appearance model's own coordinates instead does not shrink the renaming — it grows it by four per cent — and the space alone renames an eighth of the gamut with the room held still.

    part 7 · brain
  21. How blue the sheet reads, and how much of that is the room. Chroma in an appearance model, with the observer adapted to the light the sheet is under. The three markers on each row are an average, a dim and a dark surround; the open marker at the left is the same sheet with the ultraviolet removed. Every stock is close to neutral without the excitation and carries real chroma with it, at a hue of about 295 degrees — blue-violet — so the colour is the fluorescence and not the substrate. And it falls by nearly half between a bright room and a dark one, which makes how blue a sheet looks a property of where it is being looked at.

    A brighter white still looks white

    Colorimetry says a brightened sheet is nine units of b* from neutral, which sounds like a visible blue. An appearance model with the observer adapted to the room says it carries eleven units of chroma at a hue of 295 degrees — genuinely blue-violet — and that the number falls by nearly half between a bright room and a dark one. What it cannot say is why anybody calls the result white.

    part 7 · brain
  22. Where each published matrix puts the confusion points, whether or not it meant to. Every matrix from tristimulus values to cone responses commits itself to three confusion points, because the point is the direction the other two rows annihilate. The first row is the construction from the measured points and returns them exactly. The rest were chosen for other reasons and land elsewhere — Hunt–Pointer–Estévez, which this collection uses everywhere, misses the deuteranope's point by 1.28 in chromaticity. The worst here is 4.09.

    The cones an appearance model uses

    CIECAM16 adapts in three axes whose rows are labelled L, M and S, and they were fitted to corresponding-colour experiments rather than measured on receptors. Run the dichromat construction backwards on them and they commit to a deuteranope confusion point 1.45 away in chromaticity from the measured one — which is a test the axes were never asked to pass.

    part 8 · brain
  23. Every basis against both objectives at once. A scatter with the mean adaptation residual across the illumination census on the horizontal axis and the mean axis ratio of MacAdam's ellipses in a lightness–chroma space on the vertical. Lower is better on both. The two winners sit at the two ends of an empty diagonal: the basis that adapts best leaves 7.70 on the vertical and the basis that discriminates best leaves 1.79 on the horizontal, each worse on the other objective than every published transform. The basis built from the dichromat confusion points is at (1.65, 2.60) — best at neither and within a factor of two of both floors, which no other entry in the picture manages.

    No basis is good at both

    The same nine numbers decide how well a von Kries gain reproduces a change of light and how nearly a lightness–chroma space makes the discrimination ellipses circles. Minimise either one and the other collapses. The basis built from the receptors is best at neither and is the only entry in the table respectable at both.

    part 9 · brain
  24. How far from circles every basis leaves the ellipses. Eight bases ranked on the mean ratio of the long to the short axis of MacAdam's twenty-five discrimination ellipses, measured in a lightness–chroma space built on that basis. The range runs from 1.61 for best for discrimination to 7.70 for best for adaptation. The ordering is not the ordering on the other objective and is nearly its reverse.

    One matrix doing two jobs

    CIECAM16 adapts in CAT16 and then applies its response compression in the same axes, so a single matrix decides both how well the model handles a change of light and how uniform the space it produces is. The two jobs have different best answers, and the matrix was chosen against only one of them.

    part 9 · brain
  25. A mid-grey's lightness across a continuum of rooms. The lightness a mid-grey is predicted to have, plotted along the continuous surround parameter running from an average room to a dark one. The three rooms the standard tabulates are marked on it: average at the left, dark at the right, and dim 61% of the way between them rather than halfway. The whole span is 9.71 units of lightness and the step from average to dim is 5.64 of it — 58% — so choosing one of the three rows is a decision worth most of the range.

    The surround is three rows of a table

    An appearance model takes the room as three constants, and the standard tabulates three rooms. Every appearance figure in this collection is drawn at one of them. The parameter they are three points of is continuous, and the middle row is not in the middle.

    part 9 · brain
  26. The cheapest direction to give ground in is the flattest one. Six bars, one per direction the adaptation objective can see, showing how much of the other objective a fixed budget of adaptation buys if it is spent along that direction. The rate is the slope of the second objective divided by the square root of the first's curvature, so it rewards a direction the second objective wants and punishes one the first is stiff in. The flattest direction wins at 10.68 against 3.29 for the next best and 0.54 for the stiffest — a factor of 20. Spending 1 per cent of the adaptation optimum there moves the anisotropy from 7.70 to 5.02.

    The trade only runs one way

    Standing at the basis that adapts best, one per cent of adaptation buys forty-four per cent of the way to the discrimination floor. Standing at the basis that discriminates best, the same one per cent buys under two. The scatter that shows two objectives pulling apart looks symmetric and is not, and the asymmetry is what a committee choosing between them would most want to know.

    part 10 · brain
  27. A population of receptor bases, in the plane the published ones live in. The two axes this collection scores an adaptation basis on — the residual across the illumination census on the horizontal, ellipse anisotropy on the vertical, lower better on both — with 200 extra points on it. Each is the basis a member of the population's own confusion points determine. The cloud is not a point: it runs from 1.22 to 2.24 ΔE00 horizontally, which is wider than the whole spread of the published transforms marked on it. The observer this site quotes sits inside the cloud and near one edge of it, and the sentence "the receptor basis costs seventy per cent" is a sentence about that one point rather than about the construction.

    A trade between matrices, not people

    Across the space of possible bases, adapting well and discriminating well pull in opposite directions — the two optima sit at the ends of an empty diagonal. Across a population of actual observers the same two costs move weakly together, at a correlation of +0.29. The trade-off is a property of the set of matrices somebody could choose, not of the eyes anybody has. One measurement inside the population does trade, and it is the macular pigment.

    part 10 · brain
  28. Every adaptation number here assumes a complete adaptation. Three curves and their mean: the colour difference an adapted observer is left with after a change of light, against the degree of adaptation from zero — no adaptation at all — to one. Every adaptation figure in this collection is computed at one, the right-hand end. The appearance model's own formula puts the degree at 0.941 for an average surround at a hundred candelas, marked, where the residual is 2.21 ΔE00 rather than 1.27 — larger by a factor of 1.74. The left-hand end is exactly the unadapted change, which is not an approximation but an identity, and is what says the curve interpolates between the two things it claims to.

    A discount nobody measured

    Every adaptation number in this collection assumes an observer who adapts completely. The appearance model's own formula says they do not — it puts the degree at 0.94 in an ordinary room — and the difference is not a rounding. It is a factor of 1.7 on the residual every one of those figures reports.

    part 10 · brain
  29. The same claim in nanometres of pigment, where no declared width can reach it. Five horizontal bars on a scale of nanometres, one per published chromatic-adaptation transform, each showing how far the medium-wave cone pigment's absorption peak would have to move for the receptors' own protan confusion point to land where that transform puts it. Zero is the measured peak. The bars run from -10.5 to 18.2 nanometres — in both directions, so two of the transforms want the pigment shorter and two want it longer. Drawn across them is the 25 nm separation between the L and M pigment peaks, which is the whole basis of red-green vision and is not a number this collection declared. The nearest transform asks for a displacement of 30 per cent of that separation, and the span across the table is 28.7 nanometres — larger than the separation itself. No population, cloud or standard deviation appears anywhere in the statement.

    Five transforms and the space between them

    Every appearance prediction here chooses one of five published adaptation transforms, and the five disagree about where a protanope's confusion lines meet by more than the distance between the two pigments the disagreement is about. That spread is itself a scale, and using it needs no population model at all.

    part 11 · brain
  30. Two slabs with one reflectance, and two colours through an aperture. Two constructed media whose bulk reflectance agrees at every wavelength to fifteen figures, and whose diffusion lengths differ by a factor of four. The upper curve is that shared reflectance — both slabs lie on it exactly. The two patches on the right are what a 4 millimetre radius returns from each, and they are 6.3 ΔE₀₀ apart. This is a metamerism with no observer in it: the two samples are the same colour to anybody under any light, and the instrument separates them because it is measuring a kernel through a hole rather than measuring a reflectance.

    The appearance model has no slot for it

    Two slabs with identical reflectance and different kernels come out of CIECAM16 with identical lightness, chroma and hue — to six decimal places, because the model's input is a stimulus and their stimuli are the same. Translucency is a recognised appearance attribute with no correlate in any appearance model, and the reason is structural rather than an oversight.

    part 12 · brain
  31. What six of this collection's published numbers do when the unit changes. Six quantities, from six calculations that share nothing: a change of light after an observer has adapted, a camera profile's error, the gap between the two standard observers, a metameric pair under the lamp that breaks it, the same image on two papers, and an observer two seconds into a new room. Each is recomputed under all six units and every unit is calibrated onto ΔE2000's scale first, so the bar is not a change of units in the ordinary sense. The bar is the ratio of the largest reading to the smallest, and it runs from 1.71 to 2.30. Five of the six are printed in ΔE2000 by the essays that report them; the sixth is printed in CAM16-UCS, because the model it comes out of defines that unit.

    A model judged in another model's unit

    An appearance shift is a change in what an observer would report, not a change in a stimulus, so measuring one with a matching difference means first asking what stimulus a settled observer would need to be shown to give the same report. That step is not bookkeeping — it is the whole distinction the field rests on, and it costs a factor of 1.7 across the menu.

    part 13 · brain
  32. Each departure over forty-two surfaces rather than one. The same six departures measured over a family of forty-two analytic reflectances — an absorption band of stated centre, width and depth — with the smallest, the median, the ninety-fifth percentile and the largest marked. Every one of them spans more than a factor of three, and the ranking between them is not stable across the family: what decides a departure's size is which sample it is asked about, because a departure is a pairing and the sample is one of the two factors. Quoting any single number for what an observer's age is worth is quoting a choice of example.

    The census under another observer

    This collection's largest computed result is an adaptation census — fourteen changes of light judged over a hundred and twenty-five constructed surfaces. Every number in it was computed through one observer, and the observer's own departures are between one and two and a half units on the same surfaces, which is the size of the effects the census reports.

    part 14 · brain
  33. What choosing a space to divide the white out in is worth. Three pairs of routes to the same colour, over forty-two surfaces: dividing the white out in tristimulus values, in a published cone space, and in the observer's own cones. The first two agree to 0.59 ΔE₀₀ at the median. Either of them differs from the observer's own cones by more than fifteen. That is why the two exact conditions in this round are exact only in the eye's own coordinates: the identity belongs to the receptors, and every published arithmetic works in a basis somebody else chose.

    The appearance model takes XYZ

    CIECAM16 predicts how a colour looks, and its input is three tristimulus values computed through a standard observer. Everything this round measures happens before the model is called, so an appearance prediction inherits six observer departures and a choice of cone space before it begins.

    part 14 · brain
  34. The two tabulation choices over forty-two surfaces, under a 6500 K thermal radiator. Each column is one choice, measured over a family of forty-two analytic reflectances rather than on a single example: an absorption band of stated centre, width and depth. The four marks are the smallest, the median, the ninety-fifth percentile and the largest cost in ΔE₀₀, logarithmically. Under a smooth light the range is worth 9.1 times the step at the median, so a collection wanting one repair should widen its range rather than refine its step — and under a fluorescent tube the ranking reverses outright.

    The grid under the census

    The adaptation census is computed on eighty-one wavelengths from 380 to 780 nanometres. Under the daylight and blackbody sources it uses, the range is worth about half a colour difference on ordinary surfaces and the step about a twentieth — so the census carries a tabulation term as well as an observer one, and they are not the same size.

    part 15 · brain
  35. Where a stated appearance has no stimulus under it. The chroma the inverse can still return a light for, at lightness 50, all the way round the hue circle. Below the curve a stated appearance corresponds to a stimulus; above it the formula still returns three numbers and one of them is negative. Over a lattice of 10488 appearances spanning the whole space a specification is written in, 10.8 per cent are of that kind, and only 44 per cent are colours a display could show.

    An appearance is not always a stimulus

    CIECAM16's inverse is a closed form that returns three numbers for every lightness, chroma and hue it is handed. Whether those three numbers are a light it does not ask, and over a lattice spanning the space a specification is written in, 10.8 per cent of them are not — one tristimulus value negative, or a relative luminance above the white's. Only 43.8 per cent are colours a display could show at all.

    part 16 · brain
  36. The model's hue scale, and the four numbers it is built from. Hue quadrature against hue angle. The four anchors are the unique hues, each with its own weight, and between them the scale is a hyperbolic interpolation rather than a straight line. The quadrant from blue back to red spans 143 degrees of hue angle for its hundred units of quadrature, against 70 for red to yellow.

    The hue scale has four corners

    CIECAM16 reports hue twice — as an angle in its own opponent plane, and as a quadrature interpolated through four unique hues with four fitted weights. The second is the one hue tolerances and hue-preserving mappings are written in, and it is piecewise — its slope jumps at each of the four anchors, by a factor of 1.74 at green and by 0.41 at blue, and it runs 4.1 times faster near yellow than near blue.

    part 16 · brain
  37. Where averaging the model's answers is and is not averaging its argument. Each row takes a spread of situations, averages the model's predictions across them, and compares that against the model's prediction for the average situation. The bar is the gap as a share of the spread itself. Over the differences between observers it is 1.4 per cent — the model is very nearly linear there. Over the range of adapting luminance one room covers in a day it is 59 per cent, and from indoors to outdoors 74.

    Where the model's curve does not matter

    This round has been about what a nonlinearity does to an average, and CIECAM16 is the most nonlinear thing in the collection. Over the spread a population of observers produces, the average of its predictions is its prediction for the average to within 1.4 per cent — the nonlinearity is there and the excursion is too small to reach it. Over the range of adapting luminance one room covers in a day, the same gap is 59 per cent of the spread, and from indoors to outdoors 74.

    part 17 · brain
  38. The audit's six departures, read twice. Each departure priced in the matching unit it was published in and in the appearance unit an appearance prediction would be judged by. The model does not scale them by one factor: it amplifies the smallest by 1.58 and the largest by 1.03, so the range between them narrows from 3.34 to 2.17. The mean ranking is unchanged and 14 of the 42 surfaces reorder.

    The audit, read as appearances

    The previous round priced six observer departures in a matching unit and left them there. Read in the appearance unit an appearance prediction would actually be judged by, they are not the same six numbers scaled by a constant — the model amplifies the smallest by 1.58 and the largest by 1.03, so the range between the largest and smallest term narrows from 3.34 to 2.17. The published ranking survives in the mean and changes on fourteen of the forty-two surfaces it was averaged over.

    part 17 · brain
  39. Which appearances a surface can have, lightness by lightness. The same lattice of lightness, chroma and hue a specification is written in, 10488 points, inverted under daylight with the observer adapted to it. Each row is one lightness, split into three shares: appearances a reflecting surface can have, appearances that are a light but that no surface can return, and appearances with no light under them at all. Over the whole lattice the first is 66 per cent, the second 23 and the third 11. At J 90 a surface can have 38 per cent of the row.

    A third of the appearance box is no surface

    An appearance specification is written as a lightness, a chroma and a hue, and the model's inverse turns any such triple into three numbers. A tenth of the space turns into something that is not a light at all. A further quarter turns into a light no reflecting surface can return, because a surface cannot give back more than all the light at any wavelength. So a third of the space a paint, a print or a dye is specified in cannot be made from paint, print or dye, and at lightness 90 nearly two thirds cannot.

    part 17 · brain
  40. What a stated lightness pins down, and where. A lightness quoted to 0.05 of a unit, inverted, and the luminance it fixes. Read as a fraction of the colour's own luminance the requirement is 0.90 per cent at J 10 and 0.097 at J 95, a factor of 9.3. Read in absolute luminance it is the other way round, by a factor of 6.5. Both readings are true and they answer different questions.

    A stated lightness is two requirements

    A specification quotes an appearance to a stated precision — a lightness to a tenth of a unit, say — and the same precision everywhere. Inverted, a twentieth of a unit of lightness fixes the luminance to nine tenths of one per cent at the bottom of the scale and to a tenth of one per cent at the top, a factor of 9.3. Read in absolute luminance it is the other way round by a factor of 6.5, and both readings are true.

    part 18 · brain
  41. How far the answer for the average is from the average answer, over eight spreads. For each spread of inputs, the distance between the mean of the model's answers and its answer for the mean input, as a share of the spread of the answers. Over a population of observers it is 1.4 per cent. Over surfaces it is 21 on smooth natural reflectances, 27 on a banded family with lightness in it, and 9 on a set of pale surfaces. Over the light one room sees in a day it is 59.

    The average surface does not look average

    Over a population of observers the appearance model is so nearly linear that the mean of its answers is its answer for the mean, to 1.4 per cent of the spread. Over the surfaces in a scene it is not. On 240 smooth reflectances the gap is 21 per cent of the spread, and the mean surface looks 4.2 units lighter than the surfaces look on average. The grey that matches the average light is a 47 per cent reflectance; the grey that matches the average look is a 43 per cent one.

    part 18 · brain
  42. How much of a display's gamut each observer names differently. Each of 60 observers names every colour of the displayable gamut that the panel can make — 823 of them — and the histogram is how much of that gamut each observer names differently from the standard observer. On an OLED panel the median observer renames 8.1 per cent and the furthest 13.1 per cent. Nobody agrees with the standard observer about all of it.

    A name moves with the reader

    Three earlier essays have moved a colour's name by changing the distance function, the room and the space. All three held the observer fixed. Handed the same light from the same display, sixty observers rename between 3.5 and 13.1 per cent of the gamut against the standard observer, a quarter of its colours have a dissenter in twenty, and the narrower the display's primaries the worse it gets.

    part 19 · brain
  43. How far CIECAM16 moves a monochromatic hue when the light is brightened thirtyfold. A monochromatic stimulus at a relative luminance of 2 and of 60, read through CIECAM16 in one room, and the difference between its two hue angles. The model was never fitted to this effect and has it anyway: the shift is positive at the short end, negative through the greens, positive again in the yellows and reds, and crosses zero at 459, 495, 502, 570 nanometres. The marks are the invariant wavelengths the literature reports — 474, 506, 571.

    The model has a hue shift it was never given

    A monochromatic light changes hue as it is brightened, except at three wavelengths that do not move — an effect measured since the nineteenth century and not among the things CIECAM16 was fitted to. The model has it anyway: brightening a stimulus thirtyfold moves its hue angle, and the places where the movement crosses zero land at 459, 495, 502 and 570 nanometres against the reported 474, 506 and 571. The sizes are another matter.

    part 19 · brain
  44. What the choice of adopted white is worth, in a room lit by two lights. A room lit half by daylight and half by an incandescent lamp. The light on the surfaces is fixed; what varies is the white the model is told the observer has adapted to, running from the lamp on the left to the window on the right. The median of twelve surfaces moves 32.6 CAM16-UCS units if the lamp is adopted and 24.5 if the window is, against the room's own mixture in the middle. The model offers no way to choose, and its degree of adaptation is 0.94 at every point of the dial.

    A room with two lights has no white

    An appearance model takes one adapting white. A desk beside a window has two, and the mixture falling on the paper is not the same thing as the white the person reading it has adapted to. Mixing the lights is arithmetic. Choosing the white is not, and the choice is worth sixty units of appearance — most of which is a cast, and not all of which is.

    part 20 · brain
  45. One grey scale, three backgrounds. CIECAM16's lightness against the luminance factor of a neutral sample, with only the background changed. A grey reflecting 19% reads 46.7 on a near-black background and 32.8 on a near-white one. The three curves are not three shapes: each is the same curve raised to a different power, because the background reaches lightness only through the exponent z, which runs 1.621 to 2.374 across the three.

    A dark background moves every difference and no match

    CIECAM16's background is one number, and it reaches lightness as one exponent. That is enough to change what a grey looks like and not enough to change which of two greys is lighter — so a match survives the background exactly, a corresponding colour is invariant to it, and a tolerance is not. The effect the background is usually invoked to explain is absent from the model entirely.

    part 21 · brain
  46. A crispening term puts the peak where the background is. How much lightness the model returns for a small change in the sample's level, against the sample's level measured as a log ratio to the background's — so that all three backgrounds share one axis and a peak at the background is a peak at zero. The pale curves are CIECAM16 as it stands, which has no peak anywhere: they rise slowly and monotonically because a background that enters as four constants fixed before the sample arrives cannot know where the sample sits relative to it. The solid curves are the same model with a term of amplitude 6 and width 0.5 added to lightness. Each peaks at zero to within 0.000 of a log unit, and the peak's height is 12.00 lightness units per log unit of level — the amplitude divided by the width, exactly.

    The cancellation is exact and cheap to lose

    CIECAM16 has no crispening, and adding one was expected to be expensive: the background's exactness in a corresponding colour comes from its being a common exponent, and a function of the sample's own level is not one. It is expensive in kind and not in size. A term that raises a straddling pair's lightness difference by half moves a corresponding colour by five thousandths of a tristimulus unit — a thousandth of what stating the background differently at the two ends already costs.

    part 22 · brain
  47. The pairs that change places in chroma are a wedge with two straight edges. Every pair of samples, plotted by the log ratio of the two samples' background-free responses across and the log ratio of their chroma at a background of 2 up. A pair changes places between that background and one of 80 exactly when its chroma ratio and its response ratio point in opposite directions and the chroma ratio is the smaller — which is the wedge between the horizontal axis and a line of slope -0.2598, half the change in the lightness exponent. 754 of 14028 pairs are inside it, and the condition names every one of them and nothing else: 0 disagreements between the line and the model. The pale dots are one pair in eleven of those outside; the filled ones are every pair inside.

    The reversals have a straight edge

    Twenty-one of 276 pairs change places in chroma between a dark background and a light one, and the reason given was that chroma is a product of a term carrying the exponent and a term that does not. That is true and it is not a description of which pairs. Chroma at one background is a single common factor times a power of lightness at another, so a pair reverses exactly when its chroma ratio and its lightness ratio point opposite ways and the first is the smaller — a wedge with two straight edges, which names every reversal and nothing else.

    part 22 · brain
  48. One lightness scale, drawn as a contour across the rooms. Three surrounds up the page and the background's luminance factor across it, on a square-root scale so that the model's own exponent base is linear in the axis. Each curve joins the rooms whose lightness exponent is the same, and every room on one curve returns the same lightness for every sample. The marked curve is the one through a television in a lit living room against a mid grey: it also passes through a print on a desk against a background of 2.8 and a projection in a dark room against 47.0. A curve that leaves the plot has no member in that surround, because each surround multiplies a base that runs only from 1.48 to 2.48.

    Two rooms with one lightness scale

    CIECAM16's surround and its background both reach lightness, and they reach it through one product. So the rooms fall into classes: a television in a lit living room against a mid grey returns exactly the lightness a print on a desk against a background of 2.8 does, for every sample, to the last bit of a double. It returns 0.76 of its chroma and 0.81 of its brightness. Two of the model's four viewing-condition parameters are one parameter, and only colour tells them apart.

    part 22 · brain
  49. How far each model turns a display colour's hue as white is added. The twenty-four most saturated colours an sRGB display makes, one every 15° of HSV hue across, each mixed with the display's white at the same luminance down to a fifth of its purity. Up, how far that mixture's hue angle turns in CIECAM16, CIELAB and Oklab. From red to a fifth of its purity CIECAM16 turns −9.4° and Oklab −10.2°; CIELAB −18.1°. From the display's blue, Oklab turns +16.3°, CIECAM16 +3.6° and CIELAB −8.9°.

    White turns a hue, and the models part at blue

    Mix a saturated light with white and its hue changes as well as its saturation — the Abney effect, and the reason lines of constant perceived hue curve in a chromaticity diagram. Asked what adding white does to the twenty-four most saturated colours a display makes, CIECAM16, CIELAB and Oklab all turn the hue. About reds they agree: CIECAM16 turns within a degree of Oklab, whose hue was fitted to observers' constant-hue judgements. About the display's blue they do not: Oklab turns sixteen degrees, CIECAM16 four, and CIELAB nine the other way.

    part 23 · brain
  50. Which way a tint turns a pigment's hue, made in paint and made in light. For eight pigments tinted nineteen parts white to one of colour, the Oklab hue turn from the pure pigment: of the tint made in paint (upper bar) and of the additive mixture with white at the same luminance (lower bar). For seven of the eight the two point in opposite directions. The orange turns +13.5° in paint and −13.9° in light.

    A tint in paint turns the other way

    A pale colour can be made two ways: by stirring white pigment into a coloured one, or by adding white light to it — which is what a halftone on white paper and a display both do. At the same luminance the two tints are not the same colour. For seven of eight pigments they turn the hue in opposite directions, an orange by +13.5 degrees in paint and −13.9 in light, and the paint tint is the more colourful of the two every time. The cause is in the reflectance: diluting a pigment moves its absorption edge, and adding light does not.

    part 23 · brain
  51. A halftone tint, between the two ideals and nearer one of them. For each pigment, how far the hue turns when it is tinted to the same lightness three ways: mixed with white pigment, mixed with white light, and printed as a halftone at a Yule–Nielsen factor of two. Right is towards a longer wavelength. 7 of the eight pigments' two ideals turn the hue opposite ways. The halftone mark sits between them at every pigment and between 26 and 44 per cent of the way from the light ideal to the paint one — so it keeps the additive tint's direction and loses about a third of its size.

    Printing does not change the sign

    A tint mixed in paint and a tint mixed in light turn seven of eight pigments' hues opposite ways. A halftone sits between the two because light entering the paper between dots emerges under a dot, and the question was where. At the optical gain a coated sheet is fitted at, a halftone has travelled between 26 and 44 per cent of the way from the light ideal to the paint one — the same fraction for every ink — and only one pigment in eight changes direction.

    part 24 · brain
  52. The share of its colour each display hue loses to a quarter of its luminance in white. The twenty-four most saturated colours of an sRGB display, one every fifteen degrees of HSV hue, each scaled to a luminance of 20 and given white of a quarter that luminance: the share of its colourfulness lost, in CIECAM16, CIELAB and Oklab. All three put the fastest loss at an orange and the slowest at a blue. At the orange end they are close — CIECAM16 27 per cent, CIELAB 28 per cent, Oklab 21 per cent — and at the blue end CIECAM16's 1.7 per cent is a quarter of the others'.

    White drains the blue last in every model

    CIECAM16 says a dab of white costs a deep red wall four times the colour it costs a dark blue one, and the experiment proposed to test it asked whether observers lose colour in that hue order. Held at equal luminance and given equal doses of white, twenty-four display hues are ordered alike by CIECAM16, CIELAB and Oklab — an orange loses fastest and a blue slowest in all three. So the order cannot tell the models apart. What does is how much slower the blue is: CIECAM16 has it losing a sixteenth of what the orange loses, CIELAB and Oklab about a quarter. That ratio is the number an observer study has to measure.

    part 24 · brain
  53. An orange ink's tints on three papers: which way the hue turns. The hue of each tint of an orange ink, from the solid to a tenth coverage, against the solid on the same paper, in degrees of Oklab hue: on a coated sheet, an unbrightened uncoated sheet and a newsprint. Solid lines are read against daylight's white, as an instrument reads them; dashed lines against the paper's own white, as a reader adapted to the page. At a tenth coverage, read against daylight, the coated sheet's tint has turned -8.7 degrees and the newsprint's 21.8; read against each paper's white, -8.7 and -1.1.

    Newsprint turns a tint with its colour, not its gain

    A halftone tint turns its hue the way a mixture of light does, by less, because optical dot gain carries it part of the way towards a paint tint. The straight line through a coated sheet's gain predicted that an uncoated sheet's larger gain would carry the orange past the crossing at a factor of 3.2, so that the same ink would turn opposite ways on two papers. It does turn opposite ways — on newsprint the orange's pale tints swing 13 degrees one way where a coated sheet's swing 8 the other. But the gain is not what does it. The road towards paint bends and stops at 60 to 70 per cent of the way, the orange needs a factor of 5.4 to cross, and newsprint's reversal comes almost entirely from the paper being yellow. Read against the paper's own white, as a reader looking at the page is adapted, it goes away.

    part 25 · brain

All series