The gamut race chose the basis
Assumes Primaries chosen for their inverse, What a gamut costs and A gamut has a population.
Rec. 2020’s primaries are a better basis for a von Kries gain than Bradford’s, than CAT02’s and than CAT16’s. Nobody chose that, nobody has measured it before, and the argument that produced it was about something else entirely.

The claim
Scored as adaptation bases, the three published display primary sets are 2.36, 1.22 and 1.09 ΔE00 in the order sRGB, Display P3, Rec. 2020 — monotone with gamut coverage, and the last of them better than every transform fitted to corresponding-colour data. Meanwhile, on the invariant measure of what those displays can show, all three cover 100 per cent of this collection’s constructed surfaces.
- sRGB is as bad as having no cone basis at all, at 2.36 against XYZ scaling’s 2.37.
- Rec. 2020 beats Bradford’s 1.14, which is what colour management actually applies.
- The ordering runs with the gamut, and the mechanism is direct: wider means spectrally narrower means sharper.
- And the count says nothing happened. Every constructed surface in this collection is inside sRGB under D65, so twenty years of widening bought no surfaces at all.
- Two conclusions, one set of hardware, and neither committee was measuring the quantity that moved.
Why the ordering is not a coincidence
A display’s adaptation basis is the inverse of its primary matrix, and the rows of that inverse are what a per-channel gain acts on. What decides whether a gain works is how spectrally selective those rows are — narrow, well-separated channels turn a change of light into three independent scalings, and broad overlapping ones do not.
A primary’s chromaticity and its spectral width are tied together by the geometry of the locus. A chromaticity far from the white and close to the locus can only be produced by a spectrum concentrated in a narrow band; a chromaticity near the middle can be produced by almost anything. So pushing the primaries outward to cover more of the diagram is pushing them towards being narrowband emitters, and the inverse of a narrowband primary matrix is a sharpened basis.
Sharpening is exactly what the adaptation literature spent the 1990s doing on purpose. Bradford’s entries are a sharpened set; CAT02’s are more so. The gamut race has been doing the same thing to displays for a different reason and without measuring it.

What the race was actually measuring
The stated quantity in every generation of this argument is coverage: what fraction of the CIE xy diagram, or of some reference gamut, the triangle contains. sRGB covers 33.5 per cent of the diagram, Display P3 45.4 and Rec. 2020 63.3.
This collection has an essay on why that number is a property of the paper. The same triangle covers between 8.5 and 38.4 per cent of the visible diagram across twelve published coordinate systems, a factor of 4.5, so a coverage figure is a statement about a chosen projective picture rather than about vision.
The invariant replacement is a count of stimuli, and the count is where the race looks different.


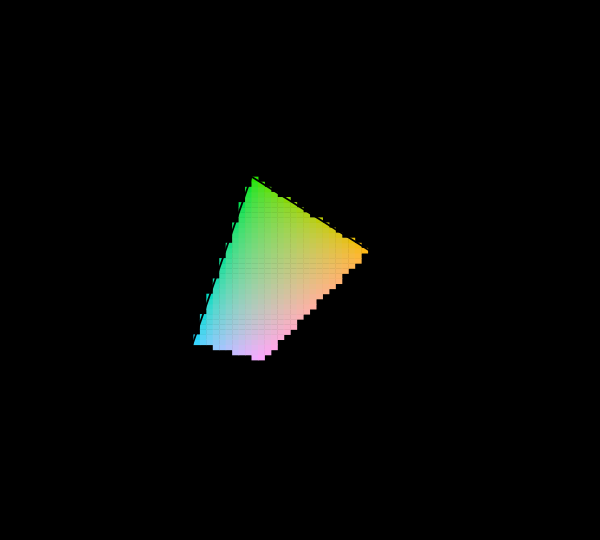
What the same design looks like when the coverage requirement is relaxed is the last thing worth drawing, because it is the counterfactual the standards process never ran.

Every one of this collection’s constructed surfaces is inside sRGB. They are smooth reflectances spanning three dimensions, which is a model of ordinary matte objects, and ordinary matte objects are not very saturated — the object colour solid is far smaller than the locus and most of what a display cannot show is a light rather than a thing.
So on the invariant measure, for this population, sRGB was already sufficient and P3 and Rec. 2020 added nothing. The area figure went from 33.5 to 63.3 per cent and the count stayed at 100.
Two readings, and both are fair
The first reading is deflationary and it is the one this collection has been building towards: the quantity the industry optimised is diagram-dependent, and on the invariant version of the same question the optimisation delivered nothing.
The second is the opposite and is new: the optimisation delivered something real on a quantity nobody named. A white point change on an sRGB panel leaves 2.36 ΔE00 and on a Rec. 2020 panel leaves 1.09. That is a factor of 2.2 in a quantity that affects every display in a colour-managed workflow, every night-time white shift, and every attempt to set a screen to D50 for comparison against a sheet of paper.
Both readings are about the same three products. The disagreement between them is entirely about which question is being asked, and the point of putting them side by side is that neither committee asked either one.
The population is doing the work
The count of 100 per cent is a statement about a population, and changing the population changes it completely.
This collection’s constructed surfaces are smooth and moderately saturated by design, because a three-dimensional family is what makes a change of light exactly a matrix. Real populations are broader in places: printing inks at full strength, fluorescent materials, interference pigments, and every self-luminous thing in a photograph — a neon sign, a laser, a sodium lamp — sit outside sRGB and some sit outside Rec. 2020.
So the honest form of the deflationary reading is narrower than it first appears: for matte surfaces under a daylight, the gamut race delivered nothing measurable. For saturated inks and for light sources in photographs it delivered a great deal, and a gamut has a population is the essay that says so properly.
What survives without qualification is that the area figure is not the measurement, and that the count is a different number with a different answer.
What sharpening looks like from the display’s side
The claim that a wider triangle means a sharper basis can be checked rather than argued, because the basis is available and its rows can be read.
The inverse of a primary matrix has rows that are, up to scale, the dual of the primaries: each row is orthogonal to the other two primaries’ directions in tristimulus space. So a red row is a function that is zero wherever green and blue are, and how narrow it is depends on how far apart the three primaries are.
For sRGB the three primaries sit well inside the locus, so the dual rows are broad and heavily overlapping, and the basis behaves like XYZ. For Rec. 2020 the primaries are on the locus and as far apart as three real colours can be, so the dual rows are narrow, and the basis behaves like a fitted adaptation transform.
The numbers bear it out at both ends. sRGB’s basis leaves 2.364 and XYZ scaling leaves 2.373 — a difference of nine thousandths, so sRGB’s inverse is XYZ scaling for practical purposes. Rec. 2020’s leaves 1.092 against Bradford’s 1.140 and CAT16’s 1.312.
Why the count is 100 and not 99
A count of exactly one hundred per cent invites suspicion, so it is worth saying precisely what is being counted.
The population is this collection’s constructed reflectance family: smooth spectra built from a three-dimensional basis, with values in [0, 1], covering the range of matte surface colours that a linear model of reflectance can represent. Every one of them, integrated against D65 and converted to sRGB, has all three channels between zero and one.
That is not a claim that all real surfaces are inside sRGB. It is a claim about a family constructed to be smooth and three-dimensional — which is a strong assumption about surfaces and one this collection makes deliberately, because it is what makes a change of light exactly a matrix.
The families that break it are exactly the ones that break the linear model too: fluorescent papers, which add light rather than multiplying it, interference pigments, whose spectra move with angle, and printing inks at full strength, whose reflectances are sharper than three smooth basis functions can build.
So the 100 per cent is honest and narrow. It says that for the class of surfaces this collection’s adaptation arithmetic is valid on, the gamut race delivered nothing — which is the same class the arithmetic in the other column is computed over, and that is what makes the two columns comparable.
What eighteen years bought, itemised
Setting the three specifications side by side with dates makes the shape of the accident clear.
sRGB, 1996. Primaries taken from what a typical cathode-ray tube of the period did, standardised so that images would look approximately alike on approximately similar hardware. Coverage 33.5 per cent. Adaptation basis 2.36 — indistinguishable from having no basis.
Display P3, 2015. The cinema industry’s DCI-P3 primaries with a D65 white, adopted because laser and wide-gamut LED backlights could reach them and because a phone screen could be a selling point. Coverage 45.4 per cent. Adaptation basis 1.22 — better than CAT16.
Rec. 2020, 2012. Monochromatic primaries specified as a target for ultra-high-definition television, deliberately beyond what any panel could then do. Coverage 63.3 per cent. Adaptation basis 1.09 — better than Bradford.
Each step was argued for on coverage and on nothing else, and each closed most of the remaining distance to the best adaptation basis available: sRGB is 1.39 units above the floor of 0.97, P3 is 0.24 and Rec. 2020 is 0.12. The first move took 82 per cent of what was available and the second took half of the rest.
And by the invariant count of matte surfaces, none of the three steps moved anything, because the first one was already sufficient.
The dates are worth a second look as well. Rec. 2020 was published three years before Display P3 was adopted, which is the usual pattern for a target standard: the aspirational specification arrives first and the shipping one arrives later and lands short of it. So the ordering by coverage, by date of shipping hardware and by adaptation quality are three different orderings that happen to agree on which is best, and only one of them was ever discussed.
Asking for seventy per cent of the diagram is past what any published set reaches, and it is where the best available basis has to be searched for rather than quoted.

Where the ordering stops
Three points in the right order invite an extrapolation, and the extrapolation turns out to be wrong.
Optimising a display’s three primary chromaticities for adaptation alone, with no floor at all on how much of the diagram they cover, gives 0.9961 ΔE00 — within 2.3 per cent of the unconstrained nine-number floor of 0.9741. Three physical chromaticities can very nearly reach the best adaptation basis there is. Rec. 2020’s 1.0923 is 9.7 per cent above that display floor, so the race has already covered nine tenths of the available ground.
And the optimum is not the widest set. Its coverage on this collection’s own measure is 0.5379, against sRGB’s 0.3350, P3’s 0.4544 and Rec. 2020’s 0.6334. The best-adapting primaries sit between P3 and Rec. 2020 in coverage and adapt better than either — and their green is at (0.203, 0.743), inside the locus rather than on it.
So the monotone ordering across the three published sets is real, and it is not a trend to extend. Pushing further out than Rec. 2020 makes the gamut larger and the adaptation basis worse. The two quantities agree over the range the standards happen to occupy and part company past it.
That sharpens what the coincidence was. Twenty years of widening improved the adaptation basis because widening in that range meant sharpening. It would stop improving it at about fifty-four per cent coverage — a boundary nobody was aiming at, which the newest standard has already passed, and which nothing in either literature would have flagged on the way through.
What was computed, and how
The adaptation column is the same residual as everywhere else here, applied to each display’s own inverse primary matrix as the basis: the exact 3×3 relating tristimulus values under each pair of contexts, the diagonal an adapted observer applies, and the mean CIEDE2000 remaining over a hundred and twenty-five surfaces and fourteen changes.
The coverage column is the shoelace area of the primary triangle divided by the area of the convex hull of the spectral locus, sampled at one nanometre. The hull rather than a sampled polygon, because the corners matter and a polygon through samples cuts them off.
The count column tests each constructed reflectance’s tristimulus values under D65 against the display’s own three inequalities. That test is what makes the count invariant: being inside a gamut is a fact about tristimulus values and survives any change of basis, whereas an area does not.
The monotonicity of the adaptation column with coverage is asserted rather than observed, so a fourth primary set added to the table that broke the pattern would stop the build.
The trade itself is nearly flat, and starting the sweep lower shows how little of it is a wall.

The other objective, which also improves
The pattern would be tidier if widening the gamut bought adaptation at the expense of something. It does not, on the second objective measured here.
A display’s basis is also a space, in the sense that a nonlinearity applied in it produces a lightness–chroma geometry, and how nearly that geometry makes discrimination contours circular can be measured the same way as for any other basis. sRGB’s basis leaves a mean ellipse axis ratio of 9.84 — the worst number anywhere in these essays, worse than every cone basis and every adaptation transform. Display P3 leaves 9.38 and Rec. 2020 leaves 5.80.
So the gamut race improved that too, by a factor of 1.7, and it is still terrible: 5.80 against a floor of 1.62 and against CIELAB’s own 3.39. A display’s primaries are a bad space to measure a difference in and a wide display’s primaries are a less bad one.
That last point has a practical edge. Computing a colour difference in a display’s RGB space — which happens whenever software subtracts two hex codes and calls the result a difference — is measuring in a geometry whose worst direction is ten times its best. A hex code is not a colour and a difference between two of them is not a difference.
Where the model stops
Three points is not a trend. Three primary sets, standardised eighteen years apart, ordered the same way on two quantities. The mechanism given above says the ordering is not an accident, and three points cannot distinguish a mechanism from a coincidence on their own — the argument rests on the mechanism, and the designed primaries of the neighbouring essay are the test of it.
Rec. 2020 is not a panel. Its primaries are monochromatic by specification and no display achieves them; real wide-gamut panels sit between P3 and Rec. 2020, and their adaptation numbers sit between too.
And a white point change is not the only thing a display does. Nothing here measures rendering accuracy, banding, viewing angle or what the room in front of the screen does to all of it, and a primary set is chosen against all of those and more.
What would have surfaced it earlier
One line of algebra and one habit.
The algebra is that a white point control is a per-channel gain, so a display’s adaptation basis is the inverse of its primary matrix. That is true of every panel ever made and is stated in no display specification.
The habit is scoring a parameter on the models it appears in rather than on the model it was chosen for. A display’s primaries are a parameter in at least five places: the gamut calculation they were chosen for, the adaptation model its own white point control implements, the space differences get computed in when software is careless, the noise budget of the matrix that converts to and from them, and the gamut mapping algorithm that runs when an image does not fit. Four of the five have never been reported for any display standard.
The generalisation
When a specification is optimised hard against one measurable quantity, everything correlated with that quantity moves too, and some of what moves is not measured by anybody.
That is a general property of standards-driven engineering and it cuts both ways. Here the correlated quantity improved, by a factor of two, silently. It could as easily have degraded — and the case where it degrades is much harder to notice, because there is no number going up to make anybody look.
The check is the one performed here and it is cheap: take the quantity a specification actually fixes, find the other models it appears in as a parameter, and score it there. A display’s primaries appear in an adaptation model, in a difference metric, in a noise budget and in a gamut mapping algorithm. Coverage is one of five uses and is the only one that got a number on a box.
Where the ladder goes next
The same design question can be asked of a sensor rather than a display, and it has a different answer because a camera’s basis is not fixed by its dyes alone.
Where this goes next
 Primaries chosen for their inverse
Moving a display's white point is a gain on its R, G and B, so a display adapts in the inverse of its own primary matrix — a basis chosen by committees for gamut coverage and phosphor availability. Pose the design problem properly and the answer costs one per cent of the gamut argument and reaches within two per cent of the best basis there is.
Primaries chosen for their inverse
Moving a display's white point is a gain on its R, G and B, so a display adapts in the inverse of its own primary matrix — a basis chosen by committees for gamut coverage and phosphor availability. Pose the design problem properly and the answer costs one per cent of the gamut argument and reaches within two per cent of the best basis there is.
 A gamut has a population
Whether a display can reproduce a paint is a fact about somebody's cones, so the boundary of a gamut is not a curve but a band. On a laser projector, ten of twenty-eight boundary surfaces are ones the standard observer calls displayable and some real people cannot see — and the wider the gamut, the wider the band.
A gamut has a population
Whether a display can reproduce a paint is a fact about somebody's cones, so the boundary of a gamut is not a curve but a band. On a laser projector, ten of twenty-eight boundary surfaces are ones the standard observer calls displayable and some real people cannot see — and the wider the gamut, the wider the band.
 What a gamut costs
Three primaries reach a triangle and the visible region is not a triangle, so something has to give. Widening the primaries helps, has a price in precision and compatibility, and runs into a limit that is geometric rather than technological.
What a gamut costs
Three primaries reach a triangle and the visible region is not a triangle, so something has to give. Widening the primaries helps, has a price in precision and compatibility, and runs into a limit that is geometric rather than technological.
What this makes readable
Essays that name this one as a prerequisite.
Named alongside this one
Essays reaching for the same objects. Nobody chose these; they are what the index of named objects makes visible.
- The identity is in the eye's own coordinates basis · chromatic adaptation · invariance · sharpening · the von kries transform
- A fourth primary is a design display gamut · gamut · primaries · specification
- A gain is not an observer basis · chromatic adaptation · invariance · the von kries transform
- A screen is a poor lamp display gamut · gamut · primaries · specification
- A third of the appearance box is no surface display gamut · gamut · object-colour solid · specification
- Neither gamut contains the other display gamut · gamut · object-colour solid · specification
What links here
Every essay whose body links to this one.
The objects this essay names
Each one links to every other essay that touches it.
BasisChromatic adaptationDisplay gamutGamutInvarianceObject-colour solidPrimariesSharpeningSpecificationThe von Kries transform