One person is two observers
Assumes Two degrees or ten and Whose eyes.
The CIE has two standard observers and the usual account of the difference is a rule of thumb: use the 1931 functions for small samples and the 1964 ones for large. Nothing in that account says why the size of a patch should change the arithmetic at all, and the answer is not about the patch.
It is about a filter, and about where on the retina the light landed. The macular pigment is a yellow screen a few degrees across, lying in front of the receptors at the centre of gaze and thinning to nothing by about eight degrees out. A cone under it and a cone beyond it are catching different amounts of blue light from the same spectrum, so they have different spectral sensitivities — and they are in the same eye, belonging to the same person, at the same moment.
The claim
Colour-matching functions are not a property of a person. They are a property of a person and a place on their retina, and the two standard observers are two places.
- A match made at the centre of gaze fails ten degrees away, in the same eye, by ΔE00 5.9. The pair is exact where it was made — a residual of 2 × 10⁻¹⁴, which is floating-point zero and not an approximation.
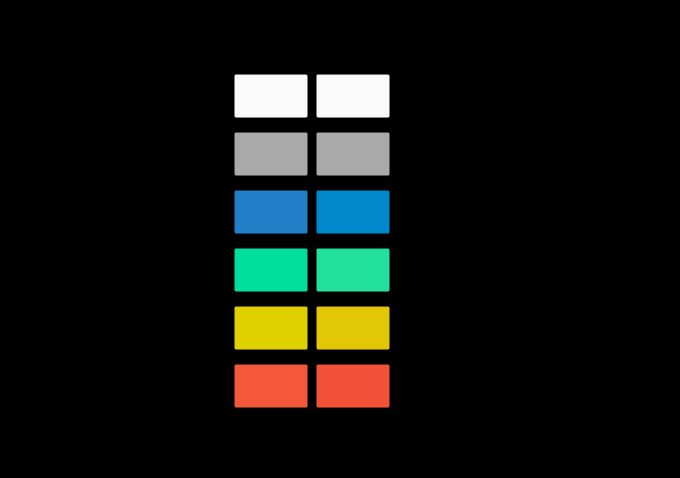
- A saturated blue field is ΔE00 5.2 different in the middle of it; a green one is 0.7. That is the Maxwell spot, and the model says which fields show it.
- The light the eye is adapted to is unchanged, exactly. A filter in front of the receptors is a diagonal gain in the cone basis, and so is chromatic adaptation — so an adapted eye cancels its own macula to a part in ten thousand billion. This is why a person can carry one for a lifetime and never notice.
- And fitting a single filter to the gap between the two standard observers gives a macular density of 0.40, against a measured population median of 0.35 that this site has been using since its foundation for an entirely different reason.
Where the screen is

The peak density is quoted between 0.2 and 0.6 with the population’s median near 0.35, and the observer model here has been carrying that number as one of five measured variates since it was built. The decline with eccentricity is usually fitted as an exponential; the scale used here is 2.4 degrees, which puts the density at 0.005 by ten degrees, a sixty-fifth of its peak.
The width is the softest number in the file — individual profiles differ in width about as much as they differ in peak — so every conclusion below is re-run across a factor of three in it, and what does not survive is not reported.
Only the macula moves. Lens density, cone optical density and the three pigment peaks are properties of an eye rather than of a place in it, so holding them fixed is what makes every difference here a difference of position rather than a second variate smuggled in.
The zero everything is measured from
The first row of the table is the interesting one, and it is exactly zero.
An eye looking at a large uniform field adapts to it. What it adapts with is a diagonal gain in the cone basis, chosen so that the field reports as neutral. The macular pigment is also a diagonal gain in the cone basis — a fixed transmittance multiplying each cone’s catch. Two diagonal gains in the same basis compose into a third, and the adaptation absorbs the filter completely.
So on the adapting white there is nothing to see, and the calculation returns 8 × 10⁻¹⁴. That is the same structural fact that makes a steady pigment bleach invisible: a large effect that cancels exactly at steady state, and is therefore absent from every measurement made at steady state.
What does not cancel is everything else. A gain chosen to neutralise the white is the wrong gain for any other spectrum, and how wrong depends on how much of that spectrum sits in the band the filter absorbs.

The spot Maxwell saw
Look steadily at a large field of saturated blue and a faint darker blot appears in the middle of it, a few degrees across, fading after a second or two and returning if the field is changed. It is called the Maxwell spot, it was reported in 1856, and it is the macula seen against itself.
The model gives it a size: ΔE00 5.2 between the centre of gaze and ten degrees out on a saturated blue field, five times an industrial tolerance and comfortably visible. On a saturated green it is 0.7 and on a red 1.5. Those are the undiluted fields, most of which this page cannot show — the patches in the first figure are the same fields with enough of the adapting light added to bring them inside the gamut, which costs the blue about a third of its saturation and about a third of its difference.
It fades because of the cancellation above. The eye adapts to what it is looking at, and once adapted it applies a gain that removes the filter’s effect on that spectrum. Change the field and the gain is wrong again, which is why the demonstration works with an alternating field and not with a steady one.

Why nobody notices
Over a set of natural reflectances the difference between the two positions averages ΔE00 0.61, with the worst at 1.27 and five of twenty-four above a unit. That is small enough to be invisible without a comparison and it is not zero.
The reason is what natural surfaces are made of. Leaves, skin, soil, stone and most pigments are broad and pale: their reflectance changes slowly with wavelength and their saturation is low, so the fraction of their light sitting in a forty-nanometre band around 460 nm is small. Saturated blue is the case where a large share of the returned light is exactly where the filter acts, and there is very little saturated blue in the world that is not manufactured.
So the effect is largest on precisely the class of stimulus that a laboratory produces and daily life does not — which is the general shape of every observer-metamerism result on this site. Narrow primaries cost more for the same reason and in the same direction.
A match that does not travel
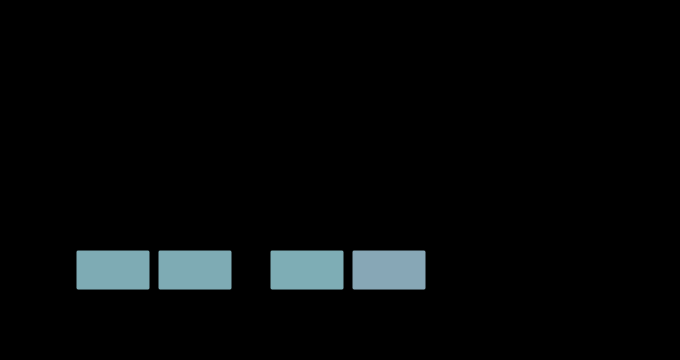
The pair is constructed for this model’s foveal observer rather than for a standard one, which is the only construction that makes the claim clean: a match that was never exact would come apart off axis for a reason having nothing to do with where it was looking. The residual at the centre is 2 × 10⁻¹⁴.
The construction is the site’s usual one. The three rows a reflectance is projected against — what each cone catches under the illuminant — define a subspace, and anything orthogonal to all three is a metameric black: a spectral difference the observer cannot see. Adding one to a reflectance produces a partner that is an exact match by construction rather than by fitting. The only new part is that the three rows are built from a cone set the CIE never tabulated, because this observer is a position rather than a standard.
Off axis the rows are different rows, the subspace is a different subspace, and what was orthogonal to the first is not orthogonal to the second. The result is ΔE00 5.9 — larger than the disagreement between two people picked at random, and inside one person.
The candidate blacks are searched rather than chosen, over a family of smooth functions at several frequencies and phases, and the worst-breaking one is reported. That is the same discipline the illuminant-metamerism figures use: every candidate is already an exact match, so choosing among them is choosing a demonstration rather than tuning a result.
The check that makes it more than a story
Everything above would be a plausible account of why two standard observers exist. The test is whether the account predicts the size of the difference between them, and it can be asked as one question: taking the ratio of the two tabulated luminous efficiency functions, and fitting the macular absorption shape to it, what optical density comes out?

0.40, against 0.35. The two numbers come from completely different places. One is a fit to the difference between two psychophysical experiments thirty years apart, on different subjects, with different primaries, different fields and different apparatus. The other is the median of a distribution of macular pigment densities measured by reflectometry and heterochromatic flicker photometry on people who never took part in either.
The fit accounts for R² 0.67 of the difference across the band the macula absorbs in, and it is asserted from both sides. It has to be more than half, or the account is not the account. And it has to be less than all of it, because two experiments differ in more than one filter — the residual below 440 nanometres is where the fit is worst, and it is where lens density and the different subject pools would be expected to show.
assertTheStandardPairIsMostlyThisFilter holds both bounds. Loosening either one would let the file claim a tidier result than it has.
Six degrees is nearly ten
The second sweep is introduced with a figure that its own profile does not support. Two thirds of the macular density is already gone by six — on an exponential of scale 2.4 degrees, 92 per cent is gone by six, and two thirds is gone by 2.6 degrees.
The ten-degree figure confirms the profile rather than the sentence: 0.35 × exp(−10/2.4) is 0.0054, which is the quoted 0.005 and the quoted sixty-fifth of the peak, exactly. So the exponential and its scale are right and the six-degree reading is the outlier.
The correction runs the other way from the framing, and it is the more interesting direction. What matters for the difference between two positions is not how much density is left at the far one but how much has been given up between them, and at six degrees that is 0.321 against ten degrees’ 0.345 — 93 per cent of it.
So the six-degree sweep should be very nearly the ten-degree one: the blue field’s 5.2 units becomes about 4.8, a reduction of seven per cent rather than of anything a reader would call substantial. That is the useful practical statement and it is stronger than the essay’s: the effect is essentially complete by six degrees, so an observer does not have to look far off axis to see all of it, and a field of a dozen degrees is not meaningfully different from one of twenty.
The profile’s own scale is a fitted number, and halving it is the sensitivity test that says how much of the result depends on it.

The fitted density is not the density the profile predicts
The essay’s central check compares two numbers from unrelated sources — a fitted 0.40 against a measured population median of 0.35 — and calls the agreement the thing that makes the account more than a story. The essay’s own eccentricity profile says the fit should be compared with something else.
The two standard observers are two field sizes, and the filter each one looks through is the macular density averaged over its own field. Taking the profile over a disc:
| observer | field | mean density over it |
|---|---|---|
| 1931 | 2°, so a disc of radius 1° | 0.266 |
| 1964 | 10°, so a disc of radius 5° | 0.099 |
The difference the profile predicts is 0.167. The fit to the two observers’ luminous efficiency functions gives 0.40, which is 2.4 times larger — and, more awkwardly, larger than the peak density the model contains. No arrangement of a filter whose maximum is 0.35 can produce a difference of 0.40 between two fields, however the fields are placed.
So the 0.40-against-0.35 comparison is between the fitted difference and the profile’s peak, and the quantity the profile actually predicts for that difference is 0.167. The two numbers agree because one of them is the wrong one to compare against, and the essay’s own model is the thing that says so.
None of that touches the qualitative account, which the R² of 0.67 supports on its own terms: the macula’s absorption shape explains two thirds of the variance in the ratio between the two observers, and nothing else on offer explains any of it. What it does touch is the claim that the size is predicted. It is not — the account is out by a factor of two and a half in exactly the direction that would matter.
Two resolutions are available and both are checkable. A real observer fixates, so a two-degree field is not a disc average but a reading weighted towards the centre, which pushes the 1931 figure up towards the peak. And the Stiles–Burch protocol behind the 1964 functions did not use a filled ten degrees throughout, which would push the 1964 figure down towards zero. Both together could carry the prediction from 0.167 to something near 0.35, and neither can carry it past it — so the fitted 0.40 needs a term the macula does not supply, which is where the residual below 440 nanometres that the essay already flags would come in.
That is a better place for the essay to end than the coincidence it currently ends on: the shape is the macula’s, two thirds of the variance is accounted for, and the amplitude is out by a factor the model cannot close.
Twice as far out is past the macula entirely, which is where the filter has stopped rather than merely thinned.

What was computed, and how
The observer at each position is built by the population machinery, which takes five measured variates and returns a set of cone absorptances: a pigment template at a stated peak wavelength, self-screened at a stated optical density, seen through a lens of a stated age and a macula of a stated density. Only the last is a function of eccentricity here.
Every reading is carried into CIELAB through the same route the population essays use — the member’s own view of the white, adapted to D65 by CAT16 — so the numbers here are directly comparable with the disagreement between two people rather than being a second scale.
The fitted cone-to-tristimulus matrix is held fixed across positions. That is deliberate and it is the conservative choice: allowing it to be re-fitted at each position would absorb part of the difference into bookkeeping, and the question is what the eye caught, not how it was written down.
Six degrees is inside the macula rather than beyond it, and it is the eccentricity most ordinary looking actually happens at.
Where it stops
The macula is not the only thing that changes across the retina, and this model has none of the others.
Cone density falls by more than an order of magnitude from the fovea outward and the S-cone share changes with it; the very centre of gaze is effectively tritanopic and the mosaic is not the observer because there are no S cones in the innermost twenty minutes of arc. Rod intrusion begins within a few degrees and the whole mesopic apparatus arrives with it. Receptive fields grow, thresholds rise, and acuity falls by the same magnification that governs everything else off axis.
None of that is here. What is here is one filter with one profile, and the claim is correspondingly narrow: the spectral sensitivity of a cone depends on where it is, by an amount that the difference between the two standard observers is mostly made of.
The model also treats the filter as uniform over the region it covers, which it is not — the density falls smoothly and a ten-degree field is an average over a gradient rather than a reading at ten degrees. A field is not a point, which is the same objection the component-versus-point audit raises against half the claims on this site, and it applies here in full.
Who found it, and when
Maxwell described the spot in 1856 while doing something else: he was mapping colour matches with a light box and noticed that a field of a particular blue was not uniform, and that the non-uniformity followed his gaze. He identified it as absorption in the eye rather than as a property of the light, which was the right conclusion and an unobvious one — an artefact that moves with the observer looks exactly like an artefact of the apparatus.
The pigment itself was identified as a carotenoid — lutein and zeaxanthin, concentrated in the inner layers of the fovea — much later, and its density in living eyes has been measured by two independent routes that do not agree perfectly: reflectometry, which reads light coming back out, and heterochromatic flicker photometry, which asks the observer. Both put the population median near a third and both report individuals from nearly zero to above one.
The two standard observers arrived seventy years apart and were fitted from different data. The 1931 functions rest on the matching experiments of Wright and Guild, seventeen observers in total, on a two-degree bipartite field. The 1964 ones rest on Stiles and Burch’s much larger study, on a ten-degree field, with an explicit note that the larger field was chosen because industrial samples are larger than two degrees. That note is the whole of the usual explanation, and it describes the reason for the experiment rather than the mechanism that makes its answer different.
Where the ladder goes next
A standard observer is a mean over seventeen people who were asked to match on a two-degree field. The obvious next argument is what that mean would look like if the field size were a parameter rather than two boxes — a family of observers indexed continuously by field size, each one the average of the macular profile over the region concerned.
The more useful one is downstream and applied. Surface-colour laboratories are required to use the ten-degree observer and displays are specified with the two-degree one, so any comparison between a printed sample and a screen is made with two different sets of colour-matching functions. The gap between them, on this account, is a filter that one of the two observers is looking through and the other is not — which means the size of the disagreement depends on how much blue is in the sample.
Where this goes next
 Two degrees or ten
This site names the observer on every figure it draws, which was supposed to be the point. Measuring what it had actually done found two hundred and four figures naming the same observer, three naming the other, and sixty-two of sixty-four generators printing a string that had never once varied.
Whose eyes
The standard observer is an average over seventeen people, and no reader is it. What that costs was small when displays were broad and grows every time the primaries get narrower.
Two degrees or ten
This site names the observer on every figure it draws, which was supposed to be the point. Measuring what it had actually done found two hundred and four figures naming the same observer, three naming the other, and sixty-two of sixty-four generators printing a string that had never once varied.
Whose eyes
The standard observer is an average over seventeen people, and no reader is it. What that costs was small when displays were broad and grows every time the primaries get narrower.
 One match names the observer
A yellow at 589 nanometres set against a mixture of 545 and 670 is two equations in two unknowns. It has one solution for a normal observer, a solution somewhere else for an anomalous one, and no unique solution at all for a dichromat — whose two equations are one equation twice.
One match names the observer
A yellow at 589 nanometres set against a mixture of 545 and 670 is two equations in two unknowns. It has one solution for a normal observer, a solution somewhere else for an anomalous one, and no unique solution at all for a dichromat — whose two equations are one equation twice.
What this makes readable
Essays that name this one as a prerequisite.
Named alongside this one
Essays reaching for the same objects. Nobody chose these; they are what the index of named objects makes visible.
- Nobody here has two eyes chromatic adaptation · colour-matching functions · cone fundamentals · individual variation · observer metamerism · spectral sensitivity · standard observer
- The laws that make colour add up colour-matching functions · cone fundamentals · individual variation · metamerism · spectral sensitivity · standard observer
- A neutral is everyone's colour chromatic adaptation · individual variation · metamerism · observer metamerism · standard observer
- A tolerance is a probability individual variation · measurement error · metamerism · observer metamerism · standard observer
- Seventeen observers in 1931 colour-matching functions · cone fundamentals · macular pigment · observer metamerism · standard observer
- The macular is a band, not a filter eccentricity · individual variation · macular pigment · observer metamerism · standard observer
What links here
The 8 essays that link to this one and share the most of its objects, of 14 that link here.
The objects this essay names
Each one links to every other essay that touches it.
Chromatic adaptationColour-matching functionsCone fundamentalsEccentricityIndividual variationMacular pigmentMeasurement errorMetamerismObserver metamerismSpectral sensitivityStandard observerThe von Kries transform