Field

What the eye does

Three cone types project an infinite-dimensional spectrum onto three numbers. Everything colour science can and cannot do follows from that one collapse.

52 essays. Read in order: Cones.

A spectrum, weighted three ways, and the three numbers left over. The illuminant D65 above; below, the same spectrum multiplied by each matching function. The area under each product is one coordinate of XYZ. Everything else about the spectrum — its shape, its structure, all its remaining degrees of freedom — is discarded here.

Three numbers

part 1
Two different spectra that are the same colour. Two reflectance curves differing by 92 per cent RMS, and the two patches they produce under D65: identical to ΔE00 = 6.2e-14, which is arithmetic noise rather than a small number. Both patches are inside the sRGB gamut, so neither has been clipped into agreement.

Two spectra, one colour

part 2
The CIE 1931 colour-matching functions. The three functions that turn a spectrum into three numbers. They are all positive, which is why XYZ exists — the RGB functions they were derived from are not. ȳ is by construction the luminous efficiency function, which is why luminance comes out of Y.

Why colour is exactly three-dimensional

part 2
The same two surfaces, weighed by each system. A long-wavelength and a short-wavelength surface under D65, with their relative luminance under the photopic curve and under the scotopic one. Under daylight vision the red surface is 1.33 times the blue; under rod vision it is 0.15 times, a reversal by a factor of 9.0. The swatches are the photopic appearance, which is the only one a display can produce: rod vision has no colour, and drawing a guess at it would be an invention.

The eye that has no colour

part 2
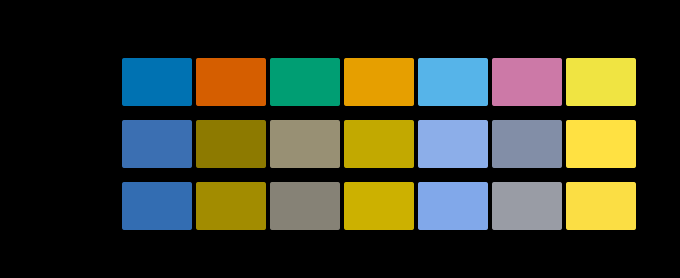
One palette under normal vision and two dichromacies. The same 7 colours simulated by the Brettel–Viénot–Mollon construction at severity 1.0. protanopia and deuteranopia collapse the red-green distinctions. This shows which discriminations survive, not what anybody sees.

Three cones, two axes

part 3
Longitudinal chromatic aberration of the eye, focused at 555 nm. Thibos's chromatic eye, plotted as defocus in dioptres relative to 555 nm. The curve crosses zero exactly once, at the wavelength the eye is accommodating on, and everything else is out of focus — by -1.22 D at 420 nm and 0.50 D at 680 nm. Through a 3 mm pupil that first figure is a blur circle of 12.6 minutes of arc, against a foveal acuity limit of about one. The eye is never in focus across the spectrum and never can be.

Nothing is in focus at both ends

part 4
Three retinas of different composition, making identical colour matches. Seeded mosaics at L:M ratios of 1, 4, 16 to one — the range found between people, and a 16-fold difference in what the retina is made of. A colour match is the claim that two spectra produce equal excitation in all three cone classes, and changing how many of a class there are multiplies that class's excitation by a constant, which cannot disturb an equality. The relation between the two test spectra is identical to twelve decimal places across the whole sweep. Luminance, which is a weighted sum rather than an equality, moves by 1.33× over the same range. That asymmetry is why a standard observer exists and why V(λ) has a much larger between-observer variance than the colour-matching functions do.

The mosaic is not the observer

part 5
Contrast sensitivity, three channels, normalised to each channel's peak. Spatial frequency in cycles per degree against relative sensitivity. The luminance channel runs to 50 cycles per degree, red–green to 12 and blue–yellow to 8, each by the same criterion of 5 per cent of that channel's own peak. Only the luminance channel dips at low frequency; the two chromatic ones are low-pass, so a chromatic edge of any size at all is seen at its full contrast.

How fine a colour edge can be

part 3
The L cone's sensitivity at three axial pigment densities. Each curve is normalised to its own peak, so the only difference visible is shape. Raising the density from 0.1 to 0.9 widens the curve from 113.6 to 145.9 nm at half height while the peak stays within 5 nm of where it was. That is Beer–Lambert saturating: at the peak the pigment already absorbs nearly everything, so more of it can only catch more light in the wings.

A cone absorbs its own light

part 4
Photons caught by one cone in one integration time, under D65. Each curve is one cone class, counting isomerisations during a 0.1 s integration through a pupil that closes as the light rises. At 1000 cd/m² a long-wavelength cone catches about 11522 and at 0.001 it catches 0.12 — which is where the square root of the count stops being a small correction and starts being the signal. The rate works out at 30 isomerisations per second per troland, inside the published band of 5–50.

Colour goes first in the dark

part 5
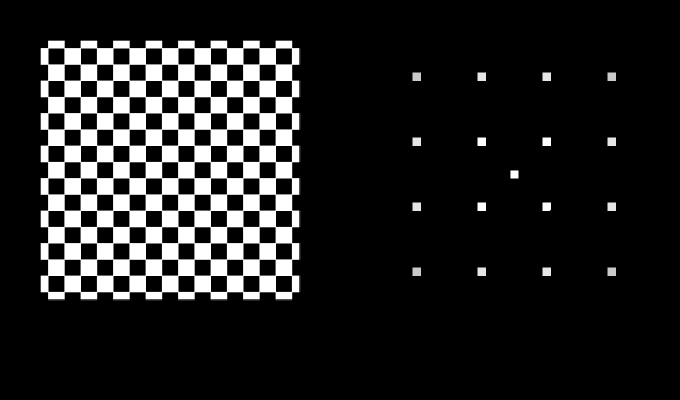
A screen at 45°, 8 c/°, and where its energy sits. Left, the pattern. Right, its power in the frequency plane with the zero frequency at the centre and the edges at the sampling limit of 23 cycles per degree, on a logarithmic scale over five decades. The closed curves are the visual system's own sensitivity at 5, 25, 60 per cent of its peak; they are not circles, because sensitivity is lower on the diagonals than on the cardinal axes by a factor of 2.0 at high frequency. Energy inside a curve is seen; energy outside it is not, whatever its size.

A pattern has a direction

part 4
Cone density, out from the centre of gaze. Quoted landmarks with logarithmic interpolation between them: 199,000 cones per square millimetre at the fovea, 9,500 at ten degrees — a factor of 21. The shaded bands are the two standard observers' fields. The 2° observer averages over a region whose density falls by 3.3× between its centre and its edge and the 10° observer by 12.4×, which is what "a 10° field" contains and is why the two sets of matching functions are different shapes rather than the same shape scaled.

Colour stops at the edge of sight

part 4
Temporal sensitivity, and where each channel gives out. Modulation frequency in hertz against relative sensitivity. The luminance channel is band-pass, peaking at 8 hertz and running out at 60; an isoluminant modulation is low-pass and runs out at 15, which is 4.0 times sooner. Both cutoffs are at the same criterion of 5 per cent of that channel's own peak, so the ratio between them is a ratio between two measurements rather than between two conventions.

The eye has a shutter

part 3
The drift window, asked about each channel in turn. Every spatial frequency a channel can resolve, drifting at v degrees a second, arrives at f × v hertz; the bar is the range of v over which all of them stay above a quarter of that channel's temporal peak. The luminance band is closed at both ends — 0.018 to 0.71 degrees a second — because its temporal sensitivity has a dip at zero to fall into. The chromatic bands have no slow edge at all, because chromatic temporal sensitivity is low-pass: a stationary chromatic pattern sits at the top of its own sensitivity. The mark is the measured drift, and it is inside all three.

The drift is a luminance mechanism

part 5
Coming back from a bleach, against the clock already measured. A 94 per cent bleach, and the pigment returning at its own time constant of 120 seconds. The lower curve is the site's slow neural adaptation constant, 60 seconds, started from the same place — it is finished while the chemistry is barely half done. Regeneration does not speed up because the light went away: the rate constant is the same one it always was, which is why the recovery is slow while the bleaching was fast.

The slowest clock is chemical

part 5
Where a pooled gain gives out, against where the eye does. The falling curve is how much of a pattern of each spatial frequency a local adaptation pool of 0.5° can see — and therefore how much of it a settled eye can cancel. It is half gone by 0.37 cycles per degree, which is a feature about 2.7° across. The three marks are the acuity limits of the luminance channel and the two chromatic ones. Every one of them is more than an order of magnitude finer than the pool, which is why a stabilised eye loses the fill of a picture and keeps its outline rather than losing the picture.

What a still eye stops seeing

part 6
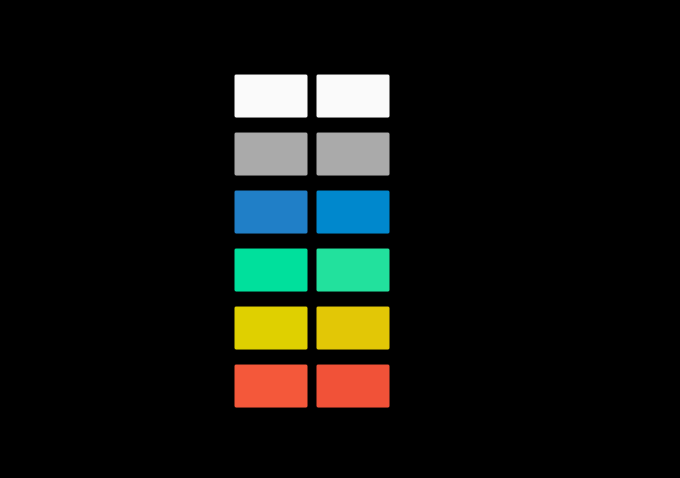
What the same eye reports about one field, in the middle and at the edge. Each row is a uniform field, drawn at the most saturated version of itself this page can show — the percentage is how much of the full stimulus survived, the rest being the adapting light added to bring it inside the gamut. The left patch is what the centre of gaze reports and the right one what 10 degrees out reports, each adapted to the same light as that position sees it. The adapting white comes out identical to 5e-13, because an adapted eye cancels its own filter exactly. Nothing else does, and the largest difference is in the blue. tungsten light is not drawn: it cannot be shown at any useful saturation, and at full strength it differs by ΔE00 1.87.

One person is two observers

part 6
The share of itself each change leaves behind, and the smallest is inside the eye. The residual as a fraction of the change rather than as a colour difference, which sorts the census differently. At the top is the macular pigment — the filter in front of the central few degrees of one's own retina — leaving 2.4 per cent of itself. It is a fixed transmittance multiplying the light and the white together, which is as close to a pure gain as anything here gets, and it is why nobody notices they have one.

The filters inside the eye

part 7
A stabilised grating fades at a rate that depends on which way its bars run. What is left of a 0.3 cycle-per-degree grating, in multiples of its own threshold, as a function of its orientation, at four moments after the image was stabilised on the retina. The first curve is flat to floating point: at the instant the pattern arrives, orientation does not matter, because the filter that carries it has no orientation preference at this frequency. The anisotropy arrives with the fading, reaching ×2.09 after five minutes, and a pool with no axis predicts none of it.

A fading pool has a shape

part 7
What reaches the retina, and why the observer's table stops at 360 nanometres. The transmittance of the eye's own optics across the short-wave band, at three ages, with the brightener's absorption shaded underneath. The upper curve is an eye whose lens has been removed — the cornea alone, opaque below about 295 nanometres and transparent above it. The photopigments absorb perfectly well in this band; what stops the light is a piece of optics in front of them, which is why the short-wave limit of colour vision moves with age and can be removed surgically. A twenty-year-old receives 21 times as much of the band a brightener works in as a seventy-year-old does.

The eye stops at the lens

part 8
One observer's matching functions, in three of the bases the matches leave free. The three colour-matching functions after a change of basis 0.00 of the way from Hunt–Pointer–Estévez towards the set built from the dichromat confusion points. Every one of these triples predicts exactly the same matches as every other, because a match is an equality and a matrix applied to both sides of an equality changes nothing. What moves is where the peaks are and whether the curves go negative — these ones do not, and going negative is what the 1931 committee constructed XYZ to avoid.

The matches do not name the cones

part 9
Where a dichromat's confusions converge. Every pair of colours a protanope cannot tell apart lies on one of these lines, and all the lines meet at a single point — at (0.7465, 0.2535) for this class. The point is the chromaticity of the missing cone's own response direction, which is why it need not lie inside the diagram or correspond to any light at all. Two of the three do not. The three points between them carry six numbers, and six is two thirds of what the matching data leave undetermined.

A confusion point is a missing pigment

part 9
Four different bases, one adaptation model, one number. The middle row of the basis built from the confusion points multiplied by 0.21, 1, 3.7 and 11 in turn, with the resulting adaptation residual drawn as a bar in each case. The four bars are the same height to 9e-16 of a ΔE00, because the row's scale cancels exactly between the gain and the inverse. Three of the nine numbers a colour match leaves free are invisible to an adaptation model, which is why the six the dichromat data supply determine it outright with nothing left to fit.

The three numbers a gain cannot see

part 10
How cone-like a basis is, against how well it adapts. Each basis placed by how far its own implied deuteranope confusion point falls from the measured one (horizontal) and by how much an adapted observer is left with in it (vertical). The construction from the confusion points sits at zero on the horizontal by definition and near the top on the vertical. Nothing near the left of the picture is near the bottom: the closer a basis is to the receptors, the more a von Kries gain leaves behind. The unconstrained winner sits at 1.63 on the horizontal, further from the measurement than any published transform except CAT02 and Bradford.

The best axes are not receptors

part 10
Nine eigenvalues, six of which exist. Nine points on a logarithmic vertical axis: the eigenvalues of the Hessian of the adaptation residual at its own optimum, largest to smallest. The first six run from 6.8×10² down to 7.6×10⁻¹, a condition number of 890. Then the axis drops: the seventh is 1.9×10⁻⁴, and the last three are separated from the sixth by a factor of 4.0×10³. Those three are not small curvatures. They are the finite-difference truncation error on directions along which the objective is exactly constant, and a shaded band marks them as the numbers the objective does not have.

The rank is the invariance

part 11
A template that cannot place a point, fitted three ways. Three rows, one per set of stimuli the pigment template's cone matrix can be fitted over, each listing the three confusion points that matrix implies. The protanope's point wanders from (0.99, 0.20) to (0.76, 0.13) against a measured (0.75, 0.25), and the deuteranope's moves by 22.5 in chromaticity — further than the whole diagram is wide. A copunctal point is where two nearly parallel planes meet, so a template good to a few per cent, which is far more than enough to place a spectrum, is nowhere near enough to place this. It is why the population is built by moving the measured points rather than by deriving them.

A template cannot place a point

part 11
Every width at the wide end of its span, and at the narrow end. One line per published quantity, each spanning the value it takes when all four declared widths are read at the narrow end of their reported ranges to the value at the wide end, with a marker at the value as declared. The largest span is the deutan margin at a factor of 2.62; the smallest is 1.22. This is the reading the population model's own documentation promised for four phases and nothing ever took. It is not a confidence interval — the four ends are not quantiles and the widths are not independent draws — it is what a reader who distrusts all four at once sees.

A width nobody varied

part 9
Which width carries the answer, and which carries the doubt. Two columns of bars over the four things that differ between two pairs of eyes. On the left, the share of the population's disagreement each one accounts for — the attribution quoted here since the population was built, which puts the lens first at 81%. On the right, how much of the doubt each one puts on everything published here, which is its elasticity multiplied by how badly the width itself is known. The macular pigment comes first there, at 0.65 against the lens's 0.60 — a lead of 8%. The two lists agree exactly below the top.

Which measurement is worth making

part 10
No one surface carries the answer, and the set is smaller than it looks. A falling bar chart of the 125 surfaces in the test set, ordered by how much each contributes to the published mean for daylight to tungsten. The tallest bar is 1.50 per cent of the total, so the mean is not a few awkward objects with a crowd behind them and a leave-one-out would move it by well under a per cent. The tail is the other half of the story: 5 surfaces contribute essentially nothing, because a flat grey is a surface an adaptation gain handles exactly. Counting the set by how evenly it contributes rather than by how many members it has gives 108.5 effective surfaces out of 125, which is what "a mean over a hundred and twenty-five surfaces" is really worth.

The surfaces that answer nothing

part 11
A confusion point is about the pigments that remain. Three groups of three bars. Each group is one dichromat's confusion point; each bar is how far that point moves in chromaticity when one of the three cone pigments has its absorption peak shifted by eight nanometres. In every group the bar for the pigment that dichromat is missing has length zero — exactly zero, to machine precision, not merely small. The protanope's point does not move when the L pigment moves, the deuteranope's does not move when the M pigment moves, and the tritanope's does not move when the S pigment moves. The reason is algebraic rather than physiological: a confusion point is the direction that excites only the missing cone, which is the null space of the other two receptors' rows, and rescaling a row does not move where the other two are zero. So the point at which a protanope's confusion lines meet is not a fact about the pigment a protanope lacks, which is why the claim about it restates in nanometres of the M pigment.

A point about the pigments that remain

part 12
The same claim in nanometres of pigment, where no declared width can reach it. Five horizontal bars on a scale of nanometres, one per published chromatic-adaptation transform, each showing how far the medium-wave cone pigment's absorption peak would have to move for the receptors' own protan confusion point to land where that transform puts it. Zero is the measured peak. The bars run from -10.5 to 18.2 nanometres — in both directions, so two of the transforms want the pigment shorter and two want it longer. Drawn across them is the 25 nm separation between the L and M pigment peaks, which is the whole basis of red-green vision and is not a number this collection declared. The nearest transform asks for a displacement of 30 per cent of that separation, and the span across the table is 28.7 nanometres — larger than the separation itself. No population, cloud or standard deviation appears anywhere in the statement.

The claim, in nanometres

part 12
How far this site's median observer sits from the 1931 standard, by template. Twenty-four natural reflectances under D65, each given a tristimulus value twice: once by the 1931 colour-matching functions and once by this site's median member, with each judged against its own white. The bar is the mean difference, which is the residual this collection bounds and calls inescapable. It is inescapable, and it is smallest for the simpler template: Lamb's 1995 nomogram gives 0.9006 against Govardovskii's 0.9522, and removing Govardovskii's secondary band brings it down again to 0.9354. Neither is an argument for changing template — a nomogram is fitted to measurements of individual receptors, not to colour matches, so agreement with the standard observer is not what either was trying to achieve. What it says is that the residual is a mismatch between two kinds of observer rather than a shortfall a better pigment model would close. The number after each bar is the template's tail ratio: how far the L cone's half-maximum reaches below its peak against how far it reaches above.

The population rests on a template

part 12
A template's asymmetry against what its observer costs. The horizontal axis is the tail ratio of the L cone's pigment absorbance — how far the curve reaches below its peak at half maximum against how far it reaches above — and the vertical is how far the observer built from that template sits from the 1931 standard. A real visual pigment has a long short-wavelength tail, so the three curves derived from a published nomogram sit above 1.1 and the two Gaussians sit below. The four are matched in width, so nothing here is about size. The ordering is the point: the two caricatures cost between two and four times what either nomogram does, and the axis they are separated on is the one feature the caricatures do not have.

A template is mostly its tail

part 13
The secondary band, dialled from nothing to twice what Govardovskii published. Govardovskii's template has a second, smaller absorption band below 400 nm, published at 0.26 of the α-band's peak. It is the one coefficient in the whole template whose contribution is somewhere else in the spectrum than the peak, and it is the part of the template a reader is least likely to have heard of. Sweeping it from nothing to twice the published value moves the median observer's distance from the 1931 standard from 0.9354 to 0.9790 ΔE₀₀, monotonically upwards. That is a small effect — about a fiftieth of the residual — and its being monotone is the interesting part: there is no interior optimum, so nothing here recommends the published value over any other, and a coefficient whose measured value is not the one that best fits an unrelated agreement is a coefficient to leave where the measurement put it.

The band below four hundred

part 13
What is read at each distance from the edge of a lit region. Three materials under a half-plane of light, with the boundary at the centre of the horizontal axis and the lit side on the right. The vertical axis is the radiance leaving the surface as a share of what it leaves far inside the lit region. On the unlit side the sample is emitting light while receiving none, so the ratio the model calls a reflectance has a zero denominator there. The distance over which the curve runs from a tenth to nine tenths is 0.21 millimetres on coated paper and 5.1 on pale marble — which is the width of the neighbourhood a point's colour is decided by.

Two blurs before the eye's own

part 12
The arguments a standard observer does not have. Seven choices inside a set of colour-matching functions, each with the shape it takes and what it is worth in ΔE₀₀ on a red pigment under a 6500 K radiator. Six are measurements: a field size, an age, a macular density, a cone optical density, three peak wavelengths and a rod contribution. The seventh is not — a change of basis is a change of curves and not a change of observer, and its entry is exactly zero because the space an experiment measures is what an observer is. Printing that zero beside the others is the clearest statement of what the other six are measurements of.

The third factor is a construction

part 13
The conditions under which an observer's departure is exactly zero. A departure of the observer is the pairing of something belonging to the observer with something belonging to the stimulus, so emptying either factor empties the product. The axis is logarithmic in what is left when the condition is imposed. Six rows empty the stimulus's factor — a perfectly neutral sample is the same colour for every observer, at any age and any field size — and two empty the observer's, since a gain on each cone and a change of basis are both absorbed exactly. All eight are identities rather than small numbers. The last two are the same two conditions imposed in a published cone space rather than in the observer's own, and they are worth eight and thirteen units: the identity is about the eye, and the arithmetic everybody uses is in somebody else's coordinates.

A neutral is everyone's colour

part 14
The three cone absorptances at two settings of the cone optical density. Solid and dashed are the same construction at the two ends of two standard deviations of the reported spread. The curves are built from one pigment template through its ocular media, which is the same model its population of two hundred eyes is drawn from. The largest difference between the two sets is 18.8 per cent of the peak, and where it sits along the wavelength axis is what decides which stimuli the two observers disagree about — a departure concentrated in the blue is invisible on a sample with no blue in it.

A gain is not an observer

part 14
The arguments a standard observer does not have. Seven choices inside a set of colour-matching functions, each with the shape it takes and what it is worth in ΔE₀₀ on a red pigment under a 6500 K radiator. Six are measurements: a field size, an age, a macular density, a cone optical density, three peak wavelengths and a rod contribution. The seventh is not — a change of basis is a change of curves and not a change of observer, and its entry is exactly zero because the space an experiment measures is what an observer is. Printing that zero beside the others is the clearest statement of what the other six are measurements of.

Three curves for one space

part 14
What choosing a space to divide the white out in is worth. Three pairs of routes to the same colour, over forty-two surfaces: dividing the white out in tristimulus values, in a published cone space, and in the observer's own cones. The first two agree to 0.59 ΔE₀₀ at the median. Either of them differs from the observer's own cones by more than fifteen. That is why the two exact conditions in this round are exact only in the eye's own coordinates: the identity belongs to the receptors, and every published arithmetic works in a basis somebody else chose.

The identity is in the eye's own coordinates

part 15
Every departure under every light. Six departures across six lights, each cell the difference between two observers in ΔE₀₀, drawn as a bar whose length is the number. The rows are not multiples of one another: the lens is worst under tungsten and the pigment peaks are worst under a three-emitter LED, because a departure is a pairing and which light is being paired with decides it. The laser projector's row is empty, and that is not a fact about lasers — on this collection's five-nanometre grid a three-line spectrum is a one-line spectrum, and a single wavelength is a stimulus every observer agrees about exactly.

The lens is worst under tungsten

part 14
Each departure over forty-two surfaces rather than one. The same six departures measured over a family of forty-two analytic reflectances — an absorption band of stated centre, width and depth — with the smallest, the median, the ninety-fifth percentile and the largest marked. Every one of them spans more than a factor of three, and the ranking between them is not stable across the family: what decides a departure's size is which sample it is asked about, because a departure is a pairing and the sample is one of the two factors. Quoting any single number for what an observer's age is worth is quoting a choice of example.

The ranking is not stable

part 15
The three cone absorptances at two settings of the field size. Solid and dashed are the same construction at the two ends of the CIE's own second observer. The curves are built from one pigment template through its ocular media, which is the same model its population of two hundred eyes is drawn from. The largest difference between the two sets is 16.0 per cent of the peak, and where it sits along the wavelength axis is what decides which stimuli the two observers disagree about — a departure concentrated in the blue is invisible on a sample with no blue in it.

A field size is two changes

part 15
The three cone absorptances at two settings of the age of the lens. Solid and dashed are the same construction at the two ends of twenty years old against seventy. The curves are built from one pigment template through its ocular media, which is the same model its population of two hundred eyes is drawn from. The largest difference between the two sets is 25.5 per cent of the peak, and where it sits along the wavelength axis is what decides which stimuli the two observers disagree about — a departure concentrated in the blue is invisible on a sample with no blue in it.

The observer has no age

part 15
The three cone absorptances at two settings of the rods. Solid and dashed are the same construction at the two ends of a tenth of the cone response, which is a dim room. The curves are built from one pigment template through its ocular media, which is the same model its population of two hundred eyes is drawn from. The largest difference between the two sets is 9.1 per cent of the peak, and where it sits along the wavelength axis is what decides which stimuli the two observers disagree about — a departure concentrated in the blue is invisible on a sample with no blue in it.

The rods are a fourth curve

part 15
The three cone absorptances at two settings of the macular pigment. Solid and dashed are the same construction at the two ends of two standard deviations of the reported spread. The curves are built from one pigment template through its ocular media, which is the same model its population of two hundred eyes is drawn from. The largest difference between the two sets is 31.5 per cent of the peak, and where it sits along the wavelength axis is what decides which stimuli the two observers disagree about — a departure concentrated in the blue is invisible on a sample with no blue in it.

The macular is a band, not a filter

part 15
The three cone absorptances at two settings of the pigment peaks. Solid and dashed are the same construction at the two ends of two standard deviations, and the L/M polymorphism on top. The curves are built from one pigment template through its ocular media, which is the same model its population of two hundred eyes is drawn from. The largest difference between the two sets is 8.9 per cent of the peak, and where it sits along the wavelength axis is what decides which stimuli the two observers disagree about — a departure concentrated in the blue is invisible on a sample with no blue in it.

The peaks move the flanks

part 15
The conditions under which an observer's departure is exactly zero. A departure of the observer is the pairing of something belonging to the observer with something belonging to the stimulus, so emptying either factor empties the product. The axis is logarithmic in what is left when the condition is imposed. Six rows empty the stimulus's factor — a perfectly neutral sample is the same colour for every observer, at any age and any field size — and two empty the observer's, since a gain on each cone and a change of basis are both absorbed exactly. All eight are identities rather than small numbers. The last two are the same two conditions imposed in a published cone space rather than in the observer's own, and they are worth eight and thirteen units: the identity is about the eye, and the arithmetic everybody uses is in somebody else's coordinates.

Two observers and one metamer

part 15
What the rods cost a match, by where their signal enters and under which lamp. For five lights, the median colour difference over forty-two surfaces between the reference observer and the same observer with a rod signal a tenth of each cone's peak added — into all three cone channels, into the long- and middle-wavelength channels only, or into the short-wavelength channel only. Under daylight the first two are 1.03 and 0.90: whether the rods reach the S pathway hardly matters. Under a phosphor white LED they are 1.24 and 0.45, a factor of 2.75, and the S-only route alone costs 0.96.

The rods' route is priced by the lamp

part 16
Which two lamps to stand a mesopic match between. Every pair of the five lights, by how far a match made under one and set under the other moves as the rod signal's weight into the S channel goes from nothing to equal — the median over forty-two surfaces, which is the signal an experiment has to resolve. The best pair is daylight against phosphor LED at 0.58 ΔE₀₀; the worst is tungsten against fluorescent tube at 0.09, a factor of 6. The count at the right is how many settings it takes to resolve the weight to a tenth at half a colour difference of scatter per setting.

The reference lamp must not move

part 17
Two ways to ask how much rod signal an older eye has. The rod signal's catch of each lamp divided by the S cones' own catch, against the observer's age, for five lamps — drawn twice. The upper curves take the rod signal at a fixed absolute size, and every one of them roughly doubles from twenty to seventy-five: an older lens cuts the blue before the S cones see it and the rods, peaking further into the green, lose much less. The lower curves take the rod signal at a tenth of each cone's own peak absorptance, which is the model's own definition, and they barely move at all. Nothing about the retina differs between the two; only the normalisation does.

A rod signal has no natural size

part 17
How far a mesopic match moves as the S weight opens: two rooms against one field. For every pair of the five lamps, the median over forty-two surfaces of how far a match moves as the rod signal's weight into the S channel goes from nothing to equal: pale for the two-room match, each half adapted to its own lamp; dark for a bipartite field whose two halves share one adaptation. The field's signal is larger for every pair, by ×1.5 to ×7.7.

One field keeps what two rooms divide out

part 18

All essays