Concept

The ICC profile — where it appears

A file describing what a device does to colour, as a matrix and a curve or as a lookup table with interpolation between its entries. Two profiles connect through a common space, so every conversion is two maps and inherits the losses of both.

Named by 25 essays across 4 fields — each of them below, with the objects they name alongside it.

The sRGB transfer function, and the gamma 2.2 curve it is not. Code value against relative luminance. The sRGB function is piecewise — a short linear segment near black, then a 2.4 power law with an offset — and it is close to but not the same as a plain 2.2 power law. Half-way along the axis of stored values sits at 21 per cent luminance, and half the luminance of white is at code 188.

A hex code is not a colour

Six hexadecimal digits identify three numbers. Turning three numbers into a colour needs a colour space, a transfer function, a white point and a display, and leaving any of them unstated is the everyday version of every confusion in colour management.

matching · Gamut
Everything between the photons and the picture, and what each stage decides. The 8 stages of a camera pipeline. Only the second is physics; every one after it is a decision somebody made, and the reason two cameras pointed at the same scene disagree is that they made different ones.

Raw is not a picture

A raw file is three integrals per site and a list of decisions nobody has taken yet. Every one of those decisions has a defensible answer and none of them has a correct one, which is why two converters open the same file and disagree.

imaging · Capture
A camera profile is a fit, and the sample set is a hidden argument to it. Per-surface ΔE00 after the best 3 × 3 from raw to XYZ, fitted on 12 surfaces at chroma 0.2 and tested twice: on those same surfaces (mean 0.65) and on 12 at chroma 0.9 (mean 1.75). Both bars come from the same matrix; only the surfaces differ.

A camera profile is a fit

Since no matrix is exact, the one a manufacturer ships is a least-squares compromise over a set of surfaces somebody chose. Fitted on desaturated patches it is excellent on desaturated patches — and the sample set is a hidden argument to every camera profile in existence.

imaging · Capture
The best a camera profile can do on the surfaces it was fitted to. Per-surface ΔE00 after the best 3 × 3 from raw to XYZ, fitted on 12 surfaces at chroma 0.7 and tested on those same 12 surfaces — mean 1.45, worst 2.58. This is the most favourable measurement it is possible to make of a camera and it is the one usually published.

No matrix is right everywhere

The best three-by-three this sensor admits, fitted and tested on the same twenty-four surfaces, leaves a worst case of ΔE00 2.85. A control sensor built to satisfy Luther's condition reaches ten to the minus seven under the identical computation, which is what makes the first number a measurement.

imaging · Capture
How wrong a profile is between its entries. A device profile is a lattice of measured patches and an interpolation. At every node of every grid drawn here the error is exactly zero, which is why a profile checked at its own patches always looks perfect. Sampled between the nodes, a 3-step grid is worst by ΔE00 = 2.93 and a 17-step grid by 0.30. Both are honest tables of the same press.

A profile is a table

An ICC profile does not contain a model of the device it describes. It contains a lattice of patches that were printed and measured, and everything between them is interpolation — which is exactly zero at every patch, so a profile checked against its own target reports perfection for ever.

applied · Delivery
The process inks as reflectance. Each ink is a sum of Gaussian absorbance bands with stated centres, widths and peak densities, and the reflectance shown is the substrate's times the square of the ink's transmittance, because light crosses the film going down and coming back. The first band of each ink is what it is for; the rest are what is wrong with it. Magenta's unwanted absorption in the blue-violet reaches an optical density of 0.46 against 0.95 for the band it exists to have — 48 per cent of its own strength, absorbing exactly where a saturated blue needs light to survive.

The paper is the white point

A printed colour is reported against the sheet it sits on rather than against the light in the room, and the choice is a switch in every colour engine. Flipped one way, the same separation on coated stock and on newsprint is a 3.04 colour difference; flipped the other, it is 0.13 — and the two answers are about different questions.
applied · Delivery
What separates the separations, and under which light. 11 separations of a single colour, differing only in how much of it is carried by black rather than by the three chromatic inks. Under D50 they agree to ΔE00 = 0.00 — the solver was asked for that and delivered it. Under illuminant A they spread to 6.75. They are metamers of one another, and the whole family is invisible to any instrument reading a single illuminant.

The separation is not unique

A four-ink press has one more control than a colour has numbers, so most colours can be printed several ways. The alternatives agree to a hundredth of a colour difference under the light the match was made in — and they are metamers of one another, so under a tungsten lamp the same eleven separations of one colour spread by nearly seven.
applied · Delivery
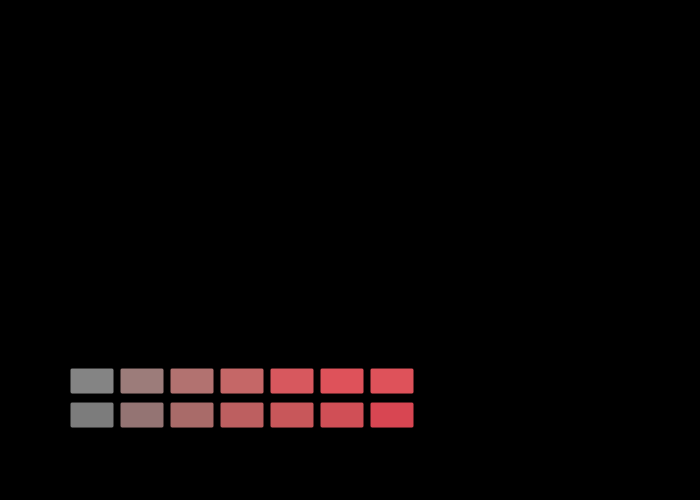
A gradient of one hue, mapped into a press's gamut 2 ways. Chroma asked for along the bottom, chroma delivered up the side, for a ramp at lightness 55 and hue angle 25°. A colorimetric intent follows the diagonal until the press runs out and is flat afterwards — the flat part is a gradient arriving as a single colour. The perceptual intent is under the diagonal from the start, which is the price of never going flat.

No mapping preserves everything

More than half the sRGB solid is outside a press's gamut, so something has to be done with it, and there are two things that can be done. One leaves every reproducible colour exactly where it was and delivers a gradient as a flat area. The other keeps the gradient and moves every colour that needed no help by about three.
applied · Delivery
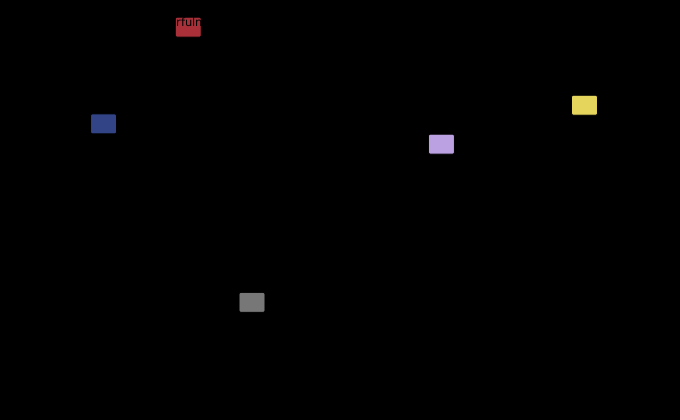
Lightness against colourfulness, in a booth and on a screen. Each arrow is one colour, from what the model predicts under a print in a 2000 lux booth to what it predicts under a display in a dim room. Every arrow points the same way, which is the content: a dimmer surround lowers predicted lightness and colourfulness together, so a proof does not merely differ from the print, it differs in a direction — and that is why proofing standards specify the room and not only the numbers.

The proof is a different object

A soft proof can be made colorimetrically exact and still not match the print, because the print is in a booth at two thousand lux with an average surround and the screen is in a dim room at a fifth of the luminance. The appearance model puts four CAM16-UCS units between them, with no change of stimulus anywhere — larger than the error any rendering intent is arguing about.

applied · Delivery
Which of two reproductions is better depends on which statistic is asked. A specification for a proof or a print run is written against a set and has to reduce the set to one number. Here are two candidates: the one with the lower mean has the higher ninety-fifth percentile, so the mean prefers A and the tail prefers B. Across 2000 pairs of candidates generated the same way, the two statistics disagree about the winner 30 per cent of the time. Both numbers are honest; only one of them is what somebody notices.

A mean is not a difference

A specification for a proof, a profile or a print run is written against a set of colours and has to reduce that set to one number. The mean and the ninety-fifth percentile disagree about which of two reproductions is better in thirty per cent of cases, and both numbers are honest.

difference · Metric
Media-relative colorimetry is a von Kries adaptation in the worst basis there is. Changing the paper is a change of the light reaching the reader, and the rule colour management uses for it — divide the tristimulus values by the substrate's — is a gain applied in XYZ. That is the one transform the table here describes as the oldest mistake still shipping. On the three stocks a press actually uses the penalty is real and small, because a sheet of paper-mill white is the smoothest change of light in the census. On blue it is 10.2 times the residual the same rule would leave in a cone basis.

Dividing by the paper

Media-relative colorimetry divides tristimulus values by the substrate's, which is a von Kries adaptation applied in XYZ — the one basis the table here describes as the oldest mistake still shipping. On a paper-mill white it costs a few hundredths of a unit. On a tinted sheet it costs ten times what the same rule costs in a cone basis.

applied · Delivery
What a proof on an unbrightened sheet cannot reach. The paper white of a heavily brightened stock beside the paper white of an unbrightened one, both under an ultraviolet-included instrument. They are ΔE00 9.8 apart and 10.3 of that is in the blue-yellow axis. A proofing system on the unbrightened sheet can print towards the brightened one only by adding ink, which makes the paper darker rather than bluer; it cannot add light at 435 nanometres because it has no brightener and its own lamp is the one in the room. This is why a soft proof and a hard proof of the same job disagree about the white, and why the disagreement is in one direction.

A proof cannot glow

A proof is a different sheet of paper pretending to be the production one, and the pretence works by adding ink until the two agree. It cannot work for a brightened stock, because the direction the proof has to travel is towards more blue at the same lightness and every ink a proofer owns moves it towards less light instead.

applied · Delivery
A camera matrix fitted under each light, used under each light. Mean ΔE00 over the same surfaces, with the matrix fitted under the row's light and the scene under the column's. The diagonal is what a profile's data sheet quotes and is between 1.0 and 1.2 everywhere. Off it the numbers rise steeply: the matrix fitted under illuminant A reports 1.17 there and delivers 9.34 under a 9000 K daylight, a factor of 8.0. Nothing about the camera changes between cells.

A matrix is fitted under one light

A camera's colour matrix is nine numbers determined by a chart photographed under a particular illuminant, and the error it quotes is the error under that illuminant. Fitted under a tungsten lamp and used under a cold sky it delivers eight times as much — and the two-matrix scheme every real profile uses turns out not to be a compromise at all.

imaging · Capture
What the next thousand patches buy a printer profile. A profile is a table, exact at its nodes and interpolated everywhere else. Each mark is a grid: the horizontal axis is how many patches somebody had to print and measure, the vertical is the worst error found between the nodes. Going from 135 patches to 3645 — 27.0× the work — buys 8.4× the accuracy. The error falls with the square of the spacing and the count rises with its cube.

A profile is a fit between its nodes

A printer profile is a table, exact at every patch that was printed and interpolated everywhere else — and everywhere else is where every job lives. Going from a hundred and thirty-five patches to three and a half thousand is twenty-seven times the work for eight times the accuracy, and the exponents say that is as good as it gets.

applied · Delivery
Best on the average, undefined at the edge. Two rows of bars sharing one set of labels. On the left, each adaptation basis's mean residual over the fourteen changes of light the census lists — Bradford is the shortest bar at 1.14 ΔE00 and is what colour management uses. On the right, the same bases against the worst change the same family of painted rooms can produce. Three of the five have no bar there at all, marked instead with the gain that replaced it: under a deep narrow notch their reading of the white passes through zero, so the diagonal is a division by nothing and the model stops being defined rather than merely doing badly. Bradford's middle gain reaches -1.0e+19. CAT16, which exists because CAT02 was withdrawn for going negative in practice, is one of the two that survives.

Best on the average, undefined at the edge

Bradford has the lowest mean residual of any adaptation transform over the census of illumination changes, which is why colour management uses it. Inside the family that census was drawn from, its middle row's reading of the white passes through zero — so the gain is a division by nothing, and the model stops being defined rather than merely doing badly. CAT16, which exists because its predecessor did this, does not.

applied · Delivery
At a published matrix the slope arrives long before the bowl. One row per basis in this collection's table. Each row is a logarithmic axis of distance in the nine coefficients, with two markers: the radius at which the objective's curvature becomes as large as its slope, and the distance from that basis to the optimum. The first is between 3.2 and 108 per cent of the second. So over almost the whole journey from a published matrix to the best one, the surface is a slope and not a bowl — and a table of eigenvalues taken there describes a neighbourhood the optimum is nowhere near. XYZ scaling is the exception, at 1.08 of the distance, because its slope is the steepest in the table.

The slope arrives before the bowl

The adaptation transforms colour management actually uses are not optima of anything. At every one of them the objective has a slope, and the slope is the larger term over almost the whole distance to the best matrix — so a table of curvatures taken there describes a bowl nobody meets on the way anywhere.

applied · Delivery
Where a delivered colour's error actually comes from. Three bars and two totals. The profile's interpolation between its nodes contributes 0.13 ΔE00; the rendering intent, at the colorimetric setting, moves nothing that was already printable and contributes 0.00; and looking at the result in a dim room rather than the booth it was proofed in contributes 4.30, which is 97 per cent of the total. The two totals are the three added — 4.43 — and combined in quadrature — 4.30. The gap between those two rules is 0.127, about the size of the entire profile stage, and no standard says which rule to use.

A delivery tolerance is three tolerances

A colour reaches a reader through a profile, a gamut mapping and a room, and each has a number somebody chose. Each has an essay of its own here, and none of those essays had put the three costs in one column. Put there, the stage nobody controls carries ninety-seven per cent of the total.

applied · Delivery
Three exchanges, two of which move the colour. The documented pipeline is a white balance, a colour matrix, a tone curve and a clip. Each bar is what happens when two neighbours change places, over 30 surfaces the modelled sensor captures: the filled bar is the mean and the tick is the worst patch. Exchanging the balance and the matrix costs 9.2 colour differences at the mean and 13.2 at the worst. Exchanging the curve and the clip costs exactly nothing, and that is a theorem rather than a small number: a monotone curve onto the unit interval commutes with clamping to it.

The order is not in the documentation

A raw converter performs a white balance, a colour matrix, a tone curve and a clip, and every account of the process lists them in that order without saying the order decides anything. Exchanging the first two moves the picture by nine colour differences at the mean and thirteen at the worst patch. The twenty-four arrangements collapse into five outcomes running out to sixty-five, and nothing a converter ships says which of them it is.

imaging · Capture
The budget's three numbers, and the units they are in. The published three-stage budget's own figures, with each one's unit named, beside the same stage re-measured in a single unit over the same colours. Two of the three are colour differences between stimuli and the third is a distance between appearances, and the budget adds them. The fourth row is a stage the budget has no entry for: the colours the separation cannot reach even after the mapping has moved them, which comes to 1.45.

The budget adds two units

This collection publishes a three-stage error budget for a colour-management chain and prints its sum. Two of the three stages are colour differences between stimuli and the third is a distance between appearances, and the conversion between those is not a constant. Re-measured in one unit over the same colours the chain has four stages rather than three, its end-to-end error is 5.05 against a sum of 7.66, and the profile's contribution where a job actually lands is 3.2 times its published average.

applied · Delivery
The same colour, delivered from two documents. A ramp of chroma, mapped into a press's gamut under the perceptual intent from two source solids: the whole of sRGB, and the same solid with its chroma limited, which is what a document containing only muted colours amounts to. Under a colorimetric intent the two answers are identical to the floating-point floor. Under the perceptual one they are 0.69 apart at the mean and 2.64 at the worst, on colours the destination could hold either way.

An intent is not a function of the colour

A rendering intent is chosen per job and applied per pixel, which suggests it is a function of the colour. The colorimetric ones are, exactly — the same colour from two documents comes out identical to the floating-point floor. The perceptual one is not — it compresses the whole source solid into the destination, so the same colour delivered from a wide document and from a muted one lands 2.6 colour differences apart, on colours the destination could hold either way.

applied · Delivery
Out to the device and back, once and again. Each intent applied 3 times in succession to the same ramp. The upper bar is what the first pass moves and the lower is what the second moves. relative-colorimetric is idempotent — the second pass moves nothing, to the floating-point floor — and the other two are not: perceptual moves another 2.73 and saturation moves another 3.09. A file converted twice is not a file converted once.

A second conversion is not a repeat

A colour converted to a device and back is described as lossy where the device cannot hold it and exact where it can, which suggests that a colour surviving one round trip survives any number. One of the four intents is idempotent to the floating-point floor. The other two are not — a perceptual conversion moves a ramp 3.70 colour differences on its first pass and another 2.73 on its second, and after three passes it is still moving by 2.42.

applied · Delivery
How far the chain falls short of its sum, and how much of that is the unit. For each rendering intent, three ratios of the chain's end-to-end error to the sum of its four stages. The lowest bar is the published one, in the power-corrected unit. The middle bar is what that unit reports for a chain whose stages point the same way and add exactly — the exponent on its own. The top bar is the same chain measured in the model's own Euclidean space. Under the colorimetric intent the published ratio is 0.66, the exponent alone gives 0.74 and the chain in a space that can add 0.84: 77 per cent of the shortfall is the unit.

A chain measured in a unit that cannot add

A delivery chain's four stages, measured in the power-corrected appearance difference, sum to 7.66 while the chain end to end measures 5.05, and the shortfall was read as the stages partly cancelling. A chain whose four stages lay in a straight line and added exactly would still read 0.74 of its sum in that unit, because a distance raised to the power 0.63 cannot add. Measured in the model's own Euclidean space the same chain reaches 0.84 of its sum. Three quarters of the published shortfall was the exponent.

applied · Delivery
The error between a profile's nodes is a bias, not a scatter. Two quantities against the lattice size: the mean colour difference between the nodes, and the mean signed lightness error. If the interpolation erred in both directions the second would be near zero while the first was not. They lie on each other — 0.136 against 0.133 at a nine-step lattice — so the whole of what a profile does between its patches is to lighten. It errs light because a press's response is convex in ink coverage: the first drop of ink removes more light than the last, and a straight line between two points on a convex curve lies above it. At three steps 400 of 400 samples err light.

A profile interpolates light

A profile is exact at its patches and wrong between them, and how wrong has been measured twice. Which way it is wrong has not. At a nine-step lattice the mean signed lightness error between the nodes is +0.136 against a mean colour difference of 0.133 — the error is not a scatter but a bias, and it lightens. The repair costs nothing measured and is forbidden by how a profile is checked: let the table be wrong at its own patches.

applied · Delivery
One instrument, one uncertainty, six places on the scale. What an absolute uncertainty of 0.001 in measured reflectance is worth in lightness, at six levels from a four-colour solid to the paper. Nothing about the instrument changes between the rows: what changes is the slope of the lightness function, which is a straight line of 903 units per unit of luminance factor below a luminance of 0.0089 and a cube root above it. At the solid the uncertainty is 0.903 lightness units and at the paper 0.043 — 21 times as much, for the same measurement.

The scale hangs from one measurement

Black point compensation is a straight line between two blacks, and the destination's is a measurement of one patch at the darkest place a spectrophotometer is ever asked to read. The lightness scale's slope is 903 units per unit of luminance factor there and 43 at the paper, so a thousandth of a reflectance is worth nine tenths of a lightness unit at the black and four hundredths at the white. That one number moves a mid grey by nearly a quarter of a delivery tolerance, and no specification names it.

applied · Delivery
A four-ink inverse table's error along the grey axis, 9 nodes, black from L* 60. The colour difference between a grey asked for and the grey printed, from L 92 to 14, for a 9-node inverse table whose separation strategy begins black generation at L 60 (dashed line). Three tables: filled exactly from the strategy, mean 0.073; refitted with each node sliding along the strategy, 0.050; refitted freely, 0.036. To the left of the dashed line the strategy-bound refit lies close to the filled table; to the right it lies close to the free refit. Every table is exact at its nodes, marked on the axis.

A strategy keeps the refit only where black prints

Refitting an inverse table's nodes against their own error halves it, and in a four-ink table the refit has to leave the separation strategy's choice of black alone. Held to the strategy, it keeps the whole of its gain wherever the strategy prints black and almost none of it where the strategy does not — and the share it keeps equals the share of the grey ramp printed with black, to within three hundredths. The start of black generation, predicted to be where the refit would fail, is where the table needs it least.

applied · Delivery

Named alongside it

The objects these essays reach for when they reach for this one.

Colour managementSpecificationGamut mappingDeclared inputInterpolationChromatic adaptationQuality controlCamera rawColour matrixGamutLeast-squaresLightness

All concepts