Concept

Luminance — where it appears

A spectrum integrated against one agreed curve, defined so that it adds — which is why it is not how bright anything looks. It is additive by construction and appearance is not, so two stimuli of equal luminance can differ in brightness by a large factor.

Named by 33 essays across 9 fields — each of them below, with the objects they name alongside it.
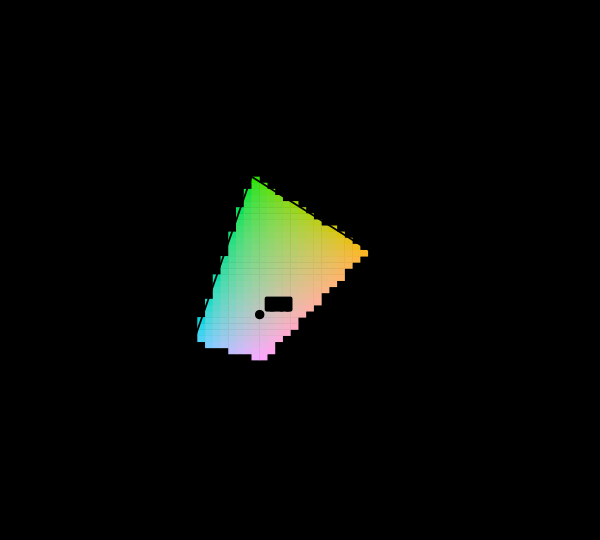
The CIE 1931 chromaticity diagram with its unreachable region marked. The spectral locus encloses every chromaticity a human eye can see. Cells inside the sRGB triangle are drawn in their own colour; the 85 per cent outside it are hatched, because no value this display accepts is the colour belonging there.

Most of this diagram cannot be shown

The chromaticity horseshoe is the canonical illustration of colour science, and nearly every printed copy is filled edge to edge with colours the page cannot produce. The honest version marks them, and the marking covers most of the picture.

matching · Gamut
Two identical grey patches on different surrounds. Both inner squares are #818181. The one on the dark field looks lighter. The values are checked to be equal before the figure is drawn, so the claim is a fact about the drawing rather than a promise.

These two patches are identical

It is the most repeated and least checkable sentence in visual perception, because the whole point is that it does not look true. Every instance here is computed, and checked before the figure is drawn.
brain · Appearance
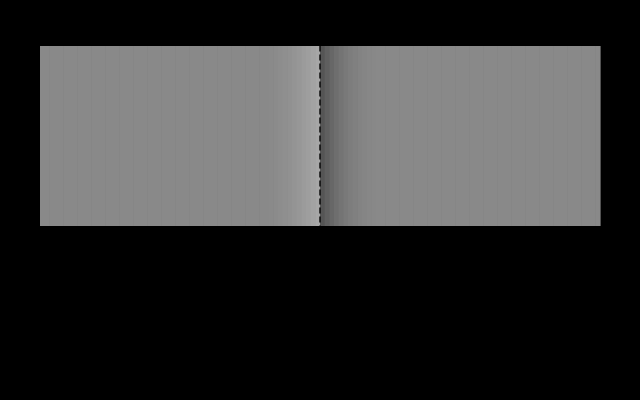
The Cornsweet edge, with its luminance profile. The two plateaux are both #898989 and are flat to exactly — the profile below shows that everything which differs lies within a narrow band at the boundary. Cover the centre line and the two halves become obviously identical.

Brightness is inferred from edges

The Cornsweet effect makes two identical regions look different by altering nothing except a narrow band at the boundary between them. Cover the boundary and the difference vanishes, which says the visual system is reconstructing surfaces rather than reading off intensities.
brain · Appearance
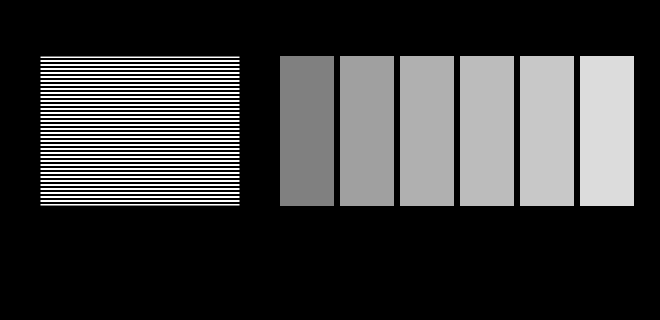
A gamma probe: which grey matches a half-white dither?. The striped block on the left is half white and half black, so it carries half the luminance of white. Stand back until the stripes blur and find the patch that matches it. On an sRGB display the answer is code 188, not 128 — code 128 has only 22 per cent of white's luminance.

The display is an unknown

This site is displayed on the very apparatus it is about, and it knows almost nothing about that apparatus. Two figures here stop assuming and ask instead — a probe for the transfer function and a probe for the gamut.

limits · Limits
The sRGB transfer function, and the gamma 2.2 curve it is not. Code value against relative luminance. The sRGB function is piecewise — a short linear segment near black, then a 2.4 power law with an offset — and it is close to but not the same as a plain 2.2 power law. Half-way along the axis of stored values sits at 21 per cent luminance, and half the luminance of white is at code 188.

The midpoint is not half

Code 128 sits halfway along the sRGB scale and carries about a fifth of white's luminance. Half the luminance is code 188. Almost every gradient, blur and resize on the web gets this wrong, and the errors are visible once known.
difference · Metric
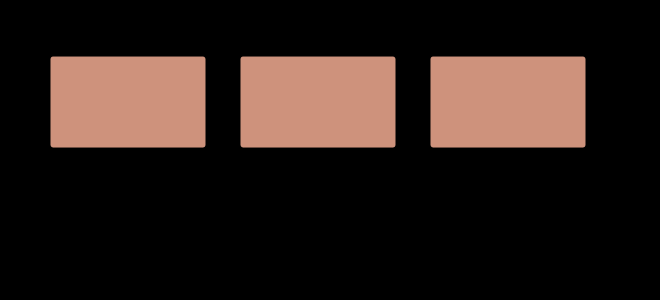
One stimulus, three rooms, three appearances. The same XYZ in a dark, a dim and an average surround. The stimulus does not change and is drawn identically in all three panels; what changes is what CIECAM16 says it looks like. Predicted lightness runs from 65.6 to 57.5 — a spread of 8.1 — with chroma and colourfulness moving too. Colorimetry returns one answer here because it has nowhere to put the room.

A viewing condition is an argument

An appearance model takes a stimulus and a situation. The second argument is not a refinement of the first — it is the content of the claim, and a model that returns an appearance from a colour alone has assumed a room without saying which.

brain · Appearance
The same two surfaces, weighed by each system. A long-wavelength and a short-wavelength surface under D65, with their relative luminance under the photopic curve and under the scotopic one. Under daylight vision the red surface is 1.33 times the blue; under rod vision it is 0.15 times, a reversal by a factor of 9.0. The swatches are the photopic appearance, which is the only one a display can produce: rod vision has no colour, and drawing a guess at it would be an invention.

The eye that has no colour

Rods outnumber cones twenty to one, work alone below a hundredth of a candela, and are absent from the centre of gaze. Between dusk and a lit room both systems run at once, and neither standard curve describes what is happening.

eye · Cones
Colourfulness rises with light level; apparent contrast does not. Predicted colourfulness M for one stimulus across four decades of adapting luminance, and the exponent of the lightness curve over the same range. M rises by a factor of 2.24 — the Hunt effect, which the model does predict. The lightness exponent changes by -2.2%, and in the wrong direction — the Stevens effect, which it does not.

Brighter looks more colourful

Colourfulness rises with light level and the model predicts it. Apparent contrast is supposed to rise too, and the model does not — which turns out to be right, because the thing that actually carries contrast is the surround.

brain · Appearance
Three ways to spend a thousand code values. Normalised code value against luminance, for PQ, HLG and a conventional gamma curve, all covering 0.001 to 10000 cd/m². PQ spends 51% of its range below 100 cd/m² — roughly where a picture lives — and the gamma curve spends 15%, leaving the rest for highlights. A PQ code is the only one of the three that names a luminance rather than a fraction of whatever the display can manage.

How bright is white

An sRGB value says a pixel is some fraction of whatever the display can manage. A PQ value says it is two hundred candelas. The change is the largest in display encoding since gamma, and what it removed was the honest admission that nobody knew.

limits · Limits
Three lightness scales, seventy years apart. Munsell value, CIELAB's L* and CIECAM16's J against luminance, all rescaled to run 0 to 100. Each is somebody's answer to how evenly spaced lightness steps map onto light. They put the midpoint of the scale at 19.8%, 18.4% and 28.0% of the white's luminance respectively — close enough to be three measurements of one thing, far enough apart to be three measurements rather than one restated twice.

Colour by catalogue

A colour order system arranges physical samples on a regular lattice so a person can find one and name it. The space it samples is not regular, and everything interesting about such systems is what happens at that mismatch.

matching · Gamut
Luminous efficacy of a monochromatic source, under the 2° observer. Lumens per watt against wavelength. The curve is the luminous efficiency function scaled by 683, which is what luminous efficacy of radiation is — the 1979 redefinition of the candela fixed 555 nm at exactly 683 lm/W and everything else follows. Marked at 450 nm (26 lm/W), 500 nm (221 lm/W), 555 nm (683 lm/W), 600 nm (431 lm/W), 650 nm (73 lm/W). Under this observer the peak reaches 683 lm/W.

What a lamp cannot give back

Six hundred and eighty-three lumens per watt is not a measurement of anything. It is the definition of the candela, it is a ceiling no white light can approach, and the distance between a lamp and that ceiling is mostly the price of being able to see what colour things are.

light · Light
Longitudinal chromatic aberration of the eye, focused at 555 nm. Thibos's chromatic eye, plotted as defocus in dioptres relative to 555 nm. The curve crosses zero exactly once, at the wavelength the eye is accommodating on, and everything else is out of focus — by -1.22 D at 420 nm and 0.50 D at 680 nm. Through a 3 mm pupil that first figure is a blur circle of 12.6 minutes of arc, against a foveal acuity limit of about one. The eye is never in focus across the spectrum and never can be.

Nothing is in focus at both ends

The eye carries about two dioptres of chromatic aberration across the visible band, which is a strong reading prescription. Whatever it is focused on, most of the spectrum is landing somewhere other than the retina — and the cone class that gets the worst of it is the one the retina bothered least to sample.

eye · Cones
Three retinas of different composition, making identical colour matches. Seeded mosaics at L:M ratios of 1, 4, 16 to one — the range found between people, and a 16-fold difference in what the retina is made of. A colour match is the claim that two spectra produce equal excitation in all three cone classes, and changing how many of a class there are multiplies that class's excitation by a constant, which cannot disturb an equality. The relation between the two test spectra is identical to twelve decimal places across the whole sweep. Luminance, which is a weighted sum rather than an equality, moves by 1.33× over the same range. That asymmetry is why a standard observer exists and why V(λ) has a much larger between-observer variance than the colour-matching functions do.

The mosaic is not the observer

The ratio of long-wavelength to medium-wavelength cones varies between ordinary people by a factor of sixteen. Those people make the same colour matches, to twelve decimal places, and that single fact is the reason a standard observer can exist at all.

eye · Cones
Chromaticity-triangle area against CIELAB volume, both relative to sRGB. Two ratios for each space, both against sRGB. The upper bar is the area of the primary triangle on the CIE 1931 diagram; the lower is the volume of the gamut solid in CIELAB, computed by tetrahedral decomposition of the RGB cube at 24 cells per axis. Display P3 is 1.36× sRGB by area and 1.50× by volume; Rec. 2020 is 1.89× sRGB by area and 2.26× by volume. The chromaticity diagram divides luminance out, so its triangle is a projection along the axis the eye is most sensitive to — and a coverage percentage quoted on it is a statement about the shadow.

The triangle is a shadow

A display's gamut is drawn as a triangle on the chromaticity diagram, and coverage is quoted as a percentage of that triangle's area. Chromaticity has luminance divided out, so the triangle is a projection along the axis the eye cares most about — and the ratios computed on the solid are not the ratios computed on its shadow.
limits · Limits
One stimulus, three rooms, three appearances. The same XYZ in a dark, a dim and an average surround. The stimulus does not change and is drawn identically in all three panels; what changes is what CIECAM16 says it looks like. Predicted lightness runs from 65.6 to 57.5 — a spread of 8.1 — with chroma and colourfulness moving too. Colorimetry returns one answer here because it has nowhere to put the room.

A patch is not a scene

A paint chip is the wrong size, on the wrong background, at the wrong luminance, in the wrong surround. Every one of those is a term in an appearance model, and the model says how much each of them moves the answer — which is the difference between a caution and a prediction.

brain · Appearance
What no surface can be more colourful than. The MacAdam limits at 4 lightnesses under D65, each computed by sweeping two-transition reflectances over the whole band and keeping those that land at the target luminance factor. This is a physical bound rather than a gamut: a reflectance above 1 is a surface that emits, so no pigment anybody invents will ever put an object colour outside these curves. The boundary shrinks steeply as the surface lightens, from 0.310 at Y = 0.1 to 0.028 at Y = 0.9 — a very light surface has almost no room to be colourful, and that is physics rather than pigment chemistry. Drawn against it is sRGB at the same luminance factor rather than as a primary triangle, because a triangle is what a display can reach at some luminance and the bound is what a surface can reach at one; matched properly, sRGB covers 36% at Y = 0.1, 40% at Y = 0.3, 40% at Y = 0.6, 21% at Y = 0.9. The faint triangle is the familiar figure, kept only to show how much it misleads.

No surface can be that colourful

There is a hard bound on object colour that no pigment will ever move, and it follows from a reflectance being at most 1. Its boundary is generated by two numbers, it shrinks by a factor of eleven from dark to light — and measured against it properly, sRGB reaches 40% of what a surface could be at mid lightness while Rec. 2020 reaches 106%.

scene · Scene
A grey edge, reconstructed from a Bayer row, arrives coloured. Above: an achromatic step through 24 sensor sites, with green sampled on the even ones and red on the odd. Interpolating each channel separately reconstructs them from data taken on either side of the edge, so their ratio moves. Below: the resulting chroma, peaking at 144 per cent of the local mean, and 112 per cent once colour differences are interpolated instead.

A grey edge arrives coloured

A sensor site measures one channel and the other two are interpolated from neighbours that sat somewhere else. Across a black-and-white step that reconstruction gives an achromatic scene a chroma of 144 per cent of its own local mean, and nothing in the scene or the sensor was coloured.
imaging · Capture
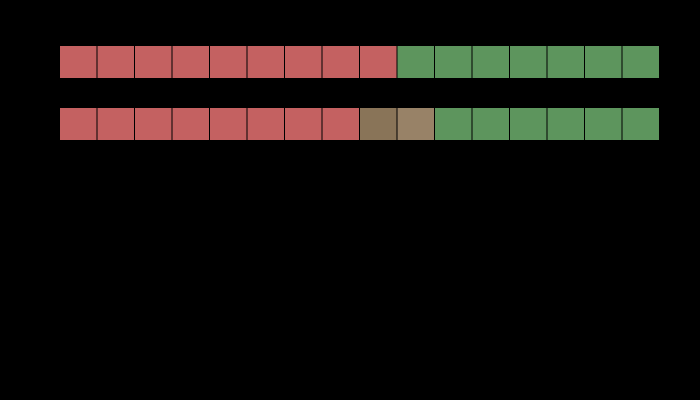
An edge at 4:2:2, and the colour it arrives as. Above, the row as it was sent and as it arrives after the two chroma planes are averaged 2 samples at a time. Below, the colour difference at each sample. The worst is ΔE00 = 25.88, at a luma step of 0.058 across the edge — an edge of nearly equal luminance. Nothing is wrong with the codec: it discards the differences the eye resolves worst, and this edge is made of nothing else.

Colour thrown away on purpose

Every video format in use discards three quarters of its colour information and keeps all of its luminance, because the eye resolves fine colour detail badly. On an edge that carries luminance the loss is exactly zero. On an edge of nearly equal luminance it is a colour difference of forty-three, and the two edges are the same edge to the codec.

applied · Delivery
Contrast sensitivity, three channels, normalised to each channel's peak. Spatial frequency in cycles per degree against relative sensitivity. The luminance channel runs to 50 cycles per degree, red–green to 12 and blue–yellow to 8, each by the same criterion of 5 per cent of that channel's own peak. Only the luminance channel dips at low frequency; the two chromatic ones are low-pass, so a chromatic edge of any size at all is seen at its full contrast.

How fine a colour edge can be

The eye resolves a lightness pattern to about fifty cycles per degree and a red–green one to twelve. Every colour difference here is quoted as though a patch had no size, and the same difference is plainly visible at one scale and gone at another.

eye · Cones
Photons caught by one cone in one integration time, under D65. Each curve is one cone class, counting isomerisations during a 0.1 s integration through a pupil that closes as the light rises. At 1000 cd/m² a long-wavelength cone catches about 11522 and at 0.001 it catches 0.12 — which is where the square root of the count stops being a small correction and starts being the signal. The rate works out at 30 isomerisations per second per troland, inside the published band of 5–50.

Colour goes first in the dark

A cone reports a count, and a count carries the square root of itself as noise. Counting the photons says where colour vision stops — a chromatic difference runs out four hundred times sooner than a lightness difference of the same size — and says just as clearly that in daylight the eye is nowhere near that limit.
eye · Cones
Brightness against chroma, at exactly constant luminance. Seven stimuli of identical luminance and rising chroma at hue 25. The model's brightness moves by 2.2 per cent across the whole sweep, and at some hues it moves the other way. The Helmholtz–Kohlrausch effect — measured repeatedly, by several methods — is that a saturated colour looks as bright as a neutral of 1.3 to 2 times its luminance, shown as the band. The gap is the model's, and nothing here closes it: the term that would is not in CIECAM16 and is not invented for the occasion.

Brightness is not luminance

Photometry is additive because the CIE defined it that way. Brightness is not, and a saturated colour looks as bright as a neutral of one and a half times its luminance — an effect this site's appearance model moves by two per cent, in a direction that depends on the hue.

brain · Appearance
Temporal sensitivity, and where each channel gives out. Modulation frequency in hertz against relative sensitivity. The luminance channel is band-pass, peaking at 8 hertz and running out at 60; an isoluminant modulation is low-pass and runs out at 15, which is 4.0 times sooner. Both cutoffs are at the same criterion of 5 per cent of that channel's own peak, so the ratio between them is a ratio between two measurements rather than between two conventions.

The eye has a shutter

An isoluminant flicker fuses at fifteen hertz and a luminance one at sixty, so a light whose colour changes forty times a second is a steady light of a colour it never emits. And the frequency at which flicker stops being visible is not a property of the eye — it moves twelve and a half hertz for every decade of light.

eye · Cones
A 100 hertz drive, and whether anybody sees it. 3 cycles of a 100 hertz drive at 100 per cent modulation. The number beside each is how far above the threshold for seen flicker its loudest harmonic sits: above one and a stationary observer sees the flutter, below it and only something moving does. Fusion is at 60 Hz at 100 cd/m², and moves 12.5 Hz for every decade of light.

A lamp has a waveform

A lamp modulating a thousand times a second is a hundred times past the frequency at which flicker fuses, and it is plainly visible — as a dotted trail, during any glance across the room. The reason is not a new measurement; it is the spatial contrast sensitivity function, arriving from an unfamiliar direction.

light · Light
Grassmann's four laws, exact — and the two things that break them. For a linear observer every one of the four is exact and the residual is floating point, which is the control that makes the two failures below measurements rather than artefacts. Rods break a cone-metameric match by 23 per cent of a rod excitation at dusk; bleaching breaks it by 0.59 per cent of a cone excitation in the sun. Both are stated as fractions of a receptor's own response, so they can be put on one scale.

The laws that make colour add up

Colorimetry is an integral, and an integral assumes matching is linear. Grassmann's four laws are exact for a linear observer, to floating point — and they fail at both ends of the light range, by two different mechanisms, leaving colorimetry an operating band of three and a bit decades that no standard states.

matching · Gamut
The eye's own drift, and what it does to every spatial frequency. A pattern of f cycles per degree, drifting across the retina at 0.5 degrees a second, arrives at each receptor at f × 0.5 hertz. The curve is the temporal sensitivity at that rate, against the pattern's spatial frequency. Every frequency the eye can resolve stays above a quarter of the temporal peak, and the band of drift speeds for which that holds is 0.02–0.71 degrees a second — with the measured drift inside it. Faster and the finest detail is carried past 60 hertz, where there is no sensitivity at all.

The eye is never still

A perfectly stabilised retinal image disappears within seconds. What keeps the world there is a drift of about half a degree a second between the microsaccades — fast enough to keep the finest detail modulating and slow enough not to carry it past fusion, in a band whose upper edge is at 0.71 degrees a second.

brain · Appearance
Coming back from a bleach, against the clock already measured. A 94 per cent bleach, and the pigment returning at its own time constant of 120 seconds. The lower curve is the site's slow neural adaptation constant, 60 seconds, started from the same place — it is finished while the chemistry is barely half done. Regeneration does not speed up because the light went away: the rate constant is the same one it always was, which is why the recovery is slow while the bleaching was fast.

The slowest clock is chemical

An earlier essay here joined the afterimage to the adaptation clock and named what was still missing — a third gain, upstream of both, in the pigment itself. It is twice as slow as anything measured before it, it leaves a coloured after-tint from a white field, and at steady state it cancels exactly, which is why nobody has ever needed to model it.

eye · Cones
Three ways to dim a lamp, and only one of them is free. What an adapted observer is left with, as the same lamp is taken down to one per cent by each of the three methods. Duty-cycle dimming lies exactly on zero at every depth: it scales the spectrum, a scaling is a gain in every basis, and adaptation removes all of it. Current dimming moves the pump and the phosphor apart and leaves 0.15 at a tenth. A filament follows the Planckian locus, which is the largest chromaticity change of the three and leaves 3.63 — the ordering by chromaticity and the ordering by what a person sees are not the same ordering.

Only one dimmer is invisible

An earlier essay separated the three ways to dim a lamp by the chromaticity each arrives at. Asked instead what an adapted observer is left with, the ordering is different and one method comes out at exactly zero — a duty cycle is a scaling, a scaling is a gain in every basis, and adaptation removes all of it at every depth.

light · Light
The straight piece under the cube root, and where it stops. CIELAB's lightness against relative luminance, over the bottom 5.0 per cent of the range. Below Y = 0.008856 it is a straight line of slope 7.787; above it, a cube root. The two meet at L* 8 in value and in slope, exactly — the CIE's two constants are chosen to make that true. The dashed curve is the pure cube root, which reaches negative lightness before it reaches zero luminance and has an infinite slope there. The break is marked, and the axis runs to Y = 0.050.

The straight piece under the cube root

CIELAB's lightness is described everywhere as a cube root and below a stated luminance it is a straight line, spliced on with two constants chosen so the join is exact in value and in slope. Every black a delivery chain reaches is inside that straight piece — a press black at L* 2.4, a projected black at 1.1 — where the compression does not compress, the price of a deviation is flat to two parts in a thousand, and the second derivative the composition of two departures needs does not exist.

matching · Gamut
A stop taken in raw, and the same lightness reached afterwards. Each row is a stop of exposure applied to the raw values, against a gain applied after the whole pipeline and solved so that an eighteen per cent grey comes out at the same lightness. The two are then the same brightness by construction and differ by 4.2 colour differences at the mean and 11.1 at the worst patch. A stop is a scalar in front of the curve and is not a scalar behind it.

A stop is not a stop afterwards

Doubling the light is exactly a factor of two in raw values and in tristimulus values, which is the one thing about exposure everybody is sure of. A stop taken after the tone curve is a factor of something else, and matching the two on an eighteen per cent grey leaves the rest of the frame between three and four colour differences apart at the mean and up to eleven at the worst patch. The gain that matches one stop is 2.47 rather than 2.

imaging · Capture
Where averaging the model's answers is and is not averaging its argument. Each row takes a spread of situations, averages the model's predictions across them, and compares that against the model's prediction for the average situation. The bar is the gap as a share of the spread itself. Over the differences between observers it is 1.4 per cent — the model is very nearly linear there. Over the range of adapting luminance one room covers in a day it is 59 per cent, and from indoors to outdoors 74.

Where the model's curve does not matter

This round has been about what a nonlinearity does to an average, and CIECAM16 is the most nonlinear thing in the collection. Over the spread a population of observers produces, the average of its predictions is its prediction for the average to within 1.4 per cent — the nonlinearity is there and the excursion is too small to reach it. Over the range of adapting luminance one room covers in a day, the same gap is 59 per cent of the spread, and from indoors to outdoors 74.

brain · Appearance
What is left of one colour difference when the two colours alternate. 23 pairs built at exactly ΔE₀₀ 1.000, alternated at a rate, with each part of the difference scaled by its own temporal channel and the formula then applied unchanged. At rest every pair is the flat line at one. By 7 hertz the median is 1.11 and the pairs run from 0.57 to 3.04 — a factor of 5.3 between pairs the formula calls identical. By sixty hertz the largest of them is 0.15.

A difference has no rate

A colour difference formula answers for two patches that are both there and stay. Alternate the same two colours and the difference is not scaled but taken apart: the colour half is gone by fifteen hertz and the lightness half is four times louder at eight, so twenty-three pairs the formula calls identical run over a factor of six at the rate the eye is best at, and are worth nothing at all above sixty.

difference · Metric
How far CIECAM16 moves a monochromatic hue when the light is brightened thirtyfold. A monochromatic stimulus at a relative luminance of 2 and of 60, read through CIECAM16 in one room, and the difference between its two hue angles. The model was never fitted to this effect and has it anyway: the shift is positive at the short end, negative through the greens, positive again in the yellows and reds, and crosses zero at 459, 495, 502, 570 nanometres. The marks are the invariant wavelengths the literature reports — 474, 506, 571.

The model has a hue shift it was never given

A monochromatic light changes hue as it is brightened, except at three wavelengths that do not move — an effect measured since the nineteenth century and not among the things CIECAM16 was fitted to. The model has it anyway: brightening a stimulus thirtyfold moves its hue angle, and the places where the movement crosses zero land at 459, 495, 502 and 570 nanometres against the reported 474, 506 and 571. The sizes are another matter.

brain · Appearance
The share a finish takes falls with how much light the wall returns. Seventy-two rooms under daylight, each with a different paint on two opposite walls — six hues, four band widths, three peak reflectances — at a satin finish. Across is the wall's luminance factor, the share of the lamp's light it returns; up is the share of the room's chroma the finish takes. The losses fall with the luminance factor at a rank correlation of −0.89, from 15.5 per cent on the darkest walls to 2.5 on the palest. The two ringed paints make rooms of the same matt chroma and lose 14.7 and 2.5 per cent.

A dark wall pays for a finish

A satin finish takes about a tenth of a room's colour, and the tenth varies. The natural explanation is that a weak colour loses a larger share of itself to the white light a glossy surface adds. Over seventy-two paints under one lamp that explanation orders nothing: the loss runs from 2.5 to 15.5 per cent, it follows how much light the wall returns at a rank correlation of −0.89, and it follows how colourful the wall is at −0.04. Two rooms equally colourful matt lose shares nearly six times apart, and the one that loses more is the darker.

scene · Scene

Named alongside it

The objects these essays reach for when they reach for this one.

AdaptationLightnessStandard observerColour appearanceDisplay gamutPrimariesSpatial frequencySpecificationViewing conditionChromaCIECAM16CIELAB

All concepts