Colour by catalogue
Assumes A hex code is not a colour and Why there are four unique hues.
Before a colour could be measured it had to be pointed at. A colour order system is a set of physical samples arranged so that finding one is possible and naming it afterwards is unambiguous — a catalogue, in the plain sense, and the oldest working solution to the problem this site opens with.
The interesting part is not the samples. It is that a catalogue has to be a lattice and the thing it catalogues is not.

One of the three scales has a room in it, which is the thing a printed catalogue cannot carry.

A bright room moves it the other way, and a catalogue printed once is being read in all of these rooms at different times of day.

The widest version of the gap is at the top of the ordinary range, which is where a swatch book is most often held up to a window.

Two more levels fill in the range a catalogue is actually read at, and the gap between the fixed scales and the modelled one never closes.


What a catalogue must do
Three requirements, and they conflict.
It must be findable. A user with a sample in hand needs to reach the matching chip in a bounded number of steps, which means an ordered arrangement along axes that mean something to a person: how light, how colourful, what hue.
The steps must be perceptually even. If neighbouring chips differ by wildly different amounts, interpolating between them is meaningless and the numbering carries no information about distance.
It must be realisable in pigment. Every chip has to exist. A regular lattice extending as far as the space goes would require pigments that do not exist, and the outer edges of any real system are ragged for that reason.
The tension is between the second and the third. A system that is perceptually even runs out of pigment at different distances in different directions, so its outer boundary is irregular — and a system with a tidy boundary is not perceptually even.
Munsell: value, chroma, hue
Albert Munsell was a painter and a teacher, and the system he published in 1905 was built to be taught. Its three axes are the ones anybody would name.
Value runs 0 to 10, black to white. Chroma runs outward from the neutral axis in even steps with no fixed maximum — how far it goes depends on the hue and the value, because that is where the pigments run out. Hue runs round a circle of ten principal names in forty steps.
The construction is the important part. Munsell did not compute anything: he arranged physical chips until observers judged the steps even. The system is therefore a record of judgements rather than a derivation, and it predates any capacity to measure what he had made by nearly four decades. Evenness by arrangement is the same objective the 1976 chromaticity diagram pursued arithmetically seventy years later, and the earlier attempt was in some respects the more successful.
The 1943 renotation committee measured it. They fitted a quintic polynomial relating Munsell value to luminance, and that polynomial is the direct ancestor of L*: when CIELAB was standardised in 1976, its cube-root lightness function was chosen partly to approximate the quintic that had been fitted to what Munsell’s observers produced.
So a modern lightness scale traces back through one fitting exercise to a set of paper chips a painter arranged by eye. That is not a criticism. It is what a perceptual scale is: there is nothing else for it to be fitted to.
Three midpoints, and what their disagreement is worth
Munsell value 5, CIELAB L* 50 and CIECAM16 J 50 are three definitions of the midpoint of a lightness scale. They land at 19.8%, 18.4% and 28.0% of the white’s luminance.
Both halves of that matter.
The first two are close, and they are the pair that ought to be. Munsell value and L* are both colorimetric lightness scales describing an observer under fixed conditions, and they agree to within 7% on a quantity that has no independent definition — two exercises separated by seventy years, using different methods on different observers, landing in the same place.
They are not identical, which is what makes the closeness worth anything. If L* reproduced the quintic exactly it would be a restatement rather than independent evidence, and a check that restates its own derivation rejects nothing. The gap is small and it is not zero, and that is the shape of a genuine second measurement rather than a copy.
The CIECAM16 figure is further out, and the reason is structural: J depends on the viewing condition and the other two do not. There is no single J-50 luminance, only one for a stated room — and the surround moves it substantially, and the value plotted is for the reference condition. That is the appearance layer intruding on a colorimetric question, and it is the whole content of the distinction.
The hue circle is not a circle
The second axis is where a catalogue’s difficulty becomes measurable.
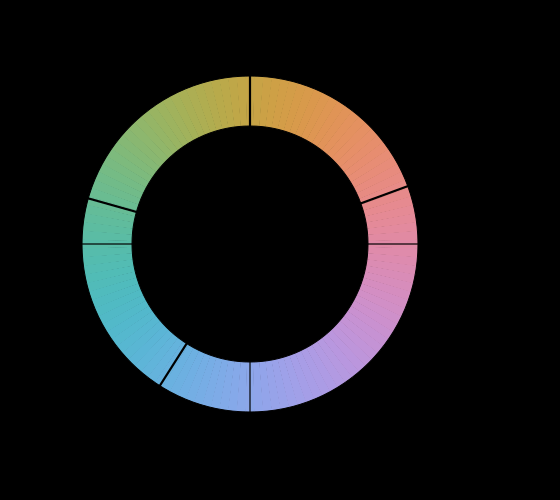
Hue is an angle, and dividing an angle into equal parts is trivial. Dividing hue into perceptually equal parts is not, because the hue circle is not perceptually uniform — the four elementary hues sit at 20°, 90°, 164° and 238°, so the gaps between them are 70°, 74°, 73° and 143°.
Step the angle into ten equal parts and the perceptual gaps range from 19.7 to 59.8 quadrature units — a factor of three. Some neighbouring pairs in an “evenly spaced” palette are three times as different as others.
Hue quadrature is the fix, and it is exactly what a colour order system is trying to achieve by hand. It maps the four anchors onto 0, 100, 200 and 300 and interpolates, so equal steps mean equal perceptual distance wherever they are taken. Munsell’s forty hue steps were an attempt at the same thing, arrived at by asking people rather than by computing.
Anything generating a palette by stepping a hue variable produces the outer ring. That covers most colour pickers, most generated categorical palettes, and most of the evenly-spaced hues in charting libraries — even in the parameter, uneven in what they look like.
Where the two lightness scales actually disagree
Comparing Munsell value with L* at their midpoints gives seven per cent, and that number is about luminance rather than about lightness. Compared in the units both scales claim to be in, they are a great deal closer.
Running the quintic across its whole range and putting each luminance through L*: value 5 lands at L* 51.57, value 6 at 61.70, value 9 at 91.08. The largest disagreement anywhere on the scale is 1.70 units of L*, at value 6, and it never reaches two.
It is also one-signed. L* sits above ten times the value at every point from 0.5 upwards — never below, never crossing — rising from 0.26 at value 0.5 to a peak of 1.70 at six and falling back to 0.99 at ten. That is a systematic difference in the shape of two fits rather than scatter, and a single hump is what a cube root fitted against a quintic over a fixed interval produces.
So the seven per cent is real and it is quoted in the currency that flatters it. At the midpoint the two scales differ by 1.35 percentage points of luminance and by 1.57 units of lightness; the first sounds like a disagreement about a colour and the second is a disagreement of a sixtieth of the scale. Which to quote depends on the question, and asking about a midpoint’s luminance asks it at the steepest place on the curve.
The endpoint carries the same lesson in the other direction. Value 10 sits at 102.57 per cent of the white’s luminance, and read the other way round, the perfect diffuser sits at Munsell value 9.90 rather than at 10. A tenth of a step is not something anybody would notice in a book of chips, and the 2.6 per cent it corresponds to in luminance is the same fact wearing the alarming version of its clothes.
What a finer palette does to the unevenness
Ten evenly spaced hue angles give quadrature gaps from 19.7 to 59.8, a factor of 3.03. The natural guess is that a finer palette evens out, since each step is smaller and a curve is locally straighter. It does the opposite.
Six steps give a spread of 2.89; eight, 2.47; ten, 3.03; twelve, 3.22; sixteen, 3.29; twenty-four, 3.61. The unevenness climbs as the palette gets finer, and settles towards the ratio between the steepest part of the quadrature curve and the flattest — which is what a ratio of local slopes does once the sampling is fine enough to resolve them.
A generated palette therefore does not average its own unevenness away by having more entries in it. Ten categorical colours are three times as uneven as they look, and twenty-four are three and a half times.
Where the crowding sits is worth reading off the ten. Their gaps run 40.2, 51.2, 59.8, 47.8, 45.5, 49.5, 32.7, 19.7, 23.9 and 29.6 quadrature units, and the last four — the steps at hue angles 216, 252, 288 and 324 — carry 105.9 units between them where the widest four carry 208.3. Four of the ten colours are packed into the 143-degree arc between blue and red, and that arc is given half the perceptual room the other four get.
That is the anchor gap named above, seen from the palette’s end rather than from the theory’s. The four elementary hues are unevenly placed around the circle, and any scheme that steps the angle inherits the unevenness at every resolution it is drawn at.
NCS: a different question entirely
The Natural Colour System, developed in Sweden and standardised in 1979, is built on a different premise and the difference is instructive.
Munsell asks how far apart colours are. NCS asks what a colour resembles. Its coordinates are percentages: how much blackness, how much chromaticness, and a hue expressed as a position between two of the four elementary colours — a colour described as Y70R is seventy per cent of the way from yellow toward red.
That is Hering’s opponent structure used directly as a coordinate system, and it descends from the four unique hues rather than from any metric. NCS makes no claim that equal steps in its coordinates are perceptually equal. It claims that its coordinates describe what a colour looks like, which is a different property and arguably the one a person naming a colour actually wants.
The trade is clean. Munsell is better for computing differences, because its axes were built to be metric. NCS is better for describing appearance, because its axes were built from the categories perception actually uses. Neither is a defective version of the other, and the field’s persistent attempts to convert between them exactly are attempts to convert between answers to different questions.
What a catalogue has that a coordinate does not
Physical samples solve a problem no numerical specification solves, and the reason returns to the first essay on this site.
A hex code identifies three numbers whose meaning depends on a space, a white point, a transfer function and a display. A Munsell chip is a piece of painted card. Hold it against a sample under a stated light and the comparison is direct: no observer model, no display, no assumption about anybody’s viewing conditions, and the answer does not depend on what software either party is running.
That is why order systems survive in soil science, dentistry, dermatology and paint retail long after digital specification became universal. The comparison is physical, the apparatus is a book, and the failure modes are the ones everybody already understands — the chips fade, the light matters, and both are visible problems rather than silent ones.
Five candelas per square metre is a dim room, and it is the lowest adapting level at which a catalogue would still be consulted.

The chip that has to exist
The third requirement is the one a computed system never faces, and it is worth dwelling on because it shapes every real order system’s geometry.
Every chip in a catalogue is a physical object made of pigment. A lattice point with no pigment that reaches it is not a gap in the book — it is a page that stops there. So a Munsell page at a given hue extends to whatever chroma the available pigments manage at that hue and value, and the boundary is different on every page.
The pattern is not arbitrary. Yellows reach high chroma only at high value, because a dark saturated yellow requires absorbing most of the light while reflecting a narrow band strongly, and no pigment does both. Blues reach their maximum chroma much darker. So the solid a real catalogue occupies is lopsided, and the lopsidedness is a fact about pigments rather than about perception.
A digital colour picker has no such boundary. It offers every coordinate in its space, produces a value for all of them, and clips the ones the display cannot reach without saying so. The catalogue’s ragged edge is an honest report of what exists; the picker’s smooth one is a report of what the software will accept.
That is arguably the deepest difference between the two ways of specifying a colour. A book of chips cannot offer a colour that does not exist. Everything else can.
What was computed here
The Munsell value function is the 1943 quintic — quoted, because it is a fit to measurements of people, which is the category this site quotes. Everything downstream is computed: its inverse by bisection, the midpoint luminances by search, the comparison against L* and J by running the same luminances through each.
The hue comparison inverts CIECAM16 at constant lightness and chroma to realise each hue as an actual stimulus, then measures the quadrature gaps. Nothing is read off a table.
Three assertions run in the gate. The three lightness scales must agree within a stated factor and must not coincide — asserted in both directions, because agreement alone would be consistent with two of them being restatements. Stepping hue quadrature evenly must give gaps equal to within arithmetic, since that is what quadrature is defined to do and a failure means the inversion is wrong. And stepping the hue angle must not, by a wide margin, because if the two were close the hue circle would already be even and the whole essay would have no subject.
The value function must also round-trip, because the essay quotes luminances for named values and reads values off luminances in the same paragraph.
The three scales are functions of an adapting luminance as well as of the light, so the honest test is to read the midpoint at the two ends of the range a room can be.

The quintic that does not reach 100
A detail worth not smoothing over: Munsell value 10 corresponds to 102.6% luminance rather than 100%.
That is not an error in the polynomial. The renotation was measured against magnesium oxide, which was the practical white standard of the period and is a slightly better diffuser than a perfect Lambertian reflector is defined to be. So the top of the scale sits a little above the theoretical white, permanently, in a formula still in use.
It is a good example of how a measurement’s apparatus survives inside its results. Anybody using the quintic today inherits a decision about a reference material made in 1943, and the inheritance is invisible unless the endpoints are checked.
Where the model stops
The largest limit is that this essay computes the structure of order systems without having their data. The Munsell renotation is a large table of measured chromaticities for every chip, and this site does not have it.
What that rules out is the most interesting figure: the actual outer boundary of a Munsell page, showing where the pigments run out at each hue and value. The raggedness of that boundary is the mismatch between lattice and space made visible, and it cannot be drawn from first principles because it is a fact about pigments rather than about perception.
Hue quadrature is also an interpolation between four measured points, and the interpolation’s form was chosen to fit rather than derived. Its claim to even spacing is exactly as good as that form — well supported near the anchors, less so in the middle of the 143° gap between blue and red, which is where there is most distance and fewest measurements.
At three thousand candelas per square metre the adapting field is brighter than any print is ever seen under, which brackets the whole range from the other side.

What the pictures cannot show
Every colour order system is a set of physical samples, and the one thing this page cannot do is show one.
A Munsell chip has a surface. It is matte, it has a texture, it reflects the room, and comparing it against a sample involves tilting both until the specular highlights are gone — a manipulation that is half the skill of using the system. A swatch on a screen is emissive, flat, and has none of that.
The hue rings in the figures here are also, necessarily, drawn at a chroma the display can mostly reach, with the rest hatched. A real Munsell page at high chroma extends past what any display can show, which is the same limitation as everywhere else on this site and bites harder here: the parts of the catalogue that are most interesting are the parts furthest out.
Who found it, and when
Munsell published A Color Notation in 1905 and the Atlas in 1915. He was teaching art to children and wanted a vocabulary less useless than the colour names available, which is a more practical origin than most foundational work in this field has.
The 1943 renotation, led by Newhall, Nickerson and Judd, measured the existing chips and produced both the value quintic and a corrected set of chromaticities. It is one of the more thorough measurement exercises in the subject’s history and the reason Munsell notation can be converted to CIE coordinates at all.
The Natural Colour System was developed at the Scandinavian Colour Institute through the 1960s and 70s, from Hering’s opponent theory rather than from metric considerations, and became a Swedish standard in 1979.
Ostwald’s system, published in the 1910s, is the interesting failure. It was built on a mixing model — colours as mixtures of a full colour with white and black — which is elegant, computable, and does not correspond to how the samples look. It was widely adopted, and abandoned, and the reason it lost to Munsell is precisely that Munsell’s axes were fitted to judgements while Ostwald’s were fitted to a theory.
Where this goes next
The problem a catalogue exists to solve is a hex code is not a colour. The elementary hues both systems are organised around are why there are four unique hues. And the modern form of the same question — how close two colours have to be to count as the same — is a tolerance is a shape.
Where this goes next
 A hex code is not a colour
Six hexadecimal digits identify three numbers. Turning three numbers into a colour needs a colour space, a transfer function, a white point and a display, and leaving any of them unstated is the everyday version of every confusion in colour management.
A hex code is not a colour
Six hexadecimal digits identify three numbers. Turning three numbers into a colour needs a colour space, a transfer function, a white point and a display, and leaving any of them unstated is the everyday version of every confusion in colour management.
 Why there are four unique hues
Observers agree that four hues are elementary and that no colour is reddish green. Nothing in the three receptors predicts either fact, and the axes of every standard colour space miss the four by tens of degrees.
Why there are four unique hues
Observers agree that four hues are elementary and that no colour is reddish green. Nothing in the three receptors predicts either fact, and the axes of every standard colour space miss the four by tens of degrees.
 A tolerance is a shape
A total colour difference below one, or every component within one — the two sound like the same requirement stated twice. They are different shapes, they disagree about most of what either accepts, and which one a supplier is held to is worth money.
A tolerance is a shape
A total colour difference below one, or every component within one — the two sound like the same requirement stated twice. They are different shapes, they disagree about most of what either accepts, and which one a supplier is held to is worth money.
What this makes readable
Essays that name this one as a prerequisite.
Named alongside this one
Essays reaching for the same objects. Nobody chose these; they are what the index of named objects makes visible.
- A contrast control is three controls cielab · hue quadrature · lightness
- A name in the model's own words cielab · colour order systems · naming
- A name moves with the room cielab · colour order systems · naming
- The midpoint is not half cielab · lightness · luminance
- A dark wall pays for a finish lightness · luminance
- A deviation is not a difference cielab · lightness
What links here
Every essay whose body links to this one.
The objects this essay names
Each one links to every other essay that touches it.
CIELABColour order systemsHue quadratureLightnessLightness scaleLuminanceThe Munsell systemNamingThe Natural Colour System