Concept

Perceptual uniformity — where it appears

The property a space would have if equal coordinate steps looked equally different, which no space in use quite has. Measured against MacAdam's ellipses the best spaces in use are uneven by a factor of several across the diagram, which is a bound on what any single tolerance can mean.

Named by 29 essays across 4 fields — each of them below, with the objects they name alongside it.

MacAdam's discrimination ellipses, drawn 10 times actual size. Twenty-five ellipses of colours indistinguishable from their centres. They are drawn at 10× because at true scale most are thinner than a line. Their areas vary by a factor of 74, which is the whole result: a step of the same size in xy means very different things in different places.

MacAdam measured it

In a perceptually uniform space the just-noticeable-difference contours would be circles of equal size. MacAdam's ellipses are neither, by a factor of eighty — and transforming them into each candidate space settles which spaces improved matters and by how much.

difference · Metric
The sRGB transfer function, and the gamma 2.2 curve it is not. Code value against relative luminance. The sRGB function is piecewise — a short linear segment near black, then a 2.4 power law with an offset — and it is close to but not the same as a plain 2.2 power law. Half-way along the axis of stored values sits at 21 per cent luminance, and half the luminance of white is at code 188.

The midpoint is not half

Code 128 sits halfway along the sRGB scale and carries about a fifth of white's luminance. Half the luminance is code 188. Almost every gradient, blur and resize on the web gets this wrong, and the errors are visible once known.

difference · Metric
Distinguishable colours in sRGB, counted under two difference formulae. The gamut volume divided by the volume of a ΔE = 1 ellipsoid, integrated over the solid because that ellipsoid changes size and orientation from place to place. Under the 1976 formula the answer is 195,720; under ΔE2000 it is 41,819 — 4.68 times fewer, from the same solid and the same lattice. Both assume perfect packing, which nothing achieves, so each is an upper bound rather than a count of anything. The gap between them is the result: "how many colours are there" is a question about a metric before it is a question about vision.

How many colours are there

Sixteen point seven million counts code values in a file format. Ten million distinguishable colours is a volume divided by the size of a just-noticeable difference — and the two difference formulae this site implements disagree about that size by a factor of nearly five.

difference · Metric
The ΔE = 1 contour at points across the L* = 55 plane, magnified 14×. Each closed curve is the set of colours exactly one unit of difference from the dot at its centre, traced by bisection along 30 directions and drawn 14 times life size. Under ΔE2000 the contours run from 0.68 to 5.07 CIELAB units across this slice — a ratio of 7.44 — and they are not circles and not aligned with each other. A formula whose contours were circles of one radius everywhere would be claiming that CIELAB is uniform, which is what the 1976 formula claims and what the measurements refuse.

Where the formula is not smooth

A colour difference formula is a distance, and a distance ought to vary gently. CIEDE2000's does not everywhere — it carries a hue-rotation term with a hard edge in it, and the discontinuity sits where a great many industrial samples live.
difference · Metric
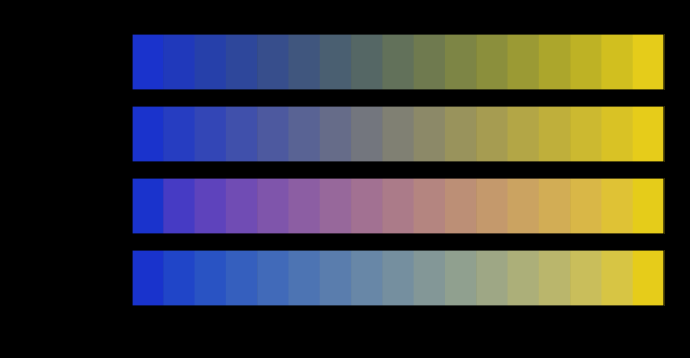
One pair of colours, blended in four spaces. Every row starts and ends at the same two colours and visits different ones in between. The chroma of the middle falls furthest in linear light, by 83 units below the straight line between the endpoints' chromas — the grey dead zone that every blue-to-yellow gradient has and that no endpoint mentions. Any colour a route visits that this display cannot show is hatched rather than clipped.

A gradient is a path

Two colours fix the ends of a blend and nothing else. The middle is decided by the space the interpolation happens in, and four spaces in daily use put the halfway point of one ordinary gradient as much as thirty-seven units of colour difference apart.
matching · Gamut
The worst triple found, under ΔE2000. Three colours, plotted on the a–b plane of CIELAB. Going from a to c directly is 123.645; going via b is 60.528, which is 51.0 per cent shorter. A distance cannot behave that way, and this one is the formula every colour tolerance in industry is written in. The colours are far apart, which is where the violation is largest; the same search confined to tolerance scale finds a smaller one that has not gone away.

A difference is not a distance

Two earlier essays here said that CIEDE2000 violates the triangle inequality and left it at that. Searching for the violation finds a detour half the length of the direct route, a smaller one inside a five-unit ball, and a second defect nobody mentions — ΔE94 is not even symmetric.

difference · Metric
How often two colour-difference formulae disagree about which pair is worse. Pairs of colours sampled in CIELAB, compared two at a time. A rank inversion is a case where one formula calls pair A worse and the other calls pair B worse; no monotone rescaling of either can remove one. The left bar of each group is the rate over the whole space and the right bar is the rate among pairs sitting near a tolerance of ΔE 1, where the decision is actually made — and it is between 35 and 44 per cent, against a coin flip at fifty.

Which of two is worse

Two colour-difference formulae disagree about which of two pairs is the larger difference in thirteen per cent of comparisons overall — and in forty-three per cent of comparisons among pairs sitting near a tolerance of one unit, which is where every acceptance decision is actually made.
difference · Metric
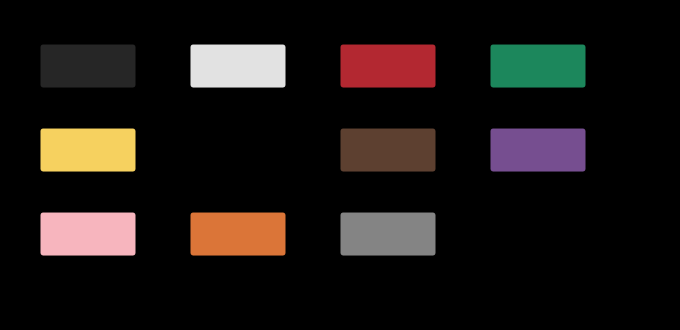
The eleven basic colour terms, at their quoted centroids. Each patch is the CIELAB centroid quoted for that term, converted to a stimulus and drawn — except blue, whose focal colour is outside the sRGB gamut and is therefore hatched rather than clipped, which is the rule for an unreachable colour everywhere else and applies here too. The centroids are rounded to 5 units in each coordinate, and moving them by that much either way leaves the same term outside.

A colour has a name

Every quantity here is a number, and the question a reader arrives with is what colour something is called. The eleven basic terms of English divide the space into territories that differ by a factor of five, the metric accounts for fifteen per cent of that, and one of the eleven focal colours cannot be shown on this page at all.

brain · Appearance
How large a step changes the name, across the ab plane at L* 60. At each point, the smallest ΔE00 step in any direction after which the probability of two people using the same word has halved. It runs from 4.8 to 33.8 units across this one plane, in eight quantised levels: the palest cells are where a name is finest — a short step changes it — and the strongest are the middles of large territories, where a colour can move twenty units and keep its word. The ragged edge is the sRGB boundary at this lightness rather than a property of the vocabulary. The boundary softness is a stated parameter of the model, and the map barely moves when it is changed fourfold, because what sets this quantity is how far apart the centroids are.

A name is not a threshold

Two colours have to move about ten times a just-noticeable difference apart before people stop calling them the same thing, and how far varies threefold across one plane of the space. A tolerance and a word are answering different questions, and nothing in colorimetry converts between them.

brain · Appearance
A colour-order system's chips, sorted by what they would be called. A regular lattice in lightness, chroma and hue — the idealisation of a swatch book, and regular by construction because a person has to be able to find a page. Named, it comes apart: 1320 chips inside the gamut divide into 198 for grey and 66 for blue. And 22 per cent of one-step moves in the lattice change the name, so a page of a swatch book is not a page of a vocabulary.

A catalogue is not a vocabulary

A colour order system is a regular lattice, because a person has to be able to find a page. Sorted by what its chips would be called, that lattice comes apart into piles differing by a factor of three — and a fifth of all one-step moves in it change the name.

matching · Gamut
The three constants a specification does not quote. ΔE2000 is defined with three parametric factors in it — kL, kC and kH — which the CIE leaves to the industry using the formula rather than fixing. Graphic arts uses ones throughout; the textile standard weighs lightness at half, which is kL = 2. Applied to 4000 pairs at a tolerance of 1, the two settings accept 46 and 75 per cent, and 29 per cent of pairs change verdict — a larger disagreement than any between the formulae themselves. The reference conditions the ones assume are diffuse illumination at 1000 lux, a mid-grey surround, samples abutting, subtending over four degrees, differing by under five units, with no visible texture.

Three constants nobody quotes

CIEDE2000 is defined with three parametric factors in it, the CIE leaves them to the industry using the formula, and the two settings in ordinary use differ by a factor of two in one of them. Twenty-nine per cent of acceptance decisions change between the two — a larger disagreement than any between the formulae themselves.
difference · Metric
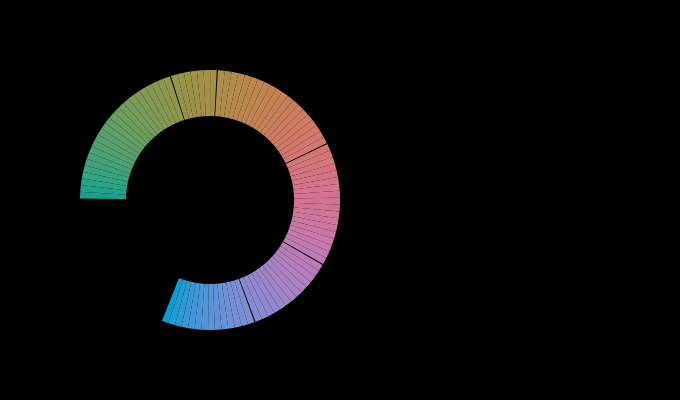
The hue circle cut into names, at L 60 and C 40. Left, the arcs each name claims, drawn at the colour of their midpoints; right, the same arcs measured in ΔE00 by integrating the difference along the ring rather than in degrees. The widest is 5.3 times the narrowest in degrees and 4.5 times in colour difference, so the metric accounts for 15 per cent of the inequality and no more. Only the eight chromatic terms compete on this ring: at this chroma the achromatic three would otherwise take the region where no basic English term sits, which is a defect of the model and is named in the essay.

There is no word for that colour

The naming model built this phase gives a saturated cyan the name green, calls part of a chromatic ring grey, and puts one of the eleven focal colours outside what a display can show. Each failure is a measurement rather than a disclaimer, and together they say what a vocabulary is that eleven points and a distance are not.

limits · Limits
How much of what a display can show each name owns. Every point on a 5-unit CIELAB lattice inside the sRGB gamut is given to its nearest centroid under ΔE00, and the shares counted. They run from 21.1 per cent for purple to 4.6 for blue, a factor of 4.6. The three terms that carry no chroma at all — black, grey and white — hold 20 per cent between them. A share here is a statement about the names and about the gamut they are counted over, and the gamut is sRGB.

A name in the model's own words

The eleven basic colour terms move when the room does, and the obvious objection is that they were being measured in a space with no room in it. Quoting them in an appearance model's own coordinates instead does not shrink the renaming — it grows it by four per cent — and the space alone renames an eighth of the gamut with the room held still.

brain · Appearance
MacAdam's ellipses, drawn on one diagram. The twenty-five measured discrimination ellipses at 10× actual size, on CIE xy (1931). Mean axis ratio 2.95 — one would mean every contour is a circle — and a size spread of 10.42 between the largest and the smallest. Both numbers depend on the plane, which is why the 1976 revision existed; neither can be taken to one, which is why the revision did not finish the job.

No diagram makes them circles

Every chromaticity diagram is a projective picture of the same measurement, so how badly MacAdam's ellipses fail to be circles can be minimised over the whole family of them. The best plane there is still leaves the average ellipse twice as long as it is wide — which makes the residual a fact about the eye rather than about anybody's choice of primaries.

difference · Metric
The same formula, applied after six different changes of basis. CIELAB's arithmetic — divide by a white, take a cube root, difference the results — run on six of the bases the matching data leave free. A linear change of basis leaves every match alone; a cube root does not commute with one, so the space, and therefore every colour difference computed in it, depends on which basis was in place before the nonlinearity. CIELAB's own choice gives an axis ratio of 3.44 and the best row here is LMS (confusion points) at 2.60.

A difference needs a basis too

A linear change of coordinates leaves every colour match exactly where it was. A cube root does not commute with one — so a lightness–chroma space, and every colour difference computed in it, is a property of the basis that happened to be in place before the nonlinearity. CIELAB's basis was chosen in 1931 for reasons that had nothing to do with difference.

difference · Metric
Every basis against both objectives at once. A scatter with the mean adaptation residual across the illumination census on the horizontal axis and the mean axis ratio of MacAdam's ellipses in a lightness–chroma space on the vertical. Lower is better on both. The two winners sit at the two ends of an empty diagonal: the basis that adapts best leaves 7.70 on the vertical and the basis that discriminates best leaves 1.79 on the horizontal, each worse on the other objective than every published transform. The basis built from the dichromat confusion points is at (1.65, 2.60) — best at neither and within a factor of two of both floors, which no other entry in the picture manages.

No basis is good at both

The same nine numbers decide how well a von Kries gain reproduces a change of light and how nearly a lightness–chroma space makes the discrimination ellipses circles. Minimise either one and the other collapses. The basis built from the receptors is best at neither and is the only entry in the table respectable at both.

brain · Appearance
How far from circles every basis leaves the ellipses. Eight bases ranked on the mean ratio of the long to the short axis of MacAdam's twenty-five discrimination ellipses, measured in a lightness–chroma space built on that basis. The range runs from 1.61 for best for discrimination to 7.70 for best for adaptation. The ordering is not the ordering on the other objective and is nearly its reverse.

One matrix doing two jobs

CIECAM16 adapts in CAT16 and then applies its response compression in the same axes, so a single matrix decides both how well the model handles a change of light and how uniform the space it produces is. The two jobs have different best answers, and the matrix was chosen against only one of them.

brain · Appearance
Five answers to how far the ellipses are from circles. Five mean axis ratios on the same twenty-five measured ellipses, measured the same way in every row: the boundary points carried through, the longest radius over the shortest, averaged. What differs is which class of map is allowed. The first two rows are chromaticity diagrams, which divide by a sum; CIE xy as printed leaves 2.95 and the best diagram there is leaves 2.02. The last three are lightness–chroma spaces, which divide by a white point; CIELAB as specified leaves 3.44, the best space with no compression leaves 2.33, and the best space with a cube root in it leaves 1.61. Neither family contains the other, and only the last one gets below two.

A compression goes below the floor

Elsewhere this collection minimised the anisotropy of MacAdam's ellipses over every chromaticity diagram there is, found 2.02, and called the residual a property of the eye. It is a property of the eye seen through a projective picture. A cube root after the right basis reaches 1.61 on the same twenty-five ellipses.

difference · Metric
The floor as a function of the exponent, and the fixed basis beside it. Two curves against the compression exponent on a logarithmic axis from 1 to 10. The lower curve is the best mean ellipse axis ratio any basis can reach with that exponent applied after it, and it falls from 2.33 at no compression to 1.66 at a square root and 1.61 at a cube root, then hardly moves — 1.57 at a tenth root. The upper curve is CIELAB's own basis at the same exponents and gets steadily worse, from 3.57 to 3.77. Almost everything a compression buys arrives with the first step away from linearity, and after that the exponent is choosing between 1.66 and 1.61 while the basis is choosing between 1.61 and 3.44.

The exponent was never the argument

A century of colour science has argued about whether the eye's response is a cube root, a square root or a logarithm. Minimise the anisotropy of MacAdam's ellipses over every basis, at each of eight exponents, and the floor moves by under three per cent between a cube root and a tenth root — while the basis moves it by a factor of two.

difference · Metric
A departure against how far the sample sits from the light. The sample is mixed with a flat reflectance, from the flat one at the left to its own at the right, and two observers differing in the macular pigment look at each mixture. The straight line is the distance between their relative cone excitations, and it is straight to 0.0 per cent: the departure is a pairing, and scaling one factor scales the product. The curved line is the same sequence in ΔE₀₀, which is not a linear function of the excitations and cannot be — it has cube roots in it and a chroma weighting underneath. The identity is about the eye; the curvature belongs to the unit.

A departure is straight in the excitations

Walk a sample a quarter of the way from the light towards its own reflectance and exactly a quarter of the observer disagreement remains — in cone excitations, to two parts in a hundred. In ΔE₀₀ the same quarter leaves 0.347 where proportionality wants 0.428, and the discrepancy belongs entirely to the unit.

difference · Metric
Four mixtures of display primaries, bowing by different amounts in two units. The half-and-half mixture of each pair of sRGB primaries, measured from the midpoint of the two readings as a share of the pair's own separation. The upper bar is ΔE₀₀ and the lower is the appearance model's J′a′b′. In ΔE₀₀ green and blue bows most, at 25 per cent; in the model it is red and blue, at 20, and blue and yellow falls from 22 to 12. The right-hand column gives the model's distance with its power correction, which is smaller than the Euclidean one for every pair here.

Which mixture bows most depends on the ruler

The physical half-and-half mixture of two lights misses the midpoint of their two readings in any unit a person is shown, and the share it misses by is about the same in ΔE₀₀ and in the appearance model's own space — 12.8 and 14.6 per cent at the median. Which mixtures miss most is not. The rank correlation between the two units is 0.57, a display's blue and yellow is the worst pair in one and the mildest in the other, and the smaller number usually quoted for the appearance model is its power correction rather than a straighter line.

matching · Gamut
The length of one grey ramp, cut into more and more steps. A neutral ramp from L 1 to L 100 cut into between one and ten thousand equal steps, each step measured and the steps added, in four units, both axes logarithmic. ΔE*ab and the model's Euclidean J′a′b′ give the same length at every step count, 99 and 96. ΔE₀₀ settles at 74.6 once the steps are small. The power-corrected ΔE′ does not settle: 25 in one step, 137 in a hundred, 755 in ten thousand, growing as the number of steps to the power 0.37.

A distance raised to a power has no length

CAM16-UCS's colour difference is its Euclidean distance raised to the power 0.63 and multiplied by 1.41. That is still a metric — the triangle inequality holds on every one of four thousand random triples — and it has no length. A grey ramp from black to white measures 25 units in one step, 137 in a hundred and 755 in ten thousand, growing as the number of steps to the power 0.37, and halving the size of a step triples the number of steps that fit.
difference · Metric
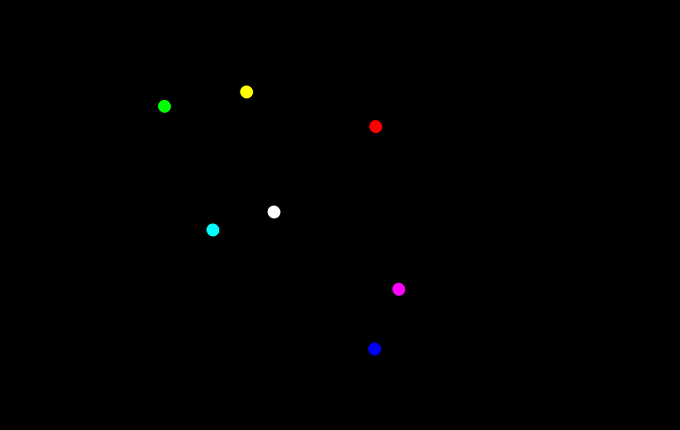
The straight line between two colours, and the formula's own shortest path. Five gradients seen from above, in the a and b plane of CIELAB: the straight line between the two colours in grey, and the shortest path under ΔE₀₀'s own local metric in colour. The lightness coordinate bows too and is not drawn. red to green saves 3.6 per cent and leaves the straight line by 13; blue to yellow saves 7.5 per cent and leaves the straight line by 21; cyan to magenta saves 3.9 per cent and leaves the straight line by 10; black to white saves 0.0 per cent and leaves the straight line by 0; red to blue saves 0.3 per cent and leaves the straight line by 4 CIELAB units at the widest. Black to white is the flat case: its shortest path is the straight one.

The straight line is not the shortest gradient

A colour difference formula says what a small step costs at every colour, and that is enough to ask which path between two colours is shortest. It is not the straight line: between red and green the shortest path bows thirteen CIELAB units away, saves four per cent — and stays inside sRGB on every step where the straight line leaves it. The formula's own answer for the two endpoints, meanwhile, is neither length.

matching · Gamut
Two uniform spaces, two answers: cyan to magenta. The gradient from above, in the a and b plane. The grey line is the straight path in CIELAB; the two coloured curves are the shortest paths under ΔE₀₀'s own local metric and under CAM16-UCS's. They are 15.7 CIELAB units apart at their furthest, against bows from the straight line of 9.9 and 12.2. Both spaces are published as uniform and both are used to decide what lies between two colours; they do not agree.

Two uniform spaces disagree about between

ΔE₀₀'s own local behaviour says which colours lie between two colours, and so does CAM16-UCS's. They do not agree. On cyan to magenta the two shortest paths run fifteen CIELAB units apart — more than either runs from the straight line — and on that gradient ΔE₀₀ would rather have the straight line than CAM16-UCS's answer. Getting the comparison at all takes noticing that one of the two has no local metric: its published difference is a Euclidean distance raised to the power 0.63, and a power below one has an infinite derivative at zero.

matching · Gamut
What a gamut charges a gradient, against what the relaxation's noise is. For each gradient, how much longer the best path that stays inside sRGB is than the free shortest path, as a percentage of the free one. The shaded band is the relaxation's own noise, measured by relaxing the same free path from two different starting points: 0.42 per cent at its worst. Every excess is inside it. So holding a gradient inside a display's gamut costs nothing measurable in the metric's own units, on any of these pairs — including the ones whose free path is outside at most of its points.

A gamut charges a gradient nothing

On red to green the shortest path happened to stay inside sRGB where the straight line did not, and that was called a coincidence of mechanism. Made into a measurement it is not a coincidence: constraining a path to stay inside the gamut costs less of the metric's own length than the relaxation's own noise, on every gradient tested — including the ones whose free shortest path is outside at fifteen of its twenty-one steps. The gamut's boundary and the metric's cheap region point the same way, and the price of the constraint is nothing.

matching · Gamut
Twenty-three pairs at one ΔE₀₀, read in two units that know the light level. Twenty-three pairs of surface colours, each exactly one ΔE₀₀ apart, on a display whose white runs from 1.5 to 10,000 cd/m² across, with a background at a fifth of the white. ΔE₀₀ has no argument for the light and stays at one. The median ΔEITP rises from 1.01 to 2.75 and flattens near the top, and the median CAM16-UCS distance from 0.76 to 1.20.

Two units with a light level disagree about lightness

ΔE₀₀ has no argument for how bright a display is. Two colour differences do: CAM16-UCS takes the room's adapting luminance, and ΔEITP — the difference defined for high-dynamic-range television — takes the stimulus's own absolute luminance. Twenty-three pairs at exactly one ΔE₀₀ grow in both as the display brightens, 2.1 times in ΔEITP and 1.5 in CAM16-UCS from a 5 to a 5,000 cd/m² white. But in ΔEITP the lightness part grows fastest, 2.7 times, and in CAM16-UCS it does not grow at all.

difference · Metric
Three uniform spaces, three answers: red to blue. The gradient from above, in the a and b plane: CIELAB's straight line, and the shortest paths under ΔE₀₀'s local metric, under CAM16-UCS's and under Oklab's, whose shortest path is its own straight line carried back into CIELAB. They bow from CIELAB's line by 14.4, 42.5 and 42.6 units. ΔE₀₀'s and CAM16-UCS's paths run 28.3 apart at their furthest, Oklab's runs 29.0 from ΔE₀₀'s and 5.6 from CAM16-UCS's, and the space furthest from the other two here is ΔE₀₀.

A third space breaks the tie only once

ΔE₀₀ and CAM16-UCS disagree about which colours lie between two colours. Oklab was the obvious tie-breaker, and it breaks the tie on one gradient of five: on red to blue its path runs within six CIELAB units of CAM16-UCS's and twenty-nine from ΔE₀₀'s. On red to green and cyan to magenta it keeps to CIELAB's straight line while both others bow, and on blue to yellow it bows further than either. Each of the three spaces is the odd one out somewhere. Asking also exposed a CAM16-UCS path that had never converged.

matching · Gamut
How each unit balances lightness against chroma, as a display brightens. Twelve pairs built to differ in lightness alone and twelve built to differ in chroma alone, each at exactly one ΔE₀₀, read in both units at nine display levels. Up is the median lightness pair's reading divided by the median chroma pair's, so a falling curve means chroma differences becoming relatively more visible. Both fall. ΔEITP's median runs from 0.91 at a 1.5-candela white to 0.81 at 10,000, a fall of 11 per cent; CAM16-UCS's from 1.13 to 0.87, a fall of 23 per cent. Neither turns: both units say chroma differences gain on lightness differences as a display brightens, and CAM16-UCS says it twice as strongly.

The units part by hue, not by light level

Two colour differences with a light level in them were compared on a display running from 5 to 5,000 cd/m², and a prediction was drawn from how each divided a difference between lightness and chroma. Built into pairs that differ in lightness alone and in chroma alone, both units say the same thing about light level: as a display brightens, chroma differences gain on lightness differences — ΔEITP by a tenth, CAM16-UCS by a quarter. Where they part is hue. The appearance model moves every colour's balance by the same factor; ΔEITP moves the violets, reds and cyan-blues the other way, and at nine of twelve base colours the two units disagree about the direction.

difference · Metric
The appearance model's lightness-to-chroma balance, as the room takes a share of the adaptation. The median lightness pair's reading over the median chroma pair's, for twelve base colours, against the display's white, in a room of 20 cd/m². Solid: CAM16-UCS, with the viewer taking all, three quarters, half, a quarter and none of the adaptation from the display — darker lines take more from the display. Dashed: ΔEITP, which no room enters. With the display alone the model's balance falls 23 per cent; with half from the room, 13; with none from the display it does not move.

A lit room brings the units' medians together

As a display brightens, CAM16-UCS says chroma differences gain a quarter on lightness differences and ΔEITP says a tenth. All of the appearance model's movement comes from what the viewer is adapted to, and every calculation had the viewer adapted to the display alone. Give the room its share of the adaptation and the model's movement shrinks at every step: with a 20 cd/m² room supplying two thirds of it, the two units' medians fall by the same amount. What does not shrink is their disagreement about direction. The model still moves every colour the same way, ΔEITP still moves violets, reds and cyan-blues the other way, and in a lit room that becomes the whole of what separates them.

difference · Metric

Named alongside it

The objects these essays reach for when they reach for this one.

CIELABCIEDE2000ΔESpecificationMacAdam's ellipsesToleranceJust-noticeable differenceChromaColour differenceGamutGradientLightness

All concepts