Concept

MacAdam's ellipses — where it appears

The measured regions around a colour within which an observer cannot tell a difference, mapped in 1942. They are ellipses rather than circles and vary in size by an order of magnitude across the diagram, which is the measurement every uniform space is judged against.

Named by 24 essays across 5 fields — each of them below, with the objects they name alongside it.

Three colour-difference formulae, disagreeing. ΔE76, ΔE94 and ΔE2000 for the same 9 pairs of colours. The largest disagreement between ΔE76 and ΔE2000 here is 26.6 units — larger than the threshold usually quoted for a just-noticeable difference, so the choice of formula can decide whether two colours count as matching.

How far apart are two colours

ΔE is meant to be a distance with the property that the same number means the same perceived difference everywhere. Three successive formulae have tried, they disagree with each other by more than a just-noticeable difference, and the disagreement decides real matching questions.

difference · Metric
MacAdam's discrimination ellipses, drawn 10 times actual size. Twenty-five ellipses of colours indistinguishable from their centres. They are drawn at 10× because at true scale most are thinner than a line. Their areas vary by a factor of 74, which is the whole result: a step of the same size in xy means very different things in different places.

MacAdam measured it

In a perceptually uniform space the just-noticeable-difference contours would be circles of equal size. MacAdam's ellipses are neither, by a factor of eighty — and transforming them into each candidate space settles which spaces improved matters and by how much.

difference · Metric
Threshold and suprathreshold contours, normalised to the same size. At five of MacAdam's centres: the measured just-noticeable-difference ellipse in grey and the ΔE2000 = 1 contour in gold, each scaled to the same mean radius so that only shape and orientation are being compared. A scale change preserves orientation exactly, so any rotation between the pair settles the question. They differ by 24° on average and by 70° at worst, and the ratio between their sizes varies 4.8-fold across the diagram — so no single factor turns one into the other.

A threshold is not a unit

MacAdam measured the smallest difference anyone could detect. ΔE2000 was fitted to how far apart plainly different colours look. The two are quoted interchangeably, and the contours they produce are not even the same shape.
difference · Metric
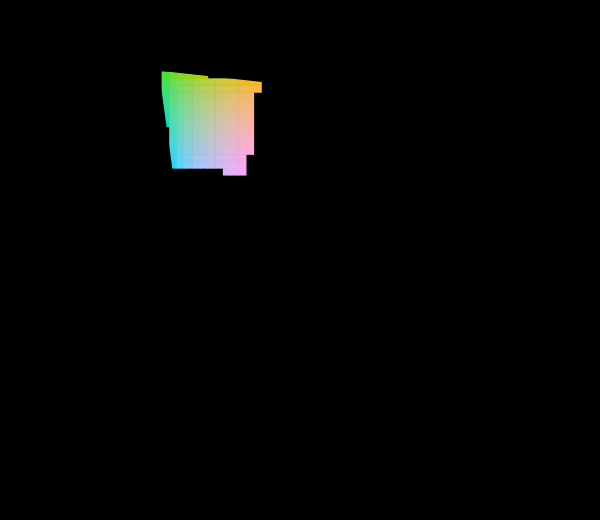
The 1976 uniform chromaticity diagram, with the unreachable region marked. The u′v′ diagram: the same spectral locus and the same sRGB primaries as the 1931 picture, projectively transformed. Straight lines stay straight, so mixtures and the gamut triangle survive; what changes is the distribution of area, and the green region that dominates the 1931 diagram is much reduced. 8% of the cells sampled inside the locus are reachable at Y = 0.55; the rest are hatched.

The diagram was replaced in 1976

The CIE knew the 1931 diagram was badly distorted and published a better one. Half a century later almost every chromaticity plot in print is still the old one, and both are still printed filled edge to edge with colours no display can show.

matching · Gamut
Distinguishable colours in sRGB, counted under two difference formulae. The gamut volume divided by the volume of a ΔE = 1 ellipsoid, integrated over the solid because that ellipsoid changes size and orientation from place to place. Under the 1976 formula the answer is 195,720; under ΔE2000 it is 41,819 — 4.68 times fewer, from the same solid and the same lattice. Both assume perfect packing, which nothing achieves, so each is an upper bound rather than a count of anything. The gap between them is the result: "how many colours are there" is a question about a metric before it is a question about vision.

How many colours are there

Sixteen point seven million counts code values in a file format. Ten million distinguishable colours is a volume divided by the size of a just-noticeable difference — and the two difference formulae this site implements disagree about that size by a factor of nearly five.

difference · Metric
The ΔE = 1 contour at points across the L* = 55 plane, magnified 14×. Each closed curve is the set of colours exactly one unit of difference from the dot at its centre, traced by bisection along 30 directions and drawn 14 times life size. Under ΔE2000 the contours run from 0.68 to 5.07 CIELAB units across this slice — a ratio of 7.44 — and they are not circles and not aligned with each other. A formula whose contours were circles of one radius everywhere would be claiming that CIELAB is uniform, which is what the 1976 formula claims and what the measurements refuse.

Where the formula is not smooth

A colour difference formula is a distance, and a distance ought to vary gently. CIEDE2000's does not everywhere — it carries a hue-rotation term with a hard edge in it, and the discontinuity sits where a great many industrial samples live.

difference · Metric
Colour temperature, and the number nobody quotes beside it. The Planckian locus in the 1960 UCS diagram — the only diagram on which correlated colour temperature is well defined — with four sources and the perpendicular from each to its nearest point. The temperature is where the foot of the perpendicular lands; Duv is how long the perpendicular is. halophosphate sits 0.0246 off the locus at 4513 K, which is a visible green cast that its colour temperature does not mention.

White is a region

A lamp is not sold as a chromaticity. It is sold as 4000 K, and what that means is that its chromaticity fell inside a quadrangle — which two lamps can occupy at opposite corners, eleven ΔE00 apart. In a room with either of them, the same twelve surfaces differ by one unit.

light · Light
How often two colour-difference formulae disagree about which pair is worse. Pairs of colours sampled in CIELAB, compared two at a time. A rank inversion is a case where one formula calls pair A worse and the other calls pair B worse; no monotone rescaling of either can remove one. The left bar of each group is the rate over the whole space and the right bar is the rate among pairs sitting near a tolerance of ΔE 1, where the decision is actually made — and it is between 35 and 44 per cent, against a coin flip at fifty.

Which of two is worse

Two colour-difference formulae disagree about which of two pairs is the larger difference in thirteen per cent of comparisons overall — and in forty-three per cent of comparisons among pairs sitting near a tolerance of one unit, which is where every acceptance decision is actually made.

difference · Metric
MacAdam's ellipses, drawn on one diagram. The twenty-five measured discrimination ellipses at 10× actual size, on CIE xy (1931). Mean axis ratio 2.95 — one would mean every contour is a circle — and a size spread of 10.42 between the largest and the smallest. Both numbers depend on the plane, which is why the 1976 revision existed; neither can be taken to one, which is why the revision did not finish the job.

No diagram makes them circles

Every chromaticity diagram is a projective picture of the same measurement, so how badly MacAdam's ellipses fail to be circles can be minimised over the whole family of them. The best plane there is still leaves the average ellipse twice as long as it is wide — which makes the residual a fact about the eye rather than about anybody's choice of primaries.

difference · Metric
The same formula, applied after six different changes of basis. CIELAB's arithmetic — divide by a white, take a cube root, difference the results — run on six of the bases the matching data leave free. A linear change of basis leaves every match alone; a cube root does not commute with one, so the space, and therefore every colour difference computed in it, depends on which basis was in place before the nonlinearity. CIELAB's own choice gives an axis ratio of 3.44 and the best row here is LMS (confusion points) at 2.60.

A difference needs a basis too

A linear change of coordinates leaves every colour match exactly where it was. A cube root does not commute with one — so a lightness–chroma space, and every colour difference computed in it, is a property of the basis that happened to be in place before the nonlinearity. CIELAB's basis was chosen in 1931 for reasons that had nothing to do with difference.

difference · Metric
Every basis against both objectives at once. A scatter with the mean adaptation residual across the illumination census on the horizontal axis and the mean axis ratio of MacAdam's ellipses in a lightness–chroma space on the vertical. Lower is better on both. The two winners sit at the two ends of an empty diagonal: the basis that adapts best leaves 7.70 on the vertical and the basis that discriminates best leaves 1.79 on the horizontal, each worse on the other objective than every published transform. The basis built from the dichromat confusion points is at (1.65, 2.60) — best at neither and within a factor of two of both floors, which no other entry in the picture manages.

No basis is good at both

The same nine numbers decide how well a von Kries gain reproduces a change of light and how nearly a lightness–chroma space makes the discrimination ellipses circles. Minimise either one and the other collapses. The basis built from the receptors is best at neither and is the only entry in the table respectable at both.

brain · Appearance
How far from circles every basis leaves the ellipses. Eight bases ranked on the mean ratio of the long to the short axis of MacAdam's twenty-five discrimination ellipses, measured in a lightness–chroma space built on that basis. The range runs from 1.61 for best for discrimination to 7.70 for best for adaptation. The ordering is not the ordering on the other objective and is nearly its reverse.

One matrix doing two jobs

CIECAM16 adapts in CAT16 and then applies its response compression in the same axes, so a single matrix decides both how well the model handles a change of light and how uniform the space it produces is. The two jobs have different best answers, and the matrix was chosen against only one of them.

brain · Appearance
Five answers to how far the ellipses are from circles. Five mean axis ratios on the same twenty-five measured ellipses, measured the same way in every row: the boundary points carried through, the longest radius over the shortest, averaged. What differs is which class of map is allowed. The first two rows are chromaticity diagrams, which divide by a sum; CIE xy as printed leaves 2.95 and the best diagram there is leaves 2.02. The last three are lightness–chroma spaces, which divide by a white point; CIELAB as specified leaves 3.44, the best space with no compression leaves 2.33, and the best space with a cube root in it leaves 1.61. Neither family contains the other, and only the last one gets below two.

A compression goes below the floor

Elsewhere this collection minimised the anisotropy of MacAdam's ellipses over every chromaticity diagram there is, found 2.02, and called the residual a property of the eye. It is a property of the eye seen through a projective picture. A cube root after the right basis reaches 1.61 on the same twenty-five ellipses.

difference · Metric
The floor as a function of the exponent, and the fixed basis beside it. Two curves against the compression exponent on a logarithmic axis from 1 to 10. The lower curve is the best mean ellipse axis ratio any basis can reach with that exponent applied after it, and it falls from 2.33 at no compression to 1.66 at a square root and 1.61 at a cube root, then hardly moves — 1.57 at a tenth root. The upper curve is CIELAB's own basis at the same exponents and gets steadily worse, from 3.57 to 3.77. Almost everything a compression buys arrives with the first step away from linearity, and after that the exponent is choosing between 1.66 and 1.61 while the basis is choosing between 1.61 and 3.44.

The exponent was never the argument

A century of colour science has argued about whether the eye's response is a cube root, a square root or a logarithm. Minimise the anisotropy of MacAdam's ellipses over every basis, at each of eight exponents, and the floor moves by under three per cent between a cube root and a tenth root — while the basis moves it by a factor of two.

difference · Metric
The points a ratio needs are proportional to the ratio. A scatter of 133 points on logarithmic axes, one per MacAdam ellipse under each of six coordinate systems. The horizontal position is that ellipse's true axis ratio; the vertical is the smallest sample size, from a sequence of doublings, at which the sampled ratio comes within one per cent and stays there. A line of slope 0.94 runs through them, against a predicted 1 — the minimum's notch is 0.88 σ₂/σ₁ radians wide, so resolving it takes a number of points proportional to σ₁/σ₂, and nothing about the basis or the ellipse enters beyond that. An ellipse with a ratio of two needs seventeen points and one with a ratio of twenty-six needs a hundred and ninety-two.

An extremum is not a sample

Three separate measurements in this collection took a maximum or a minimum over a sample of a set — forty-eight points round an ellipse, twenty-four directions out of an optimum, fourteen changes of light off a list. All three are wrong, all three are wrong in the same direction, and the error in each grows with the very quantity being measured.

limits · Limits
The minimum sits in a notch the width of the answer's reciprocal. The distance from the centre to the boundary, all the way round one MacAdam ellipse mapped into a lightness–chroma space built on the CIE RGB primaries. The curve has two broad maxima and two very narrow minima: the dip is about 2.5 degrees wide at a third above its floor, because the width of the minimum of an ellipse's radius is the reciprocal of its axis ratio, and this ratio is 41. Forty-eight sample points, marked, are spaced 7.5 degrees apart, so none of them lands in either notch and the smallest one found is 2.2 times the true minimum. The ratio comes out 18.59 where it is 40.76.

An ellipse is not a ring of points

For eleven rounds of argument the distortion a colour space does to MacAdam's ellipses by mapping forty-eight points round each one and dividing the longest radius by the shortest. The minimum sits in a notch whose width is the reciprocal of the answer, so the method was accurate wherever the answer was small and short by a factor of two where it was large.

difference · Metric
Three numbers for one set of ellipses, and which of them is which. Two curves and a horizontal line, against the size the ellipses are drawn at. The line is the analytic axis ratio — the ratio of the singular values of the map's own derivative, which is what "does this space make discrimination contours circles" means. The upper curve is a very finely sampled ring, which sits 0.6 per cent above the line at full size and converges onto it as the ellipse shrinks, because the gap between them is the second-order distortion of the map across a real ellipse rather than an error. The lower curve is the forty-eight-point sample used for this until now: it does not converge onto anything, because its error is set by the sample and not by the size.

Three numbers for one ellipse

How far a colour space is from making a discrimination contour circular has three different answers — what a coarse sample of the boundary reports, what a converged sample of a contour of stated size reports, and what the map's own derivative says. They differ by up to a factor of two, they mean different things, and only one of them is what the question is asking.

difference · Metric
The cheapest direction to give ground in is the flattest one. Six bars, one per direction the adaptation objective can see, showing how much of the other objective a fixed budget of adaptation buys if it is spent along that direction. The rate is the slope of the second objective divided by the square root of the first's curvature, so it rewards a direction the second objective wants and punishes one the first is stiff in. The flattest direction wins at 10.68 against 3.29 for the next best and 0.54 for the stiffest — a factor of 20. Spending 1 per cent of the adaptation optimum there moves the anisotropy from 7.70 to 5.02.

The trade only runs one way

Standing at the basis that adapts best, one per cent of adaptation buys forty-four per cent of the way to the discrimination floor. Standing at the basis that discriminates best, the same one per cent buys under two. The scatter that shows two objectives pulling apart looks symmetric and is not, and the asymmetry is what a committee choosing between them would most want to know.

brain · Appearance
How wrong the ellipses would have to be for a pair to change places. One bar per adjacent pair in the uniformity table: the relative error on each ellipse's own axes at which that pair changes places in one draw in twenty. No error on the data is quoted anywhere — the question is inverted, so what is reported is how large an error would have to be, and a reader with an opinion about MacAdam's experiment can compare it with their own number. The nearest pair goes at 0.171; 2 of the 7 pairs do not reverse under any error this search covers.

How wrong would the data have to be

Twenty-five ellipses measured on one observer in 1942 are the ruler every colour space here is judged against, and they have never been given an error. Rather than invent one, the question is turned round, and asks how large an error would have to be before the ranking changed.

difference · Metric
Twenty-five ellipses is a sample, and the score has an error bar. One row per colour space this collection ranks: the mean axis ratio its ellipses come out at, with the standard error of that mean over the twenty-five ellipses it was computed from. No literature is quoted — a mean of twenty-five numbers has a standard error those twenty-five numbers determine. The bars are far from equal: the best space carries ± 0.07 and the worst ± 1.56, because a space that makes the ellipses nearly circular makes all of them nearly circular and one that does not is dominated by whichever ellipse it handles worst.

Twenty-five is a sample of the diagram

A colour space's uniformity score is the mean of twenty-five numbers, and a mean of twenty-five numbers has a standard error those twenty-five numbers determine. Nothing has to be quoted to compute it, and three of the seven adjacent pairs in this collection's ranking survive it.

difference · Metric
Room is not safety: two orderings of the same three claims. Three pairs of bars, one pair per published statement about the confusion points. The upper bar in each pair is the margin — how far the measured number is from the threshold that makes the statement true, as a ratio. The lower bar is the headroom — the factor by which one declared width of the population model would have to be wrong for the statement to fail. Both start at one, which is the line. Ordered by margin the three read the protan margin, the tritan margin, the deutan margin; ordered by headroom they read the protan margin, the deutan margin, the tritan margin, and the middle two change places. Every one of the three is inside a factor of two of failing, which the margins do not say.

What would have to be wrong

A great many statements here have thresholds written into them, which turns out to make an audit possible — for each one, the smallest change in a declared input that would stop it holding. Most are unreachable. One is inside a factor of one and a third.

limits · Limits
How far each unit is from being a rescaling of the one this collection publishes in. One row per unit on the menu. The bar is the root-mean-square scatter about that unit's own best rescaling of ΔE2000, over 374 pairs of surfaces differing by a fraction of a unit to about ten. A bar of zero would mean the unit is ΔE2000 in different money — every printed number would change and no conclusion would. ΔE2000's own row is zero by construction and is the check that the table is computed the right way round. The two units that divide a chroma difference by the chroma it was measured at, ΔE94 at 15 per cent and CAM16-UCS at 24, are closer to it than the three that do not, which run from 28 to 35. The split is by weighting and not by whether the unit is a matching difference or an appearance one.

The weighting is the disagreement

Five colour-difference formulae, three decades and two committees, and the single property that predicts which of them agree is whether a chroma difference gets divided by the chroma it was measured at. It sorts the menu exactly, it cuts across the distinction between a matching difference and an appearance one, and it halves the census's largest sensitivity.

difference · Metric
MacAdam's twenty-five ellipses, measured in each unit. The uniformity instrument used here, applied to units rather than to spaces. The upper bar is anisotropy — the mean over the twenty-five of the largest radius divided by the smallest, where 1 would be a circle. The lower is spread — the largest mean radius divided by the smallest across all twenty-five, which asks whether a step of the same size means the same thing in different parts of the diagram. Reading down the three CIELAB-based formulae in the order they were published, the anisotropy falls 3.42 → 2.89 → 2.74 and the spread rises 3.24 → 3.59 → 4.12: the weighting divides a difference by the chroma it was measured at, which equalises directions at a point and unequalises magnitudes between points. Neither number is scaled, so no calibration is applied here. CAM16-UCS is ahead on both.

A unit rests on a space that was ranked

This collection ranks three colour spaces by how nearly they make MacAdam's ellipses circles, and CIELAB comes last. It then publishes every difference it computes in a formula built on CIELAB. Turning the same instrument on the formulae rather than the spaces shows the repair works — and that it buys roundness by paying in evenness.

matching · Gamut
What one tolerance accepts, around four colours. The surface in tristimulus values that ΔE₀₀ 1.0 draws around four colours, each outline scaled to its own size so the shapes can be compared. The volumes they enclose differ by a factor of 1.0e+5 across the sRGB cube, and the longest axis of one shell is between 3.3 and 29.9 times its shortest. A tolerance is written as one number and is a different set of samples at every colour it is applied to.

What one number accepts

A delivery tolerance is written as a single colour difference and it acts on three tristimulus values, so what it actually accepts is a closed surface. Measured over sixty-four colours in the sRGB cube, the volume inside that surface varies by a factor of a hundred thousand and its longest axis is between three and thirty times its shortest. The same contract, applied to a dark colour and a light one, is two different requirements.

matching · Gamut

Named alongside it

The objects these essays reach for when they reach for this one.

CIELABPerceptual uniformityΔEJust-noticeable differenceToleranceAnisotropyThresholdCIEDE2000BasisChromatic adaptationSamplingSpecification

All concepts