The collection

Every essay — page 2

Page 2 of 40, continuing through the fields in the same order.

What light is What the eye does Matching and measuring Difference and uniformity What the brain does What a scene does What a camera does Where the model breaks What it takes to deliver it

SeriesObserversNamed objectsRefutationsSearch

What the brain does

Constancy, adaptation and simultaneous contrast — the reasons a patch of known radiance still has no determined appearance.
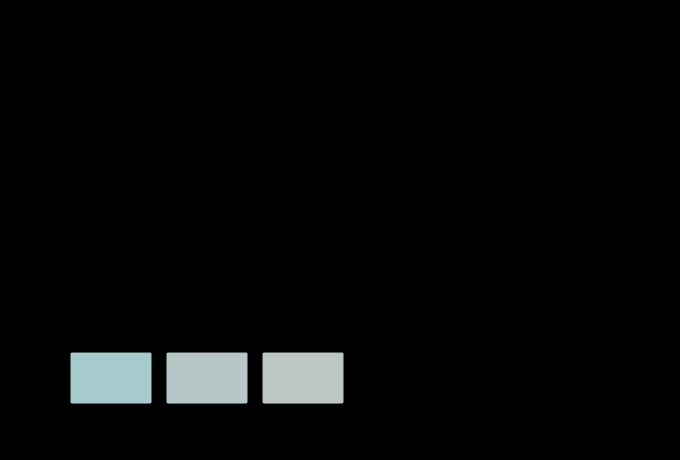
An afterimage, as the local pool coming back to equilibrium. The local pool has adapted to the patch and the global pool has not, so the gain change is exactly the local share of a full von Kries change — which is why afterimage's free strength parameter is not free here. The dwell is 20 seconds. The swatches are the predicted appearance of the test surface at four moments. They are predictions of hue and direction; there is no response compression in this model, so the chroma is a ceiling rather than an estimate.

A gain has a time constant

An afterimage and the clock on chromatic adaptation were built in different files from what the last phase said was one mechanism. Joining them removes a free parameter, reproduces both, and predicts a third thing — that two people in one room, at one moment, looking at one patch, do not agree about its colour.

8 figures
The eye's own drift, and what it does to every spatial frequency. A pattern of f cycles per degree, drifting across the retina at 0.5 degrees a second, arrives at each receptor at f × 0.5 hertz. The curve is the temporal sensitivity at that rate, against the pattern's spatial frequency. Every frequency the eye can resolve stays above a quarter of the temporal peak, and the band of drift speeds for which that holds is 0.02–0.71 degrees a second — with the measured drift inside it. Faster and the finest detail is carried past 60 hertz, where there is no sensitivity at all.

The eye is never still

A perfectly stabilised retinal image disappears within seconds. What keeps the world there is a drift of about half a degree a second between the microsaccades — fast enough to keep the finest detail modulating and slow enough not to carry it past fusion, in a band whose upper edge is at 0.71 degrees a second.
6 figures
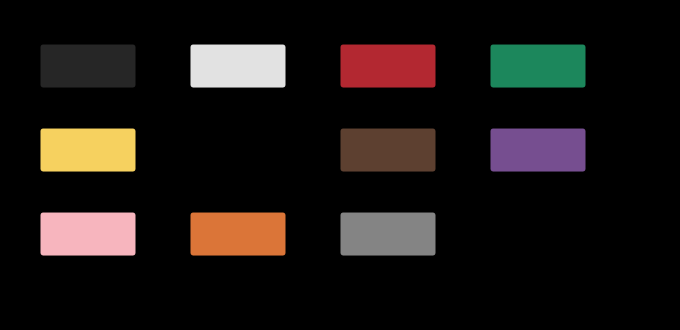
The eleven basic colour terms, at their quoted centroids. Each patch is the CIELAB centroid quoted for that term, converted to a stimulus and drawn — except blue, whose focal colour is outside the sRGB gamut and is therefore hatched rather than clipped, which is the rule for an unreachable colour everywhere else and applies here too. The centroids are rounded to 5 units in each coordinate, and moving them by that much either way leaves the same term outside.

A colour has a name

Every quantity here is a number, and the question a reader arrives with is what colour something is called. The eleven basic terms of English divide the space into territories that differ by a factor of five, the metric accounts for fifteen per cent of that, and one of the eleven focal colours cannot be shown on this page at all.

8 figures
How large a step changes the name, across the ab plane at L* 60. At each point, the smallest ΔE00 step in any direction after which the probability of two people using the same word has halved. It runs from 4.8 to 33.8 units across this one plane, in eight quantised levels: the palest cells are where a name is finest — a short step changes it — and the strongest are the middles of large territories, where a colour can move twenty units and keep its word. The ragged edge is the sRGB boundary at this lightness rather than a property of the vocabulary. The boundary softness is a stated parameter of the model, and the map barely moves when it is changed fourfold, because what sets this quantity is how far apart the centroids are.

A name is not a threshold

Two colours have to move about ten times a just-noticeable difference apart before people stop calling them the same thing, and how far varies threefold across one plane of the space. A tolerance and a word are answering different questions, and nothing in colorimetry converts between them.

7 figures
The appearance model's three rooms, read as three moments. CIECAM16's degree of adaptation is a function of the surround and the adapting luminance and of nothing else — the model has no time in it. Solving for the moment at which an observer who will adapt completely has got that far turns each of the three tabulated surrounds into a reading on a clock. At 100 candelas per square metre they are 106, 49, 21 seconds. They are presented as three rooms. They are also one observer, in one room, at three times in the first two minutes.

A viewing condition is a moment

CIECAM16's degree of adaptation is a function of the surround and the adapting luminance and of nothing else, because the model has no time in it. Solving for when an observer who will adapt completely has got that far turns the standard's three surrounds into three clock readings — 107, 50 and 21 seconds — and the two readings are distinguishable by waiting.

7 figures
How much of the gamut changes name, and what changed it. The eleven basic terms are quoted as centroids in CIELAB, and a colour is named by which one it is nearest. Two things nobody records decide the answer. Changing the distance function renames 20.5 per cent of the displayable gamut. Changing the room — the same colours, the same words, a different surround, through the appearance model — renames up to 26.8 per cent. The centroids were measured in one viewing condition and are applied here in every essay as though a name were a region of a space with no room in it.

A name moves with the room

Eleven basic colour terms are quoted as centroids in CIELAB and a colour is named by which one it is nearest. Two things nobody records decide the answer — which distance function is used, which renames a fifth of the displayable gamut, and which room the colour is in, which renames more than a quarter of it.

8 figures
Every published adaptation transform, and one computed from daylight, on every change. What each basis leaves an adapted observer with, row by row. Darker is worse. The last column is not a published transform: it is the basis in which a change from D65 to D50 is exactly diagonal, computed in closed form from the two spectra with nothing fitted. It is far the best on the daylight rows and it is beaten on the discharge lamps, which is the trade the published transforms are sitting in — they were fitted to data containing both kinds of light and are therefore optimal for neither. Over the census as a whole the winner is Bradford at ΔE00 1.14.

A gain needs a basis

Adaptation scales three signals, and which three is a choice. The basis in which a change from D65 to D50 is exactly diagonal can be computed in closed form from the two spectra, it beats every published transform on daylight by a factor of five, and it loses to all of them on a fluorescent tube.

7 figures
How much of what a display can show each name owns. Every point on a 5-unit CIELAB lattice inside the sRGB gamut is given to its nearest centroid under ΔE00, and the shares counted. They run from 21.1 per cent for purple to 4.6 for blue, a factor of 4.6. The three terms that carry no chroma at all — black, grey and white — hold 20 per cent between them. A share here is a statement about the names and about the gamut they are counted over, and the gamut is sRGB.

A name in the model's own words

The eleven basic colour terms move when the room does, and the obvious objection is that they were being measured in a space with no room in it. Quoting them in an appearance model's own coordinates instead does not shrink the renaming — it grows it by four per cent — and the space alone renames an eighth of the gamut with the room held still.

5 figures
How blue the sheet reads, and how much of that is the room. Chroma in an appearance model, with the observer adapted to the light the sheet is under. The three markers on each row are an average, a dim and a dark surround; the open marker at the left is the same sheet with the ultraviolet removed. Every stock is close to neutral without the excitation and carries real chroma with it, at a hue of about 295 degrees — blue-violet — so the colour is the fluorescence and not the substrate. And it falls by nearly half between a bright room and a dark one, which makes how blue a sheet looks a property of where it is being looked at.

A brighter white still looks white

Colorimetry says a brightened sheet is nine units of b* from neutral, which sounds like a visible blue. An appearance model with the observer adapted to the room says it carries eleven units of chroma at a hue of 295 degrees — genuinely blue-violet — and that the number falls by nearly half between a bright room and a dark one. What it cannot say is why anybody calls the result white.

7 figures
Where each published matrix puts the confusion points, whether or not it meant to. Every matrix from tristimulus values to cone responses commits itself to three confusion points, because the point is the direction the other two rows annihilate. The first row is the construction from the measured points and returns them exactly. The rest were chosen for other reasons and land elsewhere — Hunt–Pointer–Estévez, which this collection uses everywhere, misses the deuteranope's point by 1.28 in chromaticity. The worst here is 4.09.

The cones an appearance model uses

CIECAM16 adapts in three axes whose rows are labelled L, M and S, and they were fitted to corresponding-colour experiments rather than measured on receptors. Run the dichromat construction backwards on them and they commit to a deuteranope confusion point 1.45 away in chromaticity from the measured one — which is a test the axes were never asked to pass.

8 figures
Every basis against both objectives at once. A scatter with the mean adaptation residual across the illumination census on the horizontal axis and the mean axis ratio of MacAdam's ellipses in a lightness–chroma space on the vertical. Lower is better on both. The two winners sit at the two ends of an empty diagonal: the basis that adapts best leaves 7.70 on the vertical and the basis that discriminates best leaves 1.79 on the horizontal, each worse on the other objective than every published transform. The basis built from the dichromat confusion points is at (1.65, 2.60) — best at neither and within a factor of two of both floors, which no other entry in the picture manages.

No basis is good at both

The same nine numbers decide how well a von Kries gain reproduces a change of light and how nearly a lightness–chroma space makes the discrimination ellipses circles. Minimise either one and the other collapses. The basis built from the receptors is best at neither and is the only entry in the table respectable at both.

6 figures
How far from circles every basis leaves the ellipses. Eight bases ranked on the mean ratio of the long to the short axis of MacAdam's twenty-five discrimination ellipses, measured in a lightness–chroma space built on that basis. The range runs from 1.61 for best for discrimination to 7.70 for best for adaptation. The ordering is not the ordering on the other objective and is nearly its reverse.

One matrix doing two jobs

CIECAM16 adapts in CAT16 and then applies its response compression in the same axes, so a single matrix decides both how well the model handles a change of light and how uniform the space it produces is. The two jobs have different best answers, and the matrix was chosen against only one of them.

6 figures