Uniform chromaticity scale — where it appears
Named by 3 essays across 2 fields — each of them below, with the objects they name alongside it.
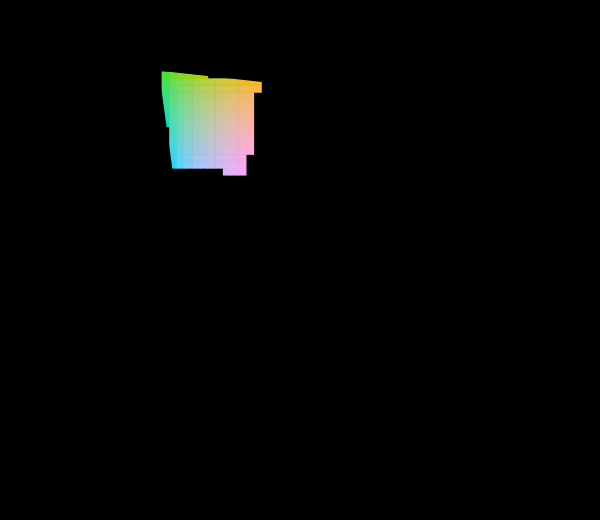
The diagram was replaced in 1976
The CIE knew the 1931 diagram was badly distorted and published a better one. Half a century later almost every chromaticity plot in print is still the old one, and both are still printed filled edge to edge with colours no display can show.

The diagram has no area
A chromaticity diagram is a projective picture of a three-dimensional space, and the freedom colour matching leaves in the observer acts on it as a projective map. Straight lines and mixture ratios survive that; area, distance and angle do not — so half of what the diagram is used to say is a statement about the paper.

No diagram makes them circles
Every chromaticity diagram is a projective picture of the same measurement, so how badly MacAdam's ellipses fail to be circles can be minimised over the whole family of them. The best plane there is still leaves the average ellipse twice as long as it is wide — which makes the residual a fact about the eye rather than about anybody's choice of primaries.
Named alongside it
The objects these essays reach for when they reach for this one.
Projective transformationChromaticityChromaticity planeCIELABDiagram conventionsGamutIdentifiabilityInvarianceMacAdam's ellipsesAdditive mixtureΔEImaginary primaries