The collection

Every essay — page 10

Page 10 of 40, continuing through the fields in the same order.

What light is What the eye does Matching and measuring Difference and uniformity What the brain does What a scene does What a camera does Where the model breaks What it takes to deliver it

SeriesObserversNamed objectsRefutationsSearch

What the eye does

Three cone types project an infinite-dimensional spectrum onto three numbers. Everything colour science can and cannot do follows from that one collapse.

The CIE 1931 colour-matching functions. The three functions that turn a spectrum into three numbers. They are all positive, which is why XYZ exists — the RGB functions they were derived from are not. ȳ is by construction the luminous efficiency function, which is why luminance comes out of Y.

Why colour is exactly three-dimensional

Matching every wavelength with three primaries requires, for some wavelengths, a negative amount of one of them. That physical awkwardness is why the colour-matching functions were transformed into XYZ, and why the horseshoe is curved.

6 figures
The same two surfaces, weighed by each system. A long-wavelength and a short-wavelength surface under D65, with their relative luminance under the photopic curve and under the scotopic one. Under daylight vision the red surface is 1.33 times the blue; under rod vision it is 0.15 times, a reversal by a factor of 9.0. The swatches are the photopic appearance, which is the only one a display can produce: rod vision has no colour, and drawing a guess at it would be an invention.

The eye that has no colour

Rods outnumber cones twenty to one, work alone below a hundredth of a candela, and are absent from the centre of gaze. Between dusk and a lit room both systems run at once, and neither standard curve describes what is happening.
7 figures
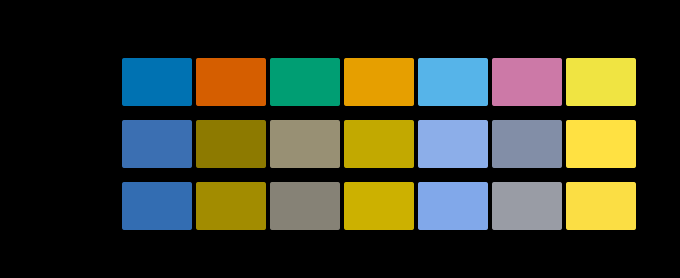
One palette under normal vision and two dichromacies. The same 7 colours simulated by the Brettel–Viénot–Mollon construction at severity 1.0. protanopia and deuteranopia collapse the red-green distinctions. This shows which discriminations survive, not what anybody sees.

Three cones, two axes

The retina does not send three receptor signals down the optic nerve. It sends a sum and two differences, and the reason falls out of the statistics of natural light rather than out of anything the eye intended.

8 figures
Longitudinal chromatic aberration of the eye, focused at 555 nm. Thibos's chromatic eye, plotted as defocus in dioptres relative to 555 nm. The curve crosses zero exactly once, at the wavelength the eye is accommodating on, and everything else is out of focus — by -1.22 D at 420 nm and 0.50 D at 680 nm. Through a 3 mm pupil that first figure is a blur circle of 12.6 minutes of arc, against a foveal acuity limit of about one. The eye is never in focus across the spectrum and never can be.

Nothing is in focus at both ends

The eye carries about two dioptres of chromatic aberration across the visible band, which is a strong reading prescription. Whatever it is focused on, most of the spectrum is landing somewhere other than the retina — and the cone class that gets the worst of it is the one the retina bothered least to sample.

9 figures
Three retinas of different composition, making identical colour matches. Seeded mosaics at L:M ratios of 1, 4, 16 to one — the range found between people, and a 16-fold difference in what the retina is made of. A colour match is the claim that two spectra produce equal excitation in all three cone classes, and changing how many of a class there are multiplies that class's excitation by a constant, which cannot disturb an equality. The relation between the two test spectra is identical to twelve decimal places across the whole sweep. Luminance, which is a weighted sum rather than an equality, moves by 1.33× over the same range. That asymmetry is why a standard observer exists and why V(λ) has a much larger between-observer variance than the colour-matching functions do.

The mosaic is not the observer

The ratio of long-wavelength to medium-wavelength cones varies between ordinary people by a factor of sixteen. Those people make the same colour matches, to twelve decimal places, and that single fact is the reason a standard observer can exist at all.

8 figures
Contrast sensitivity, three channels, normalised to each channel's peak. Spatial frequency in cycles per degree against relative sensitivity. The luminance channel runs to 50 cycles per degree, red–green to 12 and blue–yellow to 8, each by the same criterion of 5 per cent of that channel's own peak. Only the luminance channel dips at low frequency; the two chromatic ones are low-pass, so a chromatic edge of any size at all is seen at its full contrast.

How fine a colour edge can be

The eye resolves a lightness pattern to about fifty cycles per degree and a red–green one to twelve. Every colour difference here is quoted as though a patch had no size, and the same difference is plainly visible at one scale and gone at another.

6 figures
The L cone's sensitivity at three axial pigment densities. Each curve is normalised to its own peak, so the only difference visible is shape. Raising the density from 0.1 to 0.9 widens the curve from 113.6 to 145.9 nm at half height while the peak stays within 5 nm of where it was. That is Beer–Lambert saturating: at the peak the pigment already absorbs nearly everything, so more of it can only catch more light in the wings.

A cone absorbs its own light

A photopigment's absorbance is a property of a molecule; a cone's sensitivity is that molecule stacked in a column deep enough to absorb most of what arrives. The stacking broadens the curve by thirty-five nanometres, and two observers differing in nothing else disagree about a match that is exact for one of them.

8 figures
Photons caught by one cone in one integration time, under D65. Each curve is one cone class, counting isomerisations during a 0.1 s integration through a pupil that closes as the light rises. At 1000 cd/m² a long-wavelength cone catches about 11522 and at 0.001 it catches 0.12 — which is where the square root of the count stops being a small correction and starts being the signal. The rate works out at 30 isomerisations per second per troland, inside the published band of 5–50.

Colour goes first in the dark

A cone reports a count, and a count carries the square root of itself as noise. Counting the photons says where colour vision stops — a chromatic difference runs out four hundred times sooner than a lightness difference of the same size — and says just as clearly that in daylight the eye is nowhere near that limit.
9 figures
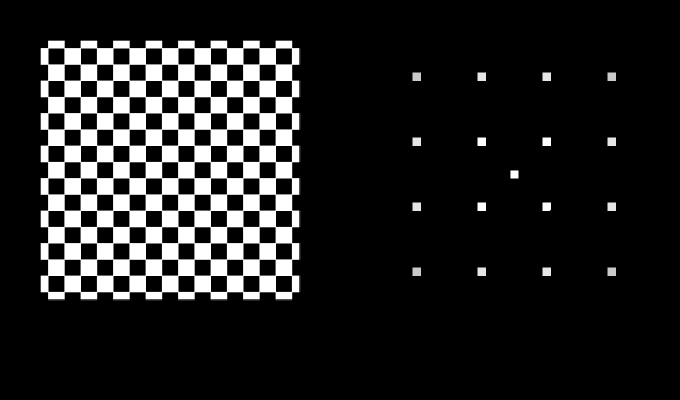
A screen at 45°, 8 c/°, and where its energy sits. Left, the pattern. Right, its power in the frequency plane with the zero frequency at the centre and the edges at the sampling limit of 23 cycles per degree, on a logarithmic scale over five decades. The closed curves are the visual system's own sensitivity at 5, 25, 60 per cent of its peak; they are not circles, because sensitivity is lower on the diagonals than on the cardinal axes by a factor of 2.0 at high frequency. Energy inside a curve is seen; energy outside it is not, whatever its size.

A pattern has a direction

Every spatial claim here is a claim about a frequency, and a frequency has no direction in it. Turning a printed screen forty-five degrees makes it exactly twice as quiet with nothing else changed — and the same rotation does nothing at all to a chromatic one.

7 figures
Cone density, out from the centre of gaze. Quoted landmarks with logarithmic interpolation between them: 199,000 cones per square millimetre at the fovea, 9,500 at ten degrees — a factor of 21. The shaded bands are the two standard observers' fields. The 2° observer averages over a region whose density falls by 3.3× between its centre and its edge and the 10° observer by 12.4×, which is what "a 10° field" contains and is why the two sets of matching functions are different shapes rather than the same shape scaled.

Colour stops at the edge of sight

Cone density falls twenty-one-fold between the centre of gaze and ten degrees out, and the three channels give out at three different rates — so a colour difference in the periphery does not merely shrink, it turns. At the exact point of fixation there are no short-wavelength cones at all.

8 figures
Temporal sensitivity, and where each channel gives out. Modulation frequency in hertz against relative sensitivity. The luminance channel is band-pass, peaking at 8 hertz and running out at 60; an isoluminant modulation is low-pass and runs out at 15, which is 4.0 times sooner. Both cutoffs are at the same criterion of 5 per cent of that channel's own peak, so the ratio between them is a ratio between two measurements rather than between two conventions.

The eye has a shutter

An isoluminant flicker fuses at fifteen hertz and a luminance one at sixty, so a light whose colour changes forty times a second is a steady light of a colour it never emits. And the frequency at which flicker stops being visible is not a property of the eye — it moves twelve and a half hertz for every decade of light.

8 figures
The drift window, asked about each channel in turn. Every spatial frequency a channel can resolve, drifting at v degrees a second, arrives at f × v hertz; the bar is the range of v over which all of them stay above a quarter of that channel's temporal peak. The luminance band is closed at both ends — 0.018 to 0.71 degrees a second — because its temporal sensitivity has a dip at zero to fall into. The chromatic bands have no slow edge at all, because chromatic temporal sensitivity is low-pass: a stationary chromatic pattern sits at the top of its own sensitivity. The mark is the measured drift, and it is inside all three.

The drift is a luminance mechanism

The eye's own drift was shown to sit inside a band of speeds that keeps every spatial frequency modulating, and the band was quoted as though it were about vision. Asked about colour, it has no slow edge at all — a stationary chromatic pattern needs no eye movement whatever. And a stabilised chromatic pattern is the first thing to fade.

7 figures