The collection

Every essay — page 18

Page 18 of 40, continuing through the fields in the same order.

What light is What the eye does Matching and measuring Difference and uniformity What the brain does What a scene does What a camera does Where the model breaks What it takes to deliver it

SeriesObserversNamed objectsRefutationsSearch

What light is

A spectrum is a function, not a colour. Illuminants, reflectance, blackbody radiation computed from Planck's law, and what has already been discarded before the eye is reached.

One instrument, one slit, two requirements. The slit's width swept, with three measurements on a logarithmic scale: a smooth sample under the line lamp, where only the lamp's structure is at stake; the notched sample under a smooth lamp, where only the notch is; and the real case, both at once. The lamp wants a slit of 5 nanometres and the sample wants 1, and each wants what it wants for the same reason: a slit should spread a feature the grid cannot resolve and leave one it can. The real case is best at 3 nanometres — which is neither requirement's answer — and costs 0.247 there, an order of magnitude more than either requirement alone.

One slit, two requirements

A line lamp wants a wide slit, because a wide slit spreads a line where a coarse grid can see it. A notched sample wants a narrow one, because a wide slit fills the notch the grid could have resolved. An instrument has one slit. Measured on the two requirements separately the best widths are five nanometres and one; measured on the two together the best is three, which is neither — and it costs twelve times what the lamp alone would cost and thirty-four times what the sample alone would.

6 figures
An interference notch filter, and where a five-nanometre grid lands on it. The transmittance of a Fabry-Pérot etalon of order 24 and finesse 20, drawn at a fifth of a nanometre, with the standard grid's points marked. Its features are 2.29 nanometres wide and spaced 22.9 apart, so the grid steps over them: between two adjacent grid points the transmittance rises and falls completely, and neither point records it. That is what a real coating looks like, and a Gaussian notch — which is what this collection's earlier work used — is a much gentler object.

A finer table is a worse table

A real interference filter is not a Gaussian notch. It is an etalon, with pass bands a nanometre or two wide spaced twenty-three apart, and a five-nanometre grid steps over them. Resampled from the maker's one-nanometre table its colour is out by five colour differences under every fill-in rule — the three rules agree to three decimals, because none of them is ever handed a sample inside a feature. The same filter measured through a five-nanometre slit is out by 0.03.

7 figures
Every pair of slits, over 68 notches. The colour error, in ΔE₀₀ from the truth, for every pair of slit widths — the lamp's table blurred through the width down the side, the sample's through the width across — on 68 notches, the mean over all of them under a fluorescent tube. Circle area follows the error. The best pair is 5 nm on the lamp and 1 nm on the sample, at 0.26; the best single slit, on the diagonal, is 5 nm at 0.36. One slit on the reflected light, at 5 nm, averages 0.016.

A second slit buys a quarter

A line lamp wants a five-nanometre slit and a notched sample a one-nanometre slit, so an instrument with a slit for each should do much better than one with a single compromise. Over sixty-eight notches under a fluorescent tube, it does better by 28 per cent. One slit on the reflected light does fifteen times better than the best pair, and an oracle choosing the best pair for every notch is still six times worse. The error was never that the factors were flattened; it was that they were flattened separately.

6 figures
Three bounds against the error they bound, over 68 notches under a fluorescent tube. Each notch placed across by its actual colour error from blurring the lamp and the sample separately, and up by a bound on that error, both on logarithmic scales; the dashed diagonal is where a bound equals the error, and a valid bound sits above it. Cauchy–Schwarz with the true window variances is above the diagonal on every notch, a median 14.7 times the error. Estimated from the blurred tables it falls below on 6 of 68, as low as 0.45 of the error. The Bhatia–Davis bound from the tables and declared ranges is above on every notch and a median 196 times the error.

The tables cannot bound what they discarded

A colour computed from a lamp's blurred table and a sample's blurred table is wrong by the covariance the two blurs threw away, and Cauchy–Schwarz bounds a covariance by two variances. With the true variances the bound always holds and sits fifteen times above the error. With variances read from the tables it fails on six of sixty-eight notches under a fluorescent tube and twenty-two under a laser projector — on the line, where the error is largest. A blurred table does not carry the width of a line, and the covariance depends on it.

6 figures
What declaring a narrowest feature buys, and where it stops being true. The median looseness of a Cauchy–Schwarz bound whose lamp variance is bounded by a declared narrowest feature, against the width declared, for a fluorescent tube and a three-laser projector. Each lamp's own Bhatia–Davis bound — the peak declared and nothing else — is the upper dashed line, and the bound with the true variances is the lower one. The marks are the width each lamp's lines actually have. Declaring it truly takes the tube from ×196 to ×86 and the projector from ×30 to ×14. The open circles are declarations the lamp does not meet, where the bound falls below the error.

A declared width buys a factor of two

A colour engine given two separately blurred spectral tables cannot bound its own error from them, and the bound that always holds — the peak declared and nothing else — sits a median 196 times above the error under a fluorescent tube. Adding one number, the width of the lamp's narrowest feature, brings that to 86. It never fails on any declaration the lamp truly meets, it fails on 47 of 68 notches on one it does not, and its rank correlation with the error it bounds is 0.27.

5 figures

Where the model breaks

Seventeen observers in 1931, an error in the blue that was never fully repaired, colour vision deficiency, and the display this page is being read on.

The CIE 1931 colour-matching functions. The three functions that turn a spectrum into three numbers. They are all positive, which is why XYZ exists — the RGB functions they were derived from are not. ȳ is by construction the luminous efficiency function, which is why luminance comes out of Y.

Seventeen observers in 1931

The standard observer that governs every colour specification in industrial use is an average over seventeen young British men, measured with equipment from the 1920s. It is known to be wrong in the blue, the correction has existed since 1951, and it has never been adopted.
7 figures
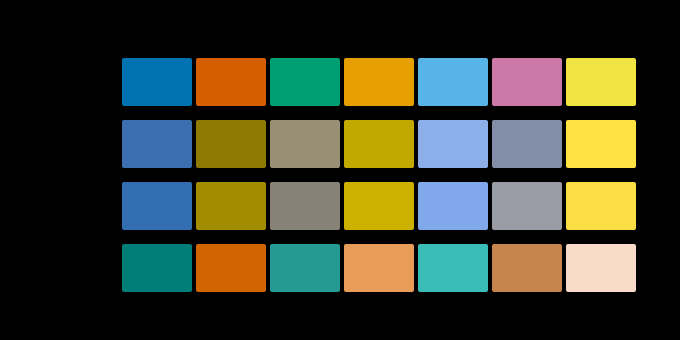
One palette under normal vision and three dichromacies. The same 7 colours simulated by the Brettel–Viénot–Mollon construction at severity 1.0. protanopia and deuteranopia collapse the red-green distinctions, and tritanopia leaves them and collapses blue against yellow instead. This shows which discriminations survive, not what anybody sees.

Simulating what cannot be simulated

A colour-blindness simulation cannot show what anybody sees. What it can show is which discriminations survive, and that is a narrower claim, a checkable one, and the only one worth making.
8 figures
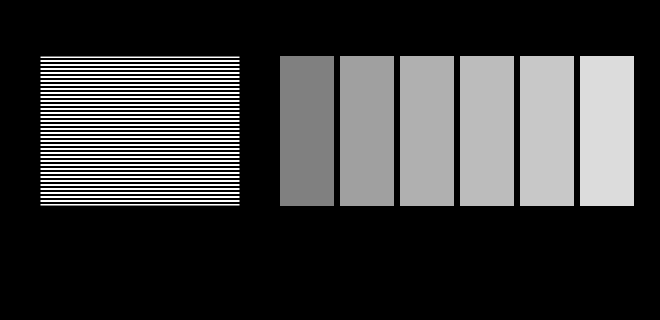
A gamma probe: which grey matches a half-white dither?. The striped block on the left is half white and half black, so it carries half the luminance of white. Stand back until the stripes blur and find the patch that matches it. On an sRGB display the answer is code 188, not 128 — code 128 has only 22 per cent of white's luminance.

The display is an unknown

This site is displayed on the very apparatus it is about, and it knows almost nothing about that apparatus. Two figures here stop assuming and ask instead — a probe for the transfer function and a probe for the gamut.

6 figures
How far a match comes apart when the observer changes. A broad source and a three-primary source, solved at each primary width so the pair is an exact tristimulus match for the CIE 1931 observer. The pair is then handed to the 1964 observer, and the gap between them is plotted. For the observer they were built for the gap is arithmetic noise at every width. For the other it grows as the primaries narrow, reaching 0.012 at 10 nm — and displays have been getting narrower for twenty years.

Whose eyes

The standard observer is an average over seventeen people, and no reader is it. What that costs was small when displays were broad and grows every time the primaries get narrower.

6 figures
Three ways to spend a thousand code values. Normalised code value against luminance, for PQ, HLG and a conventional gamma curve, all covering 0.001 to 10000 cd/m². PQ spends 51% of its range below 100 cd/m² — roughly where a picture lives — and the gamma curve spends 15%, leaving the rest for highlights. A PQ code is the only one of the three that names a luminance rather than a fraction of whatever the display can manage.

How bright is white

An sRGB value says a pixel is some fraction of whatever the display can manage. A PQ value says it is two hundred candelas. The change is the largest in display encoding since gamma, and what it removed was the honest admission that nobody knew.

10 figures
Chromaticity-triangle area against CIELAB volume, both relative to sRGB. Two ratios for each space, both against sRGB. The upper bar is the area of the primary triangle on the CIE 1931 diagram; the lower is the volume of the gamut solid in CIELAB, computed by tetrahedral decomposition of the RGB cube at 24 cells per axis. Display P3 is 1.36× sRGB by area and 1.50× by volume; Rec. 2020 is 1.89× sRGB by area and 2.26× by volume. The chromaticity diagram divides luminance out, so its triangle is a projection along the axis the eye is most sensitive to — and a coverage percentage quoted on it is a statement about the shadow.

The triangle is a shadow

A display's gamut is drawn as a triangle on the chromaticity diagram, and coverage is quoted as a percentage of that triangle's area. Chromaticity has luminance divided out, so the triangle is a projection along the axis the eye cares most about — and the ratios computed on the solid are not the ratios computed on its shadow.

6 figures
How far a match comes apart when the observer changes. A broad source and a three-primary source, solved at each primary width so the pair is an exact tristimulus match for the CIE 1931 observer. The pair is then handed to the 1964 observer, and the gap between them is plotted. For the observer they were built for the gap is arithmetic noise at every width. For the other it grows as the primaries narrow, reaching 0.012 at 10 nm — and displays have been getting narrower for twenty years.

Two degrees or ten

This site names the observer on every figure it draws, which was supposed to be the point. Measuring what it had actually done found two hundred and four figures naming the same observer, three naming the other, and sixty-two of sixty-four generators printing a string that had never once varied.

6 figures