Concept

Quantisation — where it appears

Rounding a continuous quantity onto a finite set of code values, whose error is a signal in its own right. Its error is deterministic and structured, which is why it appears as banding rather than as noise and why adding noise helps.

Named by 11 essays across 4 fields — each of them below, with the objects they name alongside it.

Three ways to spend a thousand code values. Normalised code value against luminance, for PQ, HLG and a conventional gamma curve, all covering 0.001 to 10000 cd/m². PQ spends 51% of its range below 100 cd/m² — roughly where a picture lives — and the gamma curve spends 15%, leaving the rest for highlights. A PQ code is the only one of the three that names a luminance rather than a fraction of whatever the display can manage.

How bright is white

An sRGB value says a pixel is some fraction of whatever the display can manage. A PQ value says it is two hundred candelas. The change is the largest in display encoding since gamma, and what it removed was the honest admission that nobody knew.

limits · Limits
Distinguishable colours in sRGB, counted under two difference formulae. The gamut volume divided by the volume of a ΔE = 1 ellipsoid, integrated over the solid because that ellipsoid changes size and orientation from place to place. Under the 1976 formula the answer is 195,720; under ΔE2000 it is 41,819 — 4.68 times fewer, from the same solid and the same lattice. Both assume perfect packing, which nothing achieves, so each is an upper bound rather than a count of anything. The gap between them is the result: "how many colours are there" is a question about a metric before it is a question about vision.

How many colours are there

Sixteen point seven million counts code values in a file format. Ten million distinguishable colours is a volume divided by the size of a just-noticeable difference — and the two difference formulae this site implements disagree about that size by a factor of nearly five.

difference · Metric
Everything between the photons and the picture, and what each stage decides. The 8 stages of a camera pipeline. Only the second is physics; every one after it is a decision somebody made, and the reason two cameras pointed at the same scene disagree is that they made different ones.

Raw is not a picture

A raw file is three integrals per site and a list of decisions nobody has taken yet. Every one of those decisions has a defensible answer and none of them has a correct one, which is why two converters open the same file and disagree.

imaging · Capture
Correcting colour costs noise, and the two cannot both be least. Sweeping the colour matrix from its own diagonal — a white balance with no cross terms — to the full least-squares fit. Mean ΔE00 falls from 18.61 to 1.29; photon noise rises by a factor of 1.03. At 10000 photons per pixel.

Correcting colour costs noise

The matrix that turns a sensor's raw into XYZ has large off-diagonal terms of both signs, because that is what correcting a sensor which fails Luther's condition requires. Differences of large numbers are where noise grows, and the full correction amplifies photon noise by 1.66 times.

imaging · Capture
A clipped channel turns the hue of what is left. CIELAB hue shift against exposure for one saturated stimulus, measured against the same stimulus rendered without clipping. Nothing moves until the first channel reaches the ceiling at 0.25 stops; after that the recorded hue rotates by as much as 67 degrees, with nothing in the scene having changed colour.

A blown highlight turns

An exposure that clips nothing changes no hue at all. Once one channel reaches the ceiling the recorded hue rotates by as much as sixty-seven degrees, with nothing in the scene having changed colour — and every response a converter can make to that is an invention.

imaging · Capture
How wrong a profile is between its entries. A device profile is a lattice of measured patches and an interpolation. At every node of every grid drawn here the error is exactly zero, which is why a profile checked at its own patches always looks perfect. Sampled between the nodes, a 3-step grid is worst by ΔE00 = 2.93 and a 17-step grid by 0.30. Both are honest tables of the same press.

A profile is a table

An ICC profile does not contain a model of the device it describes. It contains a lattice of patches that were printed and measured, and everything between them is interpolation — which is exactly zero at every patch, so a profile checked against its own target reports perfection for ever.
applied · Delivery
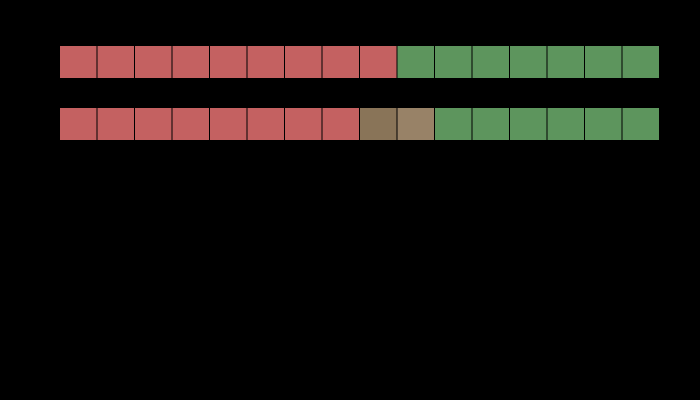
An edge at 4:2:2, and the colour it arrives as. Above, the row as it was sent and as it arrives after the two chroma planes are averaged 2 samples at a time. Below, the colour difference at each sample. The worst is ΔE00 = 25.88, at a luma step of 0.058 across the edge — an edge of nearly equal luminance. Nothing is wrong with the codec: it discards the differences the eye resolves worst, and this edge is made of nothing else.

Colour thrown away on purpose

Every video format in use discards three quarters of its colour information and keeps all of its luminance, because the eye resolves fine colour detail badly. On an edge that carries luminance the loss is exactly zero. On an edge of nearly equal luminance it is a colour difference of forty-three, and the two edges are the same edge to the codec.

applied · Delivery
A 8-bit ramp from 0.0008 to 0.006 of white, 12° wide. The top strip is the ramp as delivered: 16 distinct levels, each a step of one code value. Below it is the quantisation error as a Weber contrast against the local luminance, filtered by the luminance sensitivity function. The largest response is 8.51 per cent contrast against a threshold of 0.3, which is 28.4 times over — and it occurs at 0.09 per cent of white, at the dark end, because a code step is a Weber contrast and the same step is a larger fraction of less light.

Banding is not a bit depth

Eight bits bands at thirty times threshold in the shadows and at under three at mid grey, on the same ramp with the same encoding. What decides is where in the tone scale the gradient sits, how sharp each step's edge is, and how far away the reader is — and a bit count contains none of the three.

limits · Limits
What a dither mask is worth, read as components, in two dimensions. Five luminance ramps, each quantised to 8 bits with and without a high-passed mask of the same power. The bars are the most visible single sinusoidal component of the error, as a multiple of the contrast that component needs to be seen: above the line at one it is visible. The mask lowers it by 20–22×, on every ramp — which the one-dimensional model on this site says it does not, and that disagreement is the finding.

Every threshold was measured with a grating

An earlier essay here claimed that the model cannot explain why dither works, and named two missing pieces. One of them was real and worth thirteen times the guess; the other was not needed. The piece nobody named was the detector — and reading the same model two ways changes the answer by a factor of fifty.

limits · Limits
Every filtered claim in these essays, read at a point and read as components. Each row is a comparison one of the essays makes. The bar is the ratio between the two readings — how many times larger the component answer is than the point answer, or the reverse — on a logarithmic scale. 5 of 7 disagree by more than half again, and 4 disagree about the direction of the effect rather than merely its size. The three marked as noisy are the ones with a noise field on one side of the comparison, and they are the three largest.

The list nobody made

The last phase found that reading a filtered signal at a point asks a question its thresholds were never fitted to, made it a standing rule, and admitted that nobody had gone back through the site to see which claims it touched. Here is the list. Every claim with noise on one side of it moves — and so do two that have no noise in them at all, which the rule said would not.

limits · Limits
One edge magnified four times, three ways: text on a page. A step between the two colours of text on a page, magnified four times by linear interpolation, by bicubic and by a three-lobe Lanczos kernel, once on the stored values and once on the light. The curves are the stored-value result's lightness minus the light's, sample by sample across the edge; below the line the stored-value resize is darker. Linear interpolation is darker everywhere it differs. The two kernels with negative lobes swing above the line beside the edge, where their negative weights fall — bicubic by up to 1.8 colour differences and Lanczos by 3.7.

A resize with a negative weight in it

A blend taken on stored values is always darker than the blend of the light, because the encoding is concave and a convex combination of a concave function's values lies below the function of the combination. A bicubic or Lanczos resize is not a convex combination. Beside an edge its negative weights make the stored-value result lighter than the light's own — by up to 6.1 colour differences with bicubic and 12.2 with Lanczos on skin against its shadow — and on edges between full-scale values the clip hides the overshoot and the old guarantee appears to hold.

applied · Delivery

Named alongside it

The objects these essays reach for when they reach for this one.

ThresholdTransfer functionSpatial frequencyBandingCamera rawContrast sensitivityDitherSamplingSpecificationTone curveAliasingCIELAB

All concepts