Theme

The thread: The instrument is the reader — page 3

This is the one subject where the page is displayed on the apparatus under discussion, and the reader's own eye is the measuring device. Several figures here are experiments rather than illustrations.
A 100 hertz drive, and whether anybody sees it. 3 cycles of a 100 hertz drive at 100 per cent modulation. The number beside each is how far above the threshold for seen flicker its loudest harmonic sits: above one and a stationary observer sees the flutter, below it and only something moving does. Fusion is at 60 Hz at 100 cd/m², and moves 12.5 Hz for every decade of light. What light is

A lamp has a waveform

A lamp modulating a thousand times a second is a hundred times past the frequency at which flicker fuses, and it is plainly visible — as a dotted trail, during any glance across the room. The reason is not a new measurement; it is the spatial contrast sensitivity function, arriving from an unfamiliar direction.

How often two colour-difference formulae disagree about which pair is worse. Pairs of colours sampled in CIELAB, compared two at a time. A rank inversion is a case where one formula calls pair A worse and the other calls pair B worse; no monotone rescaling of either can remove one. The left bar of each group is the rate over the whole space and the right bar is the rate among pairs sitting near a tolerance of ΔE 1, where the decision is actually made — and it is between 35 and 44 per cent, against a coin flip at fifty. Difference and uniformity

Which of two is worse

Two colour-difference formulae disagree about which of two pairs is the larger difference in thirteen per cent of comparisons overall — and in forty-three per cent of comparisons among pairs sitting near a tolerance of one unit, which is where every acceptance decision is actually made.
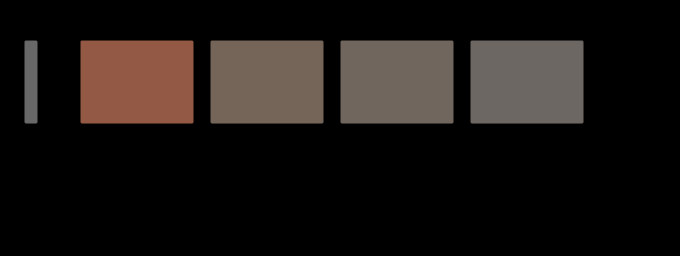
One colour difference, at four places in the visual field. The same pair of colours — ΔE00 22.0 at the fovea — with each of its three components divided by that channel's own threshold scaling at the stated eccentricity. What is left at 20° is 4.4, and its hue has turned by 26 degrees, because the red–green part is divided by more than the blue–yellow part. The swatches are the predicted colours, drawn where a reader will look straight at them; the figure states a prediction it cannot stage. Difference and uniformity

A difference has no place

A colour difference formula answers a question about two patches somebody is looking straight at. Move the same pair ten degrees into the periphery and a third of it is left — and it has turned twenty-four degrees of hue, because the three channels give out at three different rates.

The eye's own drift, and what it does to every spatial frequency. A pattern of f cycles per degree, drifting across the retina at 0.5 degrees a second, arrives at each receptor at f × 0.5 hertz. The curve is the temporal sensitivity at that rate, against the pattern's spatial frequency. Every frequency the eye can resolve stays above a quarter of the temporal peak, and the band of drift speeds for which that holds is 0.02–0.71 degrees a second — with the measured drift inside it. Faster and the finest detail is carried past 60 hertz, where there is no sensitivity at all. What the brain does

The eye is never still

A perfectly stabilised retinal image disappears within seconds. What keeps the world there is a drift of about half a degree a second between the microsaccades — fast enough to keep the finest detail modulating and slow enough not to carry it past fusion, in a band whose upper edge is at 0.71 degrees a second.
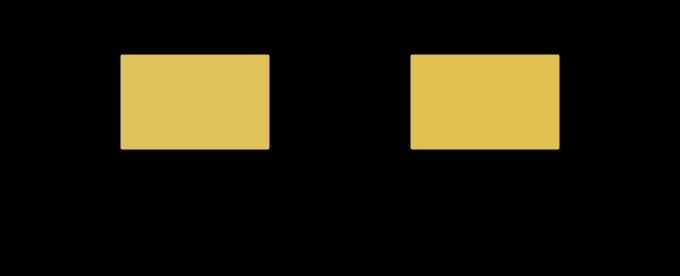
One light, two eyes. The same stimulus through two sets of ocular media differing only in macular pigment (0.35 and 0.41) and lens age (55 and 55 years). Compared under one white the two differ by ΔE00 1.00; compared with each eye adapted to its own long-run white — which is what the visual system does — by 0.00. The second number is why nobody notices, and the first is why a person who has had one lens replaced reports that the other eye has turned yellow. Where the model breaks

Nobody here has two eyes

One person's two eyes differ in macular pigment and lens density, so the same light produces two colours — a whole ΔE00 apart for an ordinary pair, seven for one replaced lens. Adaptation hides it exactly, which is why nobody notices and why nothing in colorimetry has a term for it.

What a dither mask is worth, read as components, in two dimensions. Five luminance ramps, each quantised to 8 bits with and without a high-passed mask of the same power. The bars are the most visible single sinusoidal component of the error, as a multiple of the contrast that component needs to be seen: above the line at one it is visible. The mask lowers it by 20–22×, on every ramp — which the one-dimensional model on this site says it does not, and that disagreement is the finding. Where the model breaks

Every threshold was measured with a grating

An earlier essay here claimed that the model cannot explain why dither works, and named two missing pieces. One of them was real and worth thirteen times the guess; the other was not needed. The piece nobody named was the detector — and reading the same model two ways changes the answer by a factor of fifty.

A halftone tint away from the centre of gaze, two ways. The upper curve raises the threshold by the E2 rule and leaves the filter alone, which is the multiplication the last phase guessed at. The lower one also moves the cutoff, because eccentricity magnifies the whole spatial scale — implemented as the substitution that makes it exact, a screen of ruling r seen through a filter whose cutoff has been divided by s being a screen of ruling r·s seen at the fovea. The horizontal line is threshold. The screen is visible where you are looking and gone by 3°, while the product prediction has it visible across the whole page. Difference and uniformity

A tint at the edge of a page

The last phase left this join open and guessed at its answer — how visible a halftone tint is away from the centre of gaze should be the product of two effects it had measured separately. It is not the product. At five degrees the guess is fifty-three times too generous, and by twenty it is out by eight orders of magnitude.

The drift window, asked about each channel in turn. Every spatial frequency a channel can resolve, drifting at v degrees a second, arrives at f × v hertz; the bar is the range of v over which all of them stay above a quarter of that channel's temporal peak. The luminance band is closed at both ends — 0.018 to 0.71 degrees a second — because its temporal sensitivity has a dip at zero to fall into. The chromatic bands have no slow edge at all, because chromatic temporal sensitivity is low-pass: a stationary chromatic pattern sits at the top of its own sensitivity. The mark is the measured drift, and it is inside all three. What the eye does

The drift is a luminance mechanism

The eye's own drift was shown to sit inside a band of speeds that keeps every spatial frequency modulating, and the band was quoted as though it were about vision. Asked about colour, it has no slow edge at all — a stationary chromatic pattern needs no eye movement whatever. And a stabilised chromatic pattern is the first thing to fade.

Every filtered claim in these essays, read at a point and read as components. Each row is a comparison one of the essays makes. The bar is the ratio between the two readings — how many times larger the component answer is than the point answer, or the reverse — on a logarithmic scale. 5 of 7 disagree by more than half again, and 4 disagree about the direction of the effect rather than merely its size. The three marked as noisy are the ones with a noise field on one side of the comparison, and they are the three largest. Where the model breaks

The list nobody made

The last phase found that reading a filtered signal at a point asks a question its thresholds were never fitted to, made it a standing rule, and admitted that nobody had gone back through the site to see which claims it touched. Here is the list. Every claim with noise on one side of it moves — and so do two that have no noise in them at all, which the rule said would not.

A lamp switched on, and what it is still doing minutes later. The junction warms from ambient to 80 °C with a time constant of 150 seconds, and three quoted slopes act as it does: the die's peak moves, the die loses efficiency, and the converter loses quantum yield. The output falls 25 per cent and the colour moves ΔE00 2.6. Nine tenths of the way takes 405 seconds. The vertical mark is the eye's own slow adaptation constant, 60 seconds, for scale. What light is

A lamp switched on is not the lamp measured

A luminaire takes about seven minutes to reach nine tenths of its working temperature, loses a quarter of its output on the way, and moves ΔE00 2.6 while it does. That is slower than every clock in the eye — so for the first minutes after a switch is thrown, both ends of the measurement are moving, and every appearance claim here has assumed one of them was still.

Where a pooled gain gives out, against where the eye does. The falling curve is how much of a pattern of each spatial frequency a local adaptation pool of 0.5° can see — and therefore how much of it a settled eye can cancel. It is half gone by 0.37 cycles per degree, which is a feature about 2.7° across. The three marks are the acuity limits of the luminance channel and the two chromatic ones. Every one of them is more than an order of magnitude finer than the pool, which is why a stabilised eye loses the fill of a picture and keeps its outline rather than losing the picture. What the eye does

What a still eye stops seeing

A stabilised image is said to vanish, and nothing in a temporal filter predicts it — sensitivity at zero frequency is a quarter of the peak, not nothing. Give the adaptation gain a size and the answer falls out — fading is a high-pass filter that switches on over a minute, it takes the fill and leaves the outline, and a patch has to be about two degrees across before it goes at all.
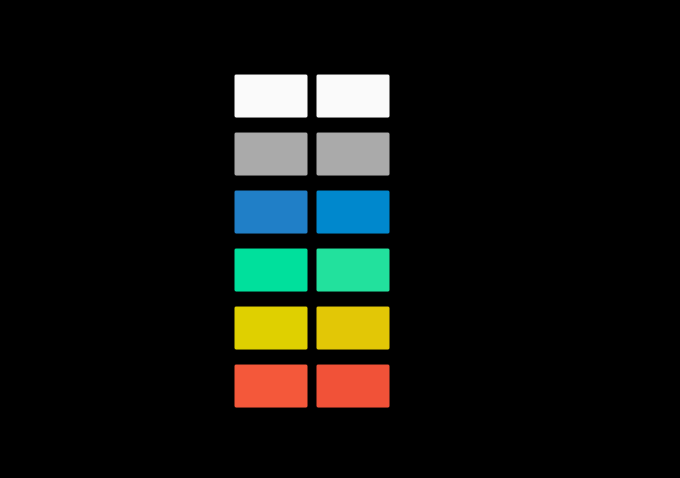
What the same eye reports about one field, in the middle and at the edge. Each row is a uniform field, drawn at the most saturated version of itself this page can show — the percentage is how much of the full stimulus survived, the rest being the adapting light added to bring it inside the gamut. The left patch is what the centre of gaze reports and the right one what 10 degrees out reports, each adapted to the same light as that position sees it. The adapting white comes out identical to 5e-13, because an adapted eye cancels its own filter exactly. Nothing else does, and the largest difference is in the blue. tungsten light is not drawn: it cannot be shown at any useful saturation, and at full strength it differs by ΔE00 1.87. What the eye does

One person is two observers

The macular pigment is a yellow screen over the fovea and nowhere else, so a cone at the centre of gaze and a cone ten degrees away have different colour-matching functions in the same eye. A match made in the middle comes apart at the edge by six units — and fitting one filter to the gap between the CIE's two standard observers gives a density of 0.40 against a measured 0.35.

A colour rendering index, computed for everybody instead of for one observer. Each bar spans what 120 eyes make of one lamp: the same reflectances, the same reference illuminant, the same arithmetic, different colour-matching functions. The mark is the standard observer's own answer, which is the number printed on the box. One lamp's spread is 3.8 points wide while the whole range the standard observer puts these lamps in is 1.8 — so a ranking quoted to a tenth of a point is a statement about one set of tables. Two of the marks fall outside the population's range entirely. What light is

The index is one observer's opinion

A colour rendering index is printed to a tenth of a point and computed for a single set of colour-matching functions that no standard names as a choice. Scored by two hundred eyes instead, one lamp's spread is wider than the whole range the standard observer puts five lamps in — and two lamps the standard separates by four tenths of a point come out the other way round for every member of the population.

One tolerance decision, about pairs that agree less and less about the spectrum. Every point is a pair of samples that the reference observer reports as exactly ΔE00 1.0 apart — the same number, the same decision, the same line in the same specification. Along the axis is how far apart their two reflectances are. Up the side is the 95th percentile of what two hundred other eyes report. It runs from 1.13 to 2.32. The document records the horizontal line and not the axis it is plotted against. Difference and uniformity

A tolerance needs a second number

Two samples one colour difference apart can be read almost identically by everybody or two units apart by the worst-off twentieth, and which of those it is depends on how far apart their spectra are — a quantity every spectrophotometer has already measured and none of them prints. Adding it as a second field predicts the population three times better, and at the tolerances where it matters it is right about a third of the decisions the difference alone gets wrong.

How fine a screen each channel can see. A halftone screen at 35 per cent coverage, 45 degrees, seen by each of the eye's three spatial channels. The bar is the ruling at which it drops below that channel's own threshold. The luminance channel is still seeing it at 55 cycles per degree; the two chromatic ones have lost it by 15 and 10. The dashed line is an ordinary press ruling at reading distance, and only one channel is above it. A halftone is a luminance object, which is why the ink whose dots are nearly the lightness of the paper is the one nobody worries about. Difference and uniformity

A halftone is a luminance object

The eye's three spatial channels resolve a screen at 55, 15 and 10 cycles per degree, so at any ruling a press actually runs only one of them can see it at all. The corollary corrects a guess already published here — rotating a screen matters more to the chromatic channels, not less — but only at rulings so coarse that nobody prints there.

How wrong a camera profile is, and who it is wrong for. A colour matrix fitted against the 1931 observer, evaluated four ways. Its residual against that observer is ΔE00 0.92 — the Luther failure, which is a property of the sensor and is the honest measurement of the camera. Against a person drawn from a population of 160, the worst-off twentieth report 3.35. And a camera with no spectral error whatever, reporting the standard observer's own tristimulus values exactly, would leave 3.47. The camera is not the problem. It was fitted to somebody who does not exist, and so is the standard it was fitted against. What a camera does

Fitted to an eye nobody has

A camera profile's residual against the observer it was fitted to is under a unit, and that is the number everybody quotes. Against a person drawn from a population it is 3.35 at the ninety-fifth percentile — and a camera with no spectral error whatever, reporting the standard observer's tristimulus values exactly, would carry 3.47. The camera is not the problem.

The same flicker, written across the frame. A rolling shutter exposes each row of the sensor at a different moment, so a lamp that flickers above fusion is recorded as bands. There are 1.7 of them here — the readout time times the lamp's frequency, which is a camera setting and not a property of the light — spanning 2.37 stops. Held at matched luminance the lightest band and the darkest are still ΔE00 5.40 apart in colour, because the two drive currents are two spectra and the shutter caught one of each. What a camera does

The shutter samples the lamp

A lamp switched between two drive currents at a hundred hertz is one steady colour to a person and two spectra to a camera. A thousandth-of-a-second exposure catches whichever phase the shutter opened at — two and a third stops of exposure and five units of colour, decided by nothing but timing — and a rolling shutter writes the difference across the frame as bands.

A viewing booth is a lamp, and a lamp has an angle. The same sample at five positions across a booth's plane, with the lamp 55 centimetres above it. The curve is how far each position is from the middle, in the units the judgement is made in. It reaches ΔE00 2.40 against a tolerance of 1, while the illuminance uniformity — the quantity the standard actually bounds — never falls below 73 per cent and stays comfortably inside it. The flat trace is the same booth with a source whose converter is the same thickness in every direction: ΔE00 0e+0, exactly, by construction. What it takes to deliver it

The booth is a luminaire

A standard viewing booth is specified by its light's chromaticity, its rendering and the uniformity of its illuminance across the sample plane. Illuminance is a photometric integral, so two positions can be inside the uniformity tolerance and lit by two different spectra — and a sample at the far corner of a compliant booth is ΔE00 2.4 from one in the middle, against a tolerance of one.

What a halftone measures, against what it looks like. A 50 per cent screen, measured by an aperture that averages the patch and seen by an eye that blurs it first and compresses afterwards. At a coarse ruling the two disagree by ΔE00 11.1, and the patch looks 14.3 lightness units darker than it measures — the average of a concave function is below the function of the average, which is Jensen's inequality and not an illusion. The gap falls under a unit above 30 cycles per degree. That is a viewing distance, and the correction a press applies for dot gain has no distance in it anywhere. What it takes to deliver it

Measured with an aperture, seen with an eye

A spectrophotometer averages a halftone patch and reports one reflectance. An eye blurs it first and compresses afterwards, and the average of a concave function is below the function of the average — so a resolvable screen looks darker than it measures, by fourteen lightness units at a coarse ruling and by nothing at a fine one. The correction a press applies is the same size and has no viewing distance in it.

Every claim here that was computed with one model, recomputed with two. Each row is a claim one of these essays makes. The bar is how many times the two-model answer differs from the one-model answer, on a logarithmic scale. 3 of 13 have no bar at all: the first model's answer for them is exactly zero, not because it computed zero but because it has no variable for the quantity. Those are the rows where a second model did not correct an answer — it supplied one. Where the model breaks

What a second model changed

Thirteen claims here, each computed with one model and recomputed with two. Ten of them move by half again or more. Three of them do not move at all in the ordinary sense — the first model's answer is exactly zero, not because it computed zero but because it has no variable for the quantity — and every one of those three is a join that supplied a state or a device rather than a spread.

The same census, sorted by where the change of light came from. Each row is a change of illumination. The pale bar is how far it moves an ordinary surface for an observer who does not adapt; the solid bar at its left end is what is left after the observer has applied the one gain adaptation gives them, which is the ratio of the two whites in the CAT16 basis and is not fitted to anything. Sorted by where the change came from. The two kinds of light that existed before electricity sit at the top and leave the smallest share of themselves behind; the discharge lamps are worse, and the worst of them is d65 to a triphosphor tube at 33 per cent. What light is

Which lamp changes are free

The changes of light that existed before electricity commute with one another to a couple of parts in a thousand, so one set of axes handles all of them. The lights the lighting industry invented do not, and the worst pair in the census is seventy-six times further from commuting than the best.

The basis a camera balances in is a different basis for every light. A camera's white balance is a per-channel gain on raw values, which is a von Kries adaptation in whatever basis the filter dyes give it. That basis is not a property of the dyes alone: it is the dyes and the light in the room, and it moves when the light does. Each bar is how far the basis has turned, in degrees, from where it sits under D65. A sensor satisfying the Luther condition would have a bar of exactly zero on every row, because for such a sensor the light cancels — which is the one property nobody buys a sensor for. What a camera does

A camera balances in another basis

White balance is a per-channel gain on raw values, which makes it a von Kries adaptation in whatever axes the filter dyes happen to give. Those axes are not a property of the dyes alone — they move with the light, by up to seventeen degrees across the adaptation census — and the sensor for which they would not move is the one that adapts worst of all.

Media-relative colorimetry is a von Kries adaptation in the worst basis there is. Changing the paper is a change of the light reaching the reader, and the rule colour management uses for it — divide the tristimulus values by the substrate's — is a gain applied in XYZ. That is the one transform the table here describes as the oldest mistake still shipping. On the three stocks a press actually uses the penalty is real and small, because a sheet of paper-mill white is the smoothest change of light in the census. On blue it is 10.2 times the residual the same rule would leave in a cone basis. What it takes to deliver it

Dividing by the paper

Media-relative colorimetry divides tristimulus values by the substrate's, which is a von Kries adaptation applied in XYZ — the one basis the table here describes as the oldest mistake still shipping. On a paper-mill white it costs a few hundredths of a unit. On a tinted sheet it costs ten times what the same rule costs in a cone basis.

The same twenty-four samples, measured two standard ways. How far apart a 45°/0° instrument and a sphere with its gloss port closed are, on samples running from three per cent reflectance to seventy. The whole of the difference is the interface reflection — four per cent of the light, returned without ever meeting a pigment, thrown away by one geometry and collected by the other. It is the same four points in every row, which is why the disagreement is a property of how dark the sample is rather than of what colour it is: ΔE00 8.7 on the darkest samples against 1.93 on the lightest. Matching and measuring

An instrument has a geometry

Every reflectance here arrives through a model with a bandpass, a sampling interval and no position at all. Real instruments say where they were standing, and the two standard answers disagree by ΔE00 8.35 on a dark gloss sample — a difference that adds rather than multiplies, and that no adaptation removes.

258 essays on this thread, page 3 of 11 · all threads · all essays