Theme

The thread: Computed, not quoted — page 6

Every swatch begins as a spectral power distribution and is carried through the colour-matching functions as it is drawn. None is a hex code recalled from a table.
One tolerance decision, at four spectral distances. Every column is a pair of samples ΔE00 1.0 apart for the observer a colorimeter models — solved to that value by bisection, so the instrument would report the same number for all four. What differs is how far apart the two spectra are, which is achieved by adding a metameric black the reference observer cannot see. The bands are what two hundred people report: from 1.13 at the ninety-fifth percentile when the spectra are the same shape to 2.32 when they are not, and the worst case reaches 3.7. No specification records the quantity on the horizontal axis. Difference and uniformity

A tolerance is a probability

A colorimeter reports one number and a specification compares it with another, and both are computed for an observer who does not exist. Handed to two hundred people, the same pair at ΔE00 1.0 is read from 0.8 to 3.7 — and which of those two ranges applies depends on something no specification records.

The three constants a specification does not quote. ΔE2000 is defined with three parametric factors in it — kL, kC and kH — which the CIE leaves to the industry using the formula rather than fixing. Graphic arts uses ones throughout; the textile standard weighs lightness at half, which is kL = 2. Applied to 4000 pairs at a tolerance of 1, the two settings accept 46 and 75 per cent, and 29 per cent of pairs change verdict — a larger disagreement than any between the formulae themselves. The reference conditions the ones assume are diffuse illumination at 1000 lux, a mid-grey surround, samples abutting, subtending over four degrees, differing by under five units, with no visible texture. Difference and uniformity

Three constants nobody quotes

CIEDE2000 is defined with three parametric factors in it, the CIE leaves them to the industry using the formula, and the two settings in ordinary use differ by a factor of two in one of them. Twenty-nine per cent of acceptance decisions change between the two — a larger disagreement than any between the formulae themselves.

Which of two reproductions is better depends on which statistic is asked. A specification for a proof or a print run is written against a set and has to reduce the set to one number. Here are two candidates: the one with the lower mean has the higher ninety-fifth percentile, so the mean prefers A and the tail prefers B. Across 2000 pairs of candidates generated the same way, the two statistics disagree about the winner 30 per cent of the time. Both numbers are honest; only one of them is what somebody notices. Difference and uniformity

A mean is not a difference

A specification for a proof, a profile or a print run is written against a set of colours and has to reduce that set to one number. The mean and the ninety-fifth percentile disagree about which of two reproductions is better in thirty per cent of cases, and both numbers are honest.

A halftone tint away from the centre of gaze, two ways. The upper curve raises the threshold by the E2 rule and leaves the filter alone, which is the multiplication the last phase guessed at. The lower one also moves the cutoff, because eccentricity magnifies the whole spatial scale — implemented as the substitution that makes it exact, a screen of ruling r seen through a filter whose cutoff has been divided by s being a screen of ruling r·s seen at the fovea. The horizontal line is threshold. The screen is visible where you are looking and gone by 3°, while the product prediction has it visible across the whole page. Difference and uniformity

A tint at the edge of a page

The last phase left this join open and guessed at its answer — how visible a halftone tint is away from the centre of gaze should be the product of two effects it had measured separately. It is not the product. At five degrees the guess is fifty-three times too generous, and by twenty it is out by eight orders of magnitude.

The drift window, asked about each channel in turn. Every spatial frequency a channel can resolve, drifting at v degrees a second, arrives at f × v hertz; the bar is the range of v over which all of them stay above a quarter of that channel's temporal peak. The luminance band is closed at both ends — 0.018 to 0.71 degrees a second — because its temporal sensitivity has a dip at zero to fall into. The chromatic bands have no slow edge at all, because chromatic temporal sensitivity is low-pass: a stationary chromatic pattern sits at the top of its own sensitivity. The mark is the measured drift, and it is inside all three. What the eye does

The drift is a luminance mechanism

The eye's own drift was shown to sit inside a band of speeds that keeps every spatial frequency modulating, and the band was quoted as though it were about vision. Asked about colour, it has no slow edge at all — a stationary chromatic pattern needs no eye movement whatever. And a stabilised chromatic pattern is the first thing to fade.

Coming back from a bleach, against the clock already measured. A 94 per cent bleach, and the pigment returning at its own time constant of 120 seconds. The lower curve is the site's slow neural adaptation constant, 60 seconds, started from the same place — it is finished while the chemistry is barely half done. Regeneration does not speed up because the light went away: the rate constant is the same one it always was, which is why the recovery is slow while the bleaching was fast. What the eye does

The slowest clock is chemical

An earlier essay here joined the afterimage to the adaptation clock and named what was still missing — a third gain, upstream of both, in the pigment itself. It is twice as slow as anything measured before it, it leaves a coloured after-tint from a white field, and at steady state it cancels exactly, which is why nobody has ever needed to model it.

Every filtered claim in these essays, read at a point and read as components. Each row is a comparison one of the essays makes. The bar is the ratio between the two readings — how many times larger the component answer is than the point answer, or the reverse — on a logarithmic scale. 5 of 7 disagree by more than half again, and 4 disagree about the direction of the effect rather than merely its size. The three marked as noisy are the ones with a noise field on one side of the comparison, and they are the three largest. Where the model breaks

The list nobody made

The last phase found that reading a filtered signal at a point asks a question its thresholds were never fitted to, made it a standing rule, and admitted that nobody had gone back through the site to see which claims it touched. Here is the list. Every claim with noise on one side of it moves — and so do two that have no noise in them at all, which the rule said would not.
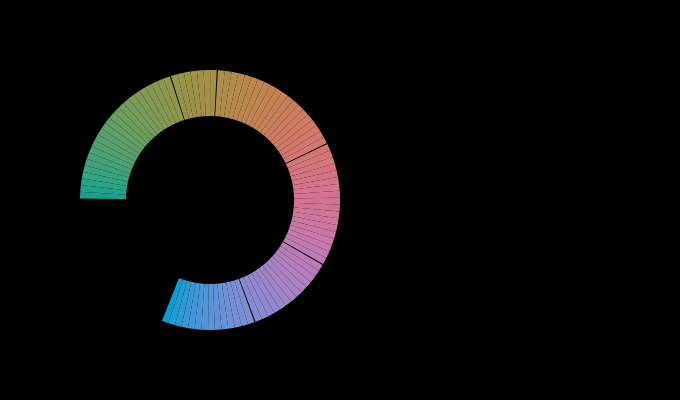
The hue circle cut into names, at L 60 and C 40. Left, the arcs each name claims, drawn at the colour of their midpoints; right, the same arcs measured in ΔE00 by integrating the difference along the ring rather than in degrees. The widest is 5.3 times the narrowest in degrees and 4.5 times in colour difference, so the metric accounts for 15 per cent of the inequality and no more. Only the eight chromatic terms compete on this ring: at this chroma the achromatic three would otherwise take the region where no basic English term sits, which is a defect of the model and is named in the essay. Where the model breaks

There is no word for that colour

The naming model built this phase gives a saturated cyan the name green, calls part of a chromatic ring grey, and puts one of the eleven focal colours outside what a display can show. Each failure is a measurement rather than a disclaimer, and together they say what a vocabulary is that eleven points and a distance are not.

The colour of a beam, against the angle it leaves at. A conformal converter — an even layer laid straight onto the die — makes light leaving at θ cross 1/cos θ times as much of it, so it is more completely converted and the beam is warmer at its edge. From the axis to 75° the correlated colour temperature falls by 556 K and the whole difference is ΔE00 16.4. The flat line is the same emitters under a dome, whose path length is the same in every direction by construction: no angular colour at all, exactly, which is what a remote converter is sold for. What light is

A lamp has a direction

A white LED is a blue die under a converter, and light leaving at an angle has travelled further through the converter than light leaving straight up. So the mixture is different in every direction, the beam is bluer in the middle than at its edge, and the number on the box is one direction's worth of a device that has no single colour.

Dimmed to a fiftieth, three ways. Switching a lamp on and off faster than anyone can see scales the spectrum and changes nothing else, so its colour temperature is a horizontal line and its chromaticity moves by 7.3e-14 ΔE00 — exactly, to floating point. Reducing the drive current moves the die's peak and cools the junction, which moves the mixture: ΔE00 3.5 across the range. A filament has no spectrum of its own to move; it is a blackbody at whatever temperature the power leaves it at, and it falls 1672 K. Three methods, one instruction, three colours. What light is

Three ways to dim a lamp

"Dimmed to ten per cent" names three different colours. Switching the lamp on and off faster than anybody can see changes the chromaticity by nothing at all — exactly, to floating point. Reducing the current moves it a few units. Reducing the power to a filament moves it eighteen hundred kelvin down the Planckian locus, and stays on the locus exactly the whole way.

A lamp switched on, and what it is still doing minutes later. The junction warms from ambient to 80 °C with a time constant of 150 seconds, and three quoted slopes act as it does: the die's peak moves, the die loses efficiency, and the converter loses quantum yield. The output falls 25 per cent and the colour moves ΔE00 2.6. Nine tenths of the way takes 405 seconds. The vertical mark is the eye's own slow adaptation constant, 60 seconds, for scale. What light is

A lamp switched on is not the lamp measured

A luminaire takes about seven minutes to reach nine tenths of its working temperature, loses a quarter of its output on the way, and moves ΔE00 2.6 while it does. That is slower than every clock in the eye — so for the first minutes after a switch is thrown, both ends of the measurement are moving, and every appearance claim here has assumed one of them was still.

Where a pooled gain gives out, against where the eye does. The falling curve is how much of a pattern of each spatial frequency a local adaptation pool of 0.5° can see — and therefore how much of it a settled eye can cancel. It is half gone by 0.37 cycles per degree, which is a feature about 2.7° across. The three marks are the acuity limits of the luminance channel and the two chromatic ones. Every one of them is more than an order of magnitude finer than the pool, which is why a stabilised eye loses the fill of a picture and keeps its outline rather than losing the picture. What the eye does

What a still eye stops seeing

A stabilised image is said to vanish, and nothing in a temporal filter predicts it — sensitivity at zero frequency is a quarter of the peak, not nothing. Give the adaptation gain a size and the answer falls out — fading is a high-pass filter that switches on over a minute, it takes the fill and leaves the outline, and a patch has to be about two degrees across before it goes at all.
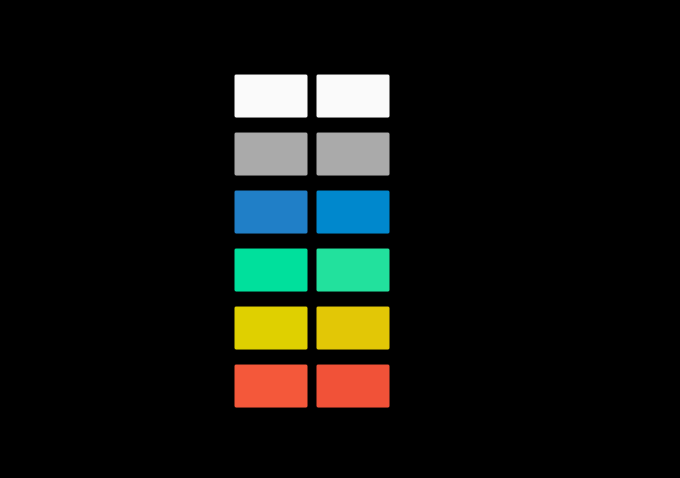
What the same eye reports about one field, in the middle and at the edge. Each row is a uniform field, drawn at the most saturated version of itself this page can show — the percentage is how much of the full stimulus survived, the rest being the adapting light added to bring it inside the gamut. The left patch is what the centre of gaze reports and the right one what 10 degrees out reports, each adapted to the same light as that position sees it. The adapting white comes out identical to 5e-13, because an adapted eye cancels its own filter exactly. Nothing else does, and the largest difference is in the blue. tungsten light is not drawn: it cannot be shown at any useful saturation, and at full strength it differs by ΔE00 1.87. What the eye does

One person is two observers

The macular pigment is a yellow screen over the fovea and nowhere else, so a cone at the centre of gaze and a cone ten degrees away have different colour-matching functions in the same eye. A match made in the middle comes apart at the edge by six units — and fitting one filter to the gap between the CIE's two standard observers gives a density of 0.40 against a measured 0.35.

A surface in a room, from the moment the light goes on. How far a blue surface is from the colour it will settle at, second by second, for an observer who walked in from the snow as the lamp was switched on. It starts ΔE00 27 away, is still 6.1 away after a minute — the point at which the eye is conventionally said to have adapted — and does not fall under a unit until 295 seconds. What light is

The room settles after the eye does

Four clocks run in a room and only three of them are in the observer. The slowest is the lamp, which takes four hundred seconds to reach nine tenths of its colour change — so a minute after the light goes on, when the eye is conventionally said to have settled, most of what is left is the lamp, and three quarters of that could not be adapted away by an observer of any speed.

A colour rendering index, computed for everybody instead of for one observer. Each bar spans what 120 eyes make of one lamp: the same reflectances, the same reference illuminant, the same arithmetic, different colour-matching functions. The mark is the standard observer's own answer, which is the number printed on the box. One lamp's spread is 3.8 points wide while the whole range the standard observer puts these lamps in is 1.8 — so a ranking quoted to a tenth of a point is a statement about one set of tables. Two of the marks fall outside the population's range entirely. What light is

The index is one observer's opinion

A colour rendering index is printed to a tenth of a point and computed for a single set of colour-matching functions that no standard names as a choice. Scored by two hundred eyes instead, one lamp's spread is wider than the whole range the standard observer puts five lamps in — and two lamps the standard separates by four tenths of a point come out the other way round for every member of the population.

What a fourth primary actually buys. All three displays are floating-point-exact matches for the reference observer, so no colorimeter can tell them apart. The bars are the 95th percentile of what two hundred other eyes report. Held to the same gamut floor of 1.4× sRGB, the four-primary design leaves the population 2.6 times closer together than the three-primary one. That is what the extra emitter is worth, and it is not more colour — the gamut is held fixed while it is measured. Matching and measuring

A fourth primary is a design

A display's fourth emitter is sold as more colour. Optimised instead against how far apart two hundred eyes are about its white — with the gamut held fixed so it cannot cheat — it buys agreement, and two and a half times closer together than three primaries reaching the same area, and the wavelengths it chooses are not the ones anybody would pick.

One tolerance decision, about pairs that agree less and less about the spectrum. Every point is a pair of samples that the reference observer reports as exactly ΔE00 1.0 apart — the same number, the same decision, the same line in the same specification. Along the axis is how far apart their two reflectances are. Up the side is the 95th percentile of what two hundred other eyes report. It runs from 1.13 to 2.32. The document records the horizontal line and not the axis it is plotted against. Difference and uniformity

A tolerance needs a second number

Two samples one colour difference apart can be read almost identically by everybody or two units apart by the worst-off twentieth, and which of those it is depends on how far apart their spectra are — a quantity every spectrophotometer has already measured and none of them prints. Adding it as a second field predicts the population three times better, and at the tolerances where it matters it is right about a third of the decisions the difference alone gets wrong.

How fine a screen each channel can see. A halftone screen at 35 per cent coverage, 45 degrees, seen by each of the eye's three spatial channels. The bar is the ruling at which it drops below that channel's own threshold. The luminance channel is still seeing it at 55 cycles per degree; the two chromatic ones have lost it by 15 and 10. The dashed line is an ordinary press ruling at reading distance, and only one channel is above it. A halftone is a luminance object, which is why the ink whose dots are nearly the lightness of the paper is the one nobody worries about. Difference and uniformity

A halftone is a luminance object

The eye's three spatial channels resolve a screen at 55, 15 and 10 cycles per degree, so at any ruling a press actually runs only one of them can see it at all. The corollary corrects a guess already published here — rotating a screen matters more to the chromatic channels, not less — but only at rulings so coarse that nobody prints there.

The appearance model's three rooms, read as three moments. CIECAM16's degree of adaptation is a function of the surround and the adapting luminance and of nothing else — the model has no time in it. Solving for the moment at which an observer who will adapt completely has got that far turns each of the three tabulated surrounds into a reading on a clock. At 100 candelas per square metre they are 106, 49, 21 seconds. They are presented as three rooms. They are also one observer, in one room, at three times in the first two minutes. What the brain does

A viewing condition is a moment

CIECAM16's degree of adaptation is a function of the surround and the adapting luminance and of nothing else, because the model has no time in it. Solving for when an observer who will adapt completely has got that far turns the standard's three surrounds into three clock readings — 107, 50 and 21 seconds — and the two readings are distinguishable by waiting.

How much of the gamut changes name, and what changed it. The eleven basic terms are quoted as centroids in CIELAB, and a colour is named by which one it is nearest. Two things nobody records decide the answer. Changing the distance function renames 20.5 per cent of the displayable gamut. Changing the room — the same colours, the same words, a different surround, through the appearance model — renames up to 26.8 per cent. The centroids were measured in one viewing condition and are applied here in every essay as though a name were a region of a space with no room in it. What the brain does

A name moves with the room

Eleven basic colour terms are quoted as centroids in CIELAB and a colour is named by which one it is nearest. Two things nobody records decide the answer — which distance function is used, which renames a fifth of the displayable gamut, and which room the colour is in, which renames more than a quarter of it.

How wrong a camera profile is, and who it is wrong for. A colour matrix fitted against the 1931 observer, evaluated four ways. Its residual against that observer is ΔE00 0.92 — the Luther failure, which is a property of the sensor and is the honest measurement of the camera. Against a person drawn from a population of 160, the worst-off twentieth report 3.35. And a camera with no spectral error whatever, reporting the standard observer's own tristimulus values exactly, would leave 3.47. The camera is not the problem. It was fitted to somebody who does not exist, and so is the standard it was fitted against. What a camera does

Fitted to an eye nobody has

A camera profile's residual against the observer it was fitted to is under a unit, and that is the number everybody quotes. Against a person drawn from a population it is 3.35 at the ninety-fifth percentile — and a camera with no spectral error whatever, reporting the standard observer's tristimulus values exactly, would carry 3.47. The camera is not the problem.

The same flicker, written across the frame. A rolling shutter exposes each row of the sensor at a different moment, so a lamp that flickers above fusion is recorded as bands. There are 1.7 of them here — the readout time times the lamp's frequency, which is a camera setting and not a property of the light — spanning 2.37 stops. Held at matched luminance the lightest band and the darkest are still ΔE00 5.40 apart in colour, because the two drive currents are two spectra and the shutter caught one of each. What a camera does

The shutter samples the lamp

A lamp switched between two drive currents at a hundred hertz is one steady colour to a person and two spectra to a camera. A thousandth-of-a-second exposure catches whichever phase the shutter opened at — two and a third stops of exposure and five units of colour, decided by nothing but timing — and a rolling shutter writes the difference across the frame as bands.

A viewing booth is a lamp, and a lamp has an angle. The same sample at five positions across a booth's plane, with the lamp 55 centimetres above it. The curve is how far each position is from the middle, in the units the judgement is made in. It reaches ΔE00 2.40 against a tolerance of 1, while the illuminance uniformity — the quantity the standard actually bounds — never falls below 73 per cent and stays comfortably inside it. The flat trace is the same booth with a source whose converter is the same thickness in every direction: ΔE00 0e+0, exactly, by construction. What it takes to deliver it

The booth is a luminaire

A standard viewing booth is specified by its light's chromaticity, its rendering and the uniformity of its illuminance across the sample plane. Illuminance is a photometric integral, so two positions can be inside the uniformity tolerance and lit by two different spectra — and a sample at the far corner of a compliant booth is ΔE00 2.4 from one in the middle, against a tolerance of one.

What a halftone measures, against what it looks like. A 50 per cent screen, measured by an aperture that averages the patch and seen by an eye that blurs it first and compresses afterwards. At a coarse ruling the two disagree by ΔE00 11.1, and the patch looks 14.3 lightness units darker than it measures — the average of a concave function is below the function of the average, which is Jensen's inequality and not an illusion. The gap falls under a unit above 30 cycles per degree. That is a viewing distance, and the correction a press applies for dot gain has no distance in it anywhere. What it takes to deliver it

Measured with an aperture, seen with an eye

A spectrophotometer averages a halftone patch and reports one reflectance. An eye blurs it first and compresses afterwards, and the average of a concave function is below the function of the average — so a resolvable screen looks darker than it measures, by fourteen lightness units at a coarse ruling and by nothing at a fine one. The correction a press applies is the same size and has no viewing distance in it.

463 essays on this thread, page 6 of 20 · all threads · all essays