Series

Metric — the series

53 essays on one idea, from the one that introduces it to the one that assumes the rest.
  1. Three colour-difference formulae, disagreeing. ΔE76, ΔE94 and ΔE2000 for the same 9 pairs of colours. The largest disagreement between ΔE76 and ΔE2000 here is 26.6 units — larger than the threshold usually quoted for a just-noticeable difference, so the choice of formula can decide whether two colours count as matching.

    How far apart are two colours

    ΔE is meant to be a distance with the property that the same number means the same perceived difference everywhere. Three successive formulae have tried, they disagree with each other by more than a just-noticeable difference, and the disagreement decides real matching questions.

    part 1 · difference
  2. MacAdam's discrimination ellipses, drawn 10 times actual size. Twenty-five ellipses of colours indistinguishable from their centres. They are drawn at 10× because at true scale most are thinner than a line. Their areas vary by a factor of 74, which is the whole result: a step of the same size in xy means very different things in different places.

    MacAdam measured it

    In a perceptually uniform space the just-noticeable-difference contours would be circles of equal size. MacAdam's ellipses are neither, by a factor of eighty — and transforming them into each candidate space settles which spaces improved matters and by how much.

    part 2 · difference
  3. The sRGB transfer function, and the gamma 2.2 curve it is not. Code value against relative luminance. The sRGB function is piecewise — a short linear segment near black, then a 2.4 power law with an offset — and it is close to but not the same as a plain 2.2 power law. Half-way along the axis of stored values sits at 21 per cent luminance, and half the luminance of white is at code 188.

    The midpoint is not half

    Code 128 sits halfway along the sRGB scale and carries about a fifth of white's luminance. Half the luminance is code 188. Almost every gradient, blur and resize on the web gets this wrong, and the errors are visible once known.

    part 2 · difference
  4. Threshold and suprathreshold contours, normalised to the same size. At five of MacAdam's centres: the measured just-noticeable-difference ellipse in grey and the ΔE2000 = 1 contour in gold, each scaled to the same mean radius so that only shape and orientation are being compared. A scale change preserves orientation exactly, so any rotation between the pair settles the question. They differ by 24° on average and by 70° at worst, and the ratio between their sizes varies 4.8-fold across the diagram — so no single factor turns one into the other.

    A threshold is not a unit

    MacAdam measured the smallest difference anyone could detect. ΔE2000 was fitted to how far apart plainly different colours look. The two are quoted interchangeably, and the contours they produce are not even the same shape.

    part 3 · difference
  5. A box tolerance and a ΔE tolerance around the same colour. A slice through CIELAB at L* 50, with the ΔE2000 = 1 contour traced point by point and a ±1 component box drawn over it. The contour is 2.1 times longer in one direction than the other, and the box is square. Of every sample either rule accepts, the two disagree about 74% — accepted by one specification and rejected by the other, on the same measurement.

    A tolerance is a shape

    A total colour difference below one, or every component within one — the two sound like the same requirement stated twice. They are different shapes, they disagree about most of what either accepts, and which one a supplier is held to is worth money.

    part 3 · difference
  6. Distinguishable colours in sRGB, counted under two difference formulae. The gamut volume divided by the volume of a ΔE = 1 ellipsoid, integrated over the solid because that ellipsoid changes size and orientation from place to place. Under the 1976 formula the answer is 195,720; under ΔE2000 it is 41,819 — 4.68 times fewer, from the same solid and the same lattice. Both assume perfect packing, which nothing achieves, so each is an upper bound rather than a count of anything. The gap between them is the result: "how many colours are there" is a question about a metric before it is a question about vision.

    How many colours are there

    Sixteen point seven million counts code values in a file format. Ten million distinguishable colours is a volume divided by the size of a just-noticeable difference — and the two difference formulae this site implements disagree about that size by a factor of nearly five.

    part 4 · difference
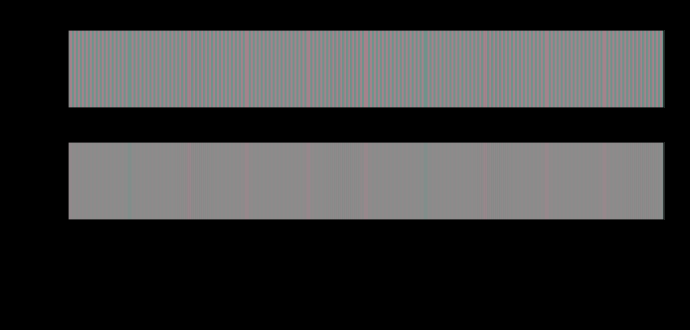
  7. A chromatic line screen at 10.0 cycles per degree. The upper strip is the pattern as delivered and the lower one is the same pattern after each opponent channel has been low-passed at its own cutoff. Against a flat field of the same mean, the delivered pattern differs by up to ΔE00 14.22 and the filtered one by 7.77 — a ratio of 1.8. Every number quoted elsewhere for a difference of this kind is the first one.

    A difference has no size

    A colour difference formula answers a question about two large patches seen side by side. Applied to a pattern, it reports fourteen units where the eye is left with less than one — and the ratio depends on nothing but how finely the difference is spread.

    part 4 · difference
  8. The three constants a specification does not quote. ΔE2000 is defined with three parametric factors in it — kL, kC and kH — which the CIE leaves to the industry using the formula rather than fixing. Graphic arts uses ones throughout; the textile standard weighs lightness at half, which is kL = 2. Applied to 4000 pairs at a tolerance of 1, the two settings accept 46 and 75 per cent, and 29 per cent of pairs change verdict — a larger disagreement than any between the formulae themselves. The reference conditions the ones assume are diffuse illumination at 1000 lux, a mid-grey surround, samples abutting, subtending over four degrees, differing by under five units, with no visible texture.

    Three constants nobody quotes

    CIEDE2000 is defined with three parametric factors in it, the CIE leaves them to the industry using the formula, and the two settings in ordinary use differ by a factor of two in one of them. Twenty-nine per cent of acceptance decisions change between the two — a larger disagreement than any between the formulae themselves.

    part 4 · difference
  9. The ΔE = 1 contour at points across the L* = 55 plane, magnified 14×. Each closed curve is the set of colours exactly one unit of difference from the dot at its centre, traced by bisection along 30 directions and drawn 14 times life size. Under ΔE2000 the contours run from 0.68 to 5.07 CIELAB units across this slice — a ratio of 7.44 — and they are not circles and not aligned with each other. A formula whose contours were circles of one radius everywhere would be claiming that CIELAB is uniform, which is what the 1976 formula claims and what the measurements refuse.

    Where the formula is not smooth

    A colour difference formula is a distance, and a distance ought to vary gently. CIEDE2000's does not everywhere — it carries a hue-rotation term with a hard edge in it, and the discontinuity sits where a great many industrial samples live.

    part 5 · difference
  10. The worst triple found, under ΔE2000. Three colours, plotted on the a–b plane of CIELAB. Going from a to c directly is 123.645; going via b is 60.528, which is 51.0 per cent shorter. A distance cannot behave that way, and this one is the formula every colour tolerance in industry is written in. The colours are far apart, which is where the violation is largest; the same search confined to tolerance scale finds a smaller one that has not gone away.

    A difference is not a distance

    Two earlier essays here said that CIEDE2000 violates the triangle inequality and left it at that. Searching for the violation finds a detour half the length of the direct route, a smaller one inside a five-unit ball, and a second defect nobody mentions — ΔE94 is not even symmetric.

    part 5 · difference
  11. How often two colour-difference formulae disagree about which pair is worse. Pairs of colours sampled in CIELAB, compared two at a time. A rank inversion is a case where one formula calls pair A worse and the other calls pair B worse; no monotone rescaling of either can remove one. The left bar of each group is the rate over the whole space and the right bar is the rate among pairs sitting near a tolerance of ΔE 1, where the decision is actually made — and it is between 35 and 44 per cent, against a coin flip at fifty.

    Which of two is worse

    Two colour-difference formulae disagree about which of two pairs is the larger difference in thirteen per cent of comparisons overall — and in forty-three per cent of comparisons among pairs sitting near a tolerance of one unit, which is where every acceptance decision is actually made.

    part 5 · difference
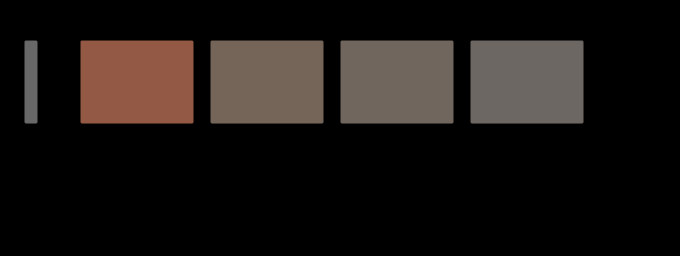
  12. One colour difference, at four places in the visual field. The same pair of colours — ΔE00 22.0 at the fovea — with each of its three components divided by that channel's own threshold scaling at the stated eccentricity. What is left at 20° is 4.4, and its hue has turned by 26 degrees, because the red–green part is divided by more than the blue–yellow part. The swatches are the predicted colours, drawn where a reader will look straight at them; the figure states a prediction it cannot stage.

    A difference has no place

    A colour difference formula answers a question about two patches somebody is looking straight at. Move the same pair ten degrees into the periphery and a third of it is left — and it has turned twenty-four degrees of hue, because the three channels give out at three different rates.

    part 5 · difference
  13. One tolerance decision, at four spectral distances. Every column is a pair of samples ΔE00 1.0 apart for the observer a colorimeter models — solved to that value by bisection, so the instrument would report the same number for all four. What differs is how far apart the two spectra are, which is achieved by adding a metameric black the reference observer cannot see. The bands are what two hundred people report: from 1.13 at the ninety-fifth percentile when the spectra are the same shape to 2.32 when they are not, and the worst case reaches 3.7. No specification records the quantity on the horizontal axis.

    A tolerance is a probability

    A colorimeter reports one number and a specification compares it with another, and both are computed for an observer who does not exist. Handed to two hundred people, the same pair at ΔE00 1.0 is read from 0.8 to 3.7 — and which of those two ranges applies depends on something no specification records.

    part 5 · difference
  14. Which of two reproductions is better depends on which statistic is asked. A specification for a proof or a print run is written against a set and has to reduce the set to one number. Here are two candidates: the one with the lower mean has the higher ninety-fifth percentile, so the mean prefers A and the tail prefers B. Across 2000 pairs of candidates generated the same way, the two statistics disagree about the winner 30 per cent of the time. Both numbers are honest; only one of them is what somebody notices.

    A mean is not a difference

    A specification for a proof, a profile or a print run is written against a set of colours and has to reduce that set to one number. The mean and the ninety-fifth percentile disagree about which of two reproductions is better in thirty per cent of cases, and both numbers are honest.

    part 5 · difference
  15. A halftone tint away from the centre of gaze, two ways. The upper curve raises the threshold by the E2 rule and leaves the filter alone, which is the multiplication the last phase guessed at. The lower one also moves the cutoff, because eccentricity magnifies the whole spatial scale — implemented as the substitution that makes it exact, a screen of ruling r seen through a filter whose cutoff has been divided by s being a screen of ruling r·s seen at the fovea. The horizontal line is threshold. The screen is visible where you are looking and gone by 3°, while the product prediction has it visible across the whole page.

    A tint at the edge of a page

    The last phase left this join open and guessed at its answer — how visible a halftone tint is away from the centre of gaze should be the product of two effects it had measured separately. It is not the product. At five degrees the guess is fifty-three times too generous, and by twenty it is out by eight orders of magnitude.

    part 6 · difference
  16. One tolerance decision, about pairs that agree less and less about the spectrum. Every point is a pair of samples that the reference observer reports as exactly ΔE00 1.0 apart — the same number, the same decision, the same line in the same specification. Along the axis is how far apart their two reflectances are. Up the side is the 95th percentile of what two hundred other eyes report. It runs from 1.13 to 2.32. The document records the horizontal line and not the axis it is plotted against.

    A tolerance needs a second number

    Two samples one colour difference apart can be read almost identically by everybody or two units apart by the worst-off twentieth, and which of those it is depends on how far apart their spectra are — a quantity every spectrophotometer has already measured and none of them prints. Adding it as a second field predicts the population three times better, and at the tolerances where it matters it is right about a third of the decisions the difference alone gets wrong.

    part 7 · difference
  17. How fine a screen each channel can see. A halftone screen at 35 per cent coverage, 45 degrees, seen by each of the eye's three spatial channels. The bar is the ruling at which it drops below that channel's own threshold. The luminance channel is still seeing it at 55 cycles per degree; the two chromatic ones have lost it by 15 and 10. The dashed line is an ordinary press ruling at reading distance, and only one channel is above it. A halftone is a luminance object, which is why the ink whose dots are nearly the lightness of the paper is the one nobody worries about.

    A halftone is a luminance object

    The eye's three spatial channels resolve a screen at 55, 15 and 10 cycles per degree, so at any ruling a press actually runs only one of them can see it at all. The corollary corrects a guess already published here — rotating a screen matters more to the chromatic channels, not less — but only at rulings so coarse that nobody prints there.

    part 7 · difference
  18. A tolerance of one unit, re-measured under every light in the census. Every one of the 23 pairs behind this figure is at exactly ΔE00 1.000 under D65 by construction. Each bar is what those same pairs measure under another light, after the observer has adapted to it: the line is the median and the bar spans the pairs. A tolerance is written as a property of a pair and it is not one — the light multiplies both members, and the difference between two products is not the product of the difference. The widest row is a lens at twenty against a lens at seventy, spanning 0.81 to 1.57.

    One unit in another room

    Twenty-three pairs built at exactly ΔE00 1.000 under D65, re-measured under every change of light this site models with the observer adapted to each, come out anywhere between 0.64 and 1.57. A tolerance is written as a property of a pair and it is a property of a pair and a room.

    part 8 · difference
  19. How much of a whiteness figure is the sheet, and how much is the lamp. Each bar is how many points of CIE whiteness a stock has above an unbrightened sheet of the same base, measured with an ultraviolet-included instrument. The dark part is what survives when the ultraviolet is removed — the part that is a property of the paper. On average 82 per cent of the scale is the pale part, which is a property of the instrument's lamp. A whiteness figure without a measurement condition beside it is therefore not a measurement of a sheet; it is a measurement of a sheet and a lamp, quoted as though it were the first.

    Whiteness is mostly the lamp

    The CIE whiteness formula ranks white samples the way people do, which is what it was built for and is not in question. What is in question is what it is a measurement of — take the ultraviolet out of the instrument and 82 per cent of the scale collapses, because the part that separates a premium sheet from an ordinary one was contributed by the lamp.

    part 8 · difference
  20. The best possible 3×3, and the patches it makes worse. Each row is one patch printed on a brightened sheet, measured under both conditions. The pale bar is how far apart the two measurements are; the dark bar is what is left after the best least-squares 3×3 over the whole set has been applied. It leaves 23 per cent of the mean, and — the part a mean hides — it makes 4 patches worse than doing nothing. The solids are the ones it damages: the ink blocks the ultraviolet, so a solid barely disagrees between the two conditions and the correction has no business touching it. A matrix has no way to apply itself only where the paper is showing.

    A tolerance cannot cross a condition

    If two measurement conditions disagree by seven units, the obvious repair is a correction matrix fitted between them. The best least-squares 3×3 over seventeen printed patches leaves 23 per cent of the disagreement and makes five patches worse than doing nothing — because the term it is trying to remove is proportional to how much paper is showing, and no linear map on three numbers can express that.

    part 8 · difference
  21. MacAdam's ellipses, drawn on one diagram. The twenty-five measured discrimination ellipses at 10× actual size, on CIE xy (1931). Mean axis ratio 2.95 — one would mean every contour is a circle — and a size spread of 10.42 between the largest and the smallest. Both numbers depend on the plane, which is why the 1976 revision existed; neither can be taken to one, which is why the revision did not finish the job.

    No diagram makes them circles

    Every chromaticity diagram is a projective picture of the same measurement, so how badly MacAdam's ellipses fail to be circles can be minimised over the whole family of them. The best plane there is still leaves the average ellipse twice as long as it is wide — which makes the residual a fact about the eye rather than about anybody's choice of primaries.

    part 9 · difference
  22. The same formula, applied after six different changes of basis. CIELAB's arithmetic — divide by a white, take a cube root, difference the results — run on six of the bases the matching data leave free. A linear change of basis leaves every match alone; a cube root does not commute with one, so the space, and therefore every colour difference computed in it, depends on which basis was in place before the nonlinearity. CIELAB's own choice gives an axis ratio of 3.44 and the best row here is LMS (confusion points) at 2.60.

    A difference needs a basis too

    A linear change of coordinates leaves every colour match exactly where it was. A cube root does not commute with one — so a lightness–chroma space, and every colour difference computed in it, is a property of the basis that happened to be in place before the nonlinearity. CIELAB's basis was chosen in 1931 for reasons that had nothing to do with difference.

    part 9 · difference
  23. Five answers to how far the ellipses are from circles. Five mean axis ratios on the same twenty-five measured ellipses, measured the same way in every row: the boundary points carried through, the longest radius over the shortest, averaged. What differs is which class of map is allowed. The first two rows are chromaticity diagrams, which divide by a sum; CIE xy as printed leaves 2.95 and the best diagram there is leaves 2.02. The last three are lightness–chroma spaces, which divide by a white point; CIELAB as specified leaves 3.44, the best space with no compression leaves 2.33, and the best space with a cube root in it leaves 1.61. Neither family contains the other, and only the last one gets below two.

    A compression goes below the floor

    Elsewhere this collection minimised the anisotropy of MacAdam's ellipses over every chromaticity diagram there is, found 2.02, and called the residual a property of the eye. It is a property of the eye seen through a projective picture. A cube root after the right basis reaches 1.61 on the same twenty-five ellipses.

    part 10 · difference
  24. The floor as a function of the exponent, and the fixed basis beside it. Two curves against the compression exponent on a logarithmic axis from 1 to 10. The lower curve is the best mean ellipse axis ratio any basis can reach with that exponent applied after it, and it falls from 2.33 at no compression to 1.66 at a square root and 1.61 at a cube root, then hardly moves — 1.57 at a tenth root. The upper curve is CIELAB's own basis at the same exponents and gets steadily worse, from 3.57 to 3.77. Almost everything a compression buys arrives with the first step away from linearity, and after that the exponent is choosing between 1.66 and 1.61 while the basis is choosing between 1.61 and 3.44.

    The exponent was never the argument

    A century of colour science has argued about whether the eye's response is a cube root, a square root or a logarithm. Minimise the anisotropy of MacAdam's ellipses over every basis, at each of eight exponents, and the floor moves by under three per cent between a cube root and a tenth root — while the basis moves it by a factor of two.

    part 10 · difference
  25. How wrong the ellipses would have to be for a pair to change places. One bar per adjacent pair in the uniformity table: the relative error on each ellipse's own axes at which that pair changes places in one draw in twenty. No error on the data is quoted anywhere — the question is inverted, so what is reported is how large an error would have to be, and a reader with an opinion about MacAdam's experiment can compare it with their own number. The nearest pair goes at 0.171; 2 of the 7 pairs do not reverse under any error this search covers.

    How wrong would the data have to be

    Twenty-five ellipses measured on one observer in 1942 are the ruler every colour space here is judged against, and they have never been given an error. Rather than invent one, the question is turned round, and asks how large an error would have to be before the ranking changed.

    part 10 · difference
  26. The minimum sits in a notch the width of the answer's reciprocal. The distance from the centre to the boundary, all the way round one MacAdam ellipse mapped into a lightness–chroma space built on the CIE RGB primaries. The curve has two broad maxima and two very narrow minima: the dip is about 2.5 degrees wide at a third above its floor, because the width of the minimum of an ellipse's radius is the reciprocal of its axis ratio, and this ratio is 41. Forty-eight sample points, marked, are spaced 7.5 degrees apart, so none of them lands in either notch and the smallest one found is 2.2 times the true minimum. The ratio comes out 18.59 where it is 40.76.

    An ellipse is not a ring of points

    For eleven rounds of argument the distortion a colour space does to MacAdam's ellipses by mapping forty-eight points round each one and dividing the longest radius by the shortest. The minimum sits in a notch whose width is the reciprocal of the answer, so the method was accurate wherever the answer was small and short by a factor of two where it was large.

    part 11 · difference
  27. Three numbers for one set of ellipses, and which of them is which. Two curves and a horizontal line, against the size the ellipses are drawn at. The line is the analytic axis ratio — the ratio of the singular values of the map's own derivative, which is what "does this space make discrimination contours circles" means. The upper curve is a very finely sampled ring, which sits 0.6 per cent above the line at full size and converges onto it as the ellipse shrinks, because the gap between them is the second-order distortion of the map across a real ellipse rather than an error. The lower curve is the forty-eight-point sample used for this until now: it does not converge onto anything, because its error is set by the sample and not by the size.

    Three numbers for one ellipse

    How far a colour space is from making a discrimination contour circular has three different answers — what a coarse sample of the boundary reports, what a converged sample of a contour of stated size reports, and what the map's own derivative says. They differ by up to a factor of two, they mean different things, and only one of them is what the question is asking.

    part 11 · difference
  28. Twenty-five ellipses is a sample, and the score has an error bar. One row per colour space this collection ranks: the mean axis ratio its ellipses come out at, with the standard error of that mean over the twenty-five ellipses it was computed from. No literature is quoted — a mean of twenty-five numbers has a standard error those twenty-five numbers determine. The bars are far from equal: the best space carries ± 0.07 and the worst ± 1.56, because a space that makes the ellipses nearly circular makes all of them nearly circular and one that does not is dominated by whichever ellipse it handles worst.

    Twenty-five is a sample of the diagram

    A colour space's uniformity score is the mean of twenty-five numbers, and a mean of twenty-five numbers has a standard error those twenty-five numbers determine. Nothing has to be quoted to compute it, and three of the seven adjacent pairs in this collection's ranking survive it.

    part 11 · difference
  29. Every census row under five constructions of the same test set. A slope chart with 5 columns — lattice, coarse, fine, uniform, natural — and one line per change of light in the census, each line joining that row's mean residual under each construction. Four of the five columns describe the same region of surfaces walked at different densities or against different measures; the last is the clamped, realistic family, which is not linear in its parameters and is therefore answering a slightly different question. The levels move: between the coarse and fine lattices every row shifts by seven to nine per cent, in the same direction, which is a common-mode factor no published residual here has ever carried. The order almost survives. Inside the region exactly one pair crosses, and it is the pair the standard error had already flagged; under the clamped set two more cross, including one the error separates by nearly nine standard errors. The crossing lines are drawn heavy.

    A lattice is a quadrature rule

    Walking a set of test surfaces more finely does not converge on a better answer, because refining a lattice under a constraint changes which corners of the region get sampled and not only how densely. The lattice used here turns out to be a two per cent biased estimate of the integral it stands for.

    part 11 · difference
  30. How far each census row moves when the test set's own description does. A grid of bars, one row per change of light in the census and one bar in each row per number that describes the region the test surfaces are drawn from: how saturated they are, how bright, and how far the two modulations may go together. A bar's length is the elasticity — the proportional change in the published residual for a proportional change in that number. Saturation runs from 0.49 to 0.91 and brightness averages 0.104, so a test set's chroma range is nearly everything and its lightness range is nearly nothing. For scale, the largest elasticity found anywhere among this collection's five declared population widths is about a half — and those at least have declared ranges, while these three numbers have never been quoted with one.

    Saturation is nearly everything

    The set of test surfaces has three numbers describing it, and only one of them matters. How saturated the surfaces are carries an elasticity of about 0.7 on every result computed over them; how bright they are carries 0.10. A test chart's chroma range decides its answer and its lightness range does not.

    part 11 · difference
  31. The error on a gap is not the two rows' errors added. Two bars for each of the 13 adjacent pairs in the census ranking. The upper, shorter bar is the standard error of the gap taken as a paired difference — the same 125 surfaces score both rows, so a surface that is awkward under one change of light is usually awkward under the other and the difference is quieter than either. The lower bar is the two rows' own errors added in quadrature, which is what comparing error bars by eye amounts to. Pairing is worth a factor of 1.78 on average and 3.36 on the pair it helps most, and it is the difference between 6 adjacencies unordered and 4. The gain is largest where the two rows are two daylights or two tungstens, because then the surfaces they find awkward are nearly the same surfaces.

    The error on a gap is not the errors at its ends

    Comparing two rows of a table by looking at whether their error bars overlap is the wrong comparison, and here it is wrong by a factor of up to 3.4. The same 125 surfaces score both rows, so the difference between them is quieter than either — and how much quieter is a measurement of how alike the two rows are.

    part 12 · difference
  32. How far each unit is from being a rescaling of the one this collection publishes in. One row per unit on the menu. The bar is the root-mean-square scatter about that unit's own best rescaling of ΔE2000, over 374 pairs of surfaces differing by a fraction of a unit to about ten. A bar of zero would mean the unit is ΔE2000 in different money — every printed number would change and no conclusion would. ΔE2000's own row is zero by construction and is the check that the table is computed the right way round. The two units that divide a chroma difference by the chroma it was measured at, ΔE94 at 15 per cent and CAM16-UCS at 24, are closer to it than the three that do not, which run from 28 to 35. The split is by weighting and not by whether the unit is a matching difference or an appearance one.

    The weighting is the disagreement

    Five colour-difference formulae, three decades and two committees, and the single property that predicts which of them agree is whether a chroma difference gets divided by the chroma it was measured at. It sorts the menu exactly, it cuts across the distinction between a matching difference and an appearance one, and it halves the census's largest sensitivity.

    part 12 · difference
  33. An aperture and a gloss lobe, apart and together. Six materials, each measured through a four-millimetre radius and each given a gloss lobe, alone and at the same time. The pale bar is what the two cost added together as if they were independent; the dark one is what they cost when both are present. Every material comes out below the sum, by between 0.8 and 3.6 ΔE₀₀. The two departures partly cancel: the aperture removes light that went into the material and came back out too far away, and the interface returns light that never went in at all. Measuring either one alone therefore overstates what both together do, which is the opposite of the way interacting errors are usually assumed to behave.

    Two departures that partly cancel

    A glossy translucent sample has two of this round's four departures at once, and the expectation was that they would compound. They do the opposite. An aperture takes light away that went into the material and came back too far out; an interface returns light that never went in at all — so measuring either alone overstates what both together do, on every material tested.

    part 12 · difference
  34. The census along the line from ΔE76 to ΔE94, and past it. ΔE94 is ΔE76 with two weighting constants in it, and at zero those constants make every weight exactly one, so the two formulae are joined by a line rather than separated by a choice. The horizontal axis is how much of the published weighting is applied: 0 is exactly ΔE76, 1 is exactly ΔE94, and 3 is three times more weighting than anybody has proposed. The falling curve is the census's mean elasticity to how saturated its test set is, which drops from 1.11 to 0.74 — most of the fall happening before the published value is reached. The other curve is Kendall's τ against ΔE2000's ranking, and it peaks at w = 0.5, not at 1: the weighting that best reproduces the published ordering is about half the published weighting. There is no value of this dial that reaches ΔE2000, whose rotation term is not on this line at all.

    A dial through a discrete menu

    ΔE*94 is ΔE*ab with two weighting constants in it, and at zero those constants make every weight exactly one — so the two ends of the oldest disagreement in colour difference are joined by a line rather than separated by a choice. Walking it gives a derivative where a menu gives only a spread, and the derivative says the published weighting is on the far side of the interesting part.

    part 13 · difference
  35. Where on the scale the units disagree. The reference pairs split into bands by how far apart they are in ΔE2000, with each unit's root-mean-square relative departure from the published one plotted per band. Every unit is calibrated once, over the whole sample, so a band is not refitted and the shape is the effect rather than an artefact of fitting. Every one of the five falls: the disagreement is proportionally largest on the pairs that are closest together, which is the opposite of what being fitted to threshold data would suggest. The appearance unit is the extreme case, at 91 per cent on the narrowest band and 17 on the widest, because CAM16-UCS raises its distance to the power 0.63 and a power below one inflates small differences against large ones. In absolute terms every curve here runs the other way — the widest band disagrees by 1.16 to 2.37 ΔE₀₀-equivalent against 0.14 to 0.68 on the narrowest — so which reading is right depends on whether the published quantity is a level or a ratio. This is the mechanism behind the census's own behaviour, where the mildest rows spread furthest across the menu.

    The disagreement is at the near end

    Every colour-difference formula on the menu was fitted to threshold data, so the expectation is that they agree about pairs an observer can only just tell apart and diverge on large differences. They do the opposite. Proportionally the disagreement is largest at the near end, by a factor of six for the appearance unit, and the cause is an exponent of 0.63.

    part 13 · difference
  36. Four departures from the model equation, each at an ordinary strength. What each of the four assumptions inside a colour integral costs, in ΔE₀₀, on a stated sample under a stated light. The wavelength index is a coated printing paper measured with and without the ultraviolet of D50; the range is the same paper integrated from 300 nanometres and from 380; the place index is a pigmented plastic through a four-millimetre radius; the direction index is an eggshell paint beside a window. The spread is a factor of 7.0. This is a ranking of four examples rather than of four departures — each of them can be made larger by choosing a more extreme sample, and the marble in the same collection of materials reaches 12.7 on the index that comes third here.

    The departures are larger than the tolerance

    A delivery tolerance is written around one ΔE₀₀ and every one of this round's four departures is above it on ordinary material. A specification that names an illuminant, an observer and a tolerance, and does not name a measurement condition, an aperture and a field, has written a number that two honest laboratories can miss each other on by more than the number itself.

    part 13 · difference
  37. The two tabulation choices over forty-two surfaces, under a tungsten lamp at 2856 K. Each column is one choice, measured over a family of forty-two analytic reflectances rather than on a single example: an absorption band of stated centre, width and depth. The four marks are the smallest, the median, the ninety-fifth percentile and the largest cost in ΔE₀₀, logarithmically. Under a smooth light the range is worth 6.3 times the step at the median, so a collection wanting one repair should widen its range rather than refine its step — and under a fluorescent tube the ranking reverses outright.

    A neutral has no grid

    A perfectly flat reflectance computes to exactly the same colour on every wavelength grid, through every slit, at every origin, and for every observer — not nearly, but to the last bit of a floating-point number. The condition is an identity rather than a limit, and what makes it one is the white point.

    part 13 · difference
  38. What the normaliser cancels, per light. Two bars per light, logarithmic. The upper is the colour error a 5-nanometre sum makes when the white it is divided by is computed finely; the lower is the same sum divided by the white computed on the same coarse grid, which is what every colorimetric calculation actually does. The ratio is between 1.3 and 4.1. The grid appears twice in a tristimulus value and the two errors are the same error, so most of it divides out — which is why five nanometres has been good enough for a century without anybody having to be careful about it.

    The normaliser carries the error too

    A five-nanometre sum gets a red pigment's tristimulus value wrong by two hundredths of a per cent and its colour wrong by six hundredths of a unit. Those two numbers are not the same size because the grid appears twice in a colour — once in the sample and once in the white — and the two errors are largely the same error.

    part 13 · difference
  39. A departure against how far the sample sits from the light. The sample is mixed with a flat reflectance, from the flat one at the left to its own at the right, and two observers differing in the macular pigment look at each mixture. The straight line is the distance between their relative cone excitations, and it is straight to 0.0 per cent: the departure is a pairing, and scaling one factor scales the product. The curved line is the same sequence in ΔE₀₀, which is not a linear function of the excitations and cannot be — it has cube roots in it and a chroma weighting underneath. The identity is about the eye; the curvature belongs to the unit.

    A departure is straight in the excitations

    Walk a sample a quarter of the way from the light towards its own reflectance and exactly a quarter of the observer disagreement remains — in cone excitations, to two parts in a hundred. In ΔE₀₀ the same quarter leaves 0.347 where proportionality wants 0.428, and the discrepancy belongs entirely to the unit.

    part 13 · difference
  40. Each departure over forty-two surfaces rather than one. The same six departures measured over a family of forty-two analytic reflectances — an absorption band of stated centre, width and depth — with the smallest, the median, the ninety-fifth percentile and the largest marked. Every one of them spans more than a factor of three, and the ranking between them is not stable across the family: what decides a departure's size is which sample it is asked about, because a departure is a pairing and the sample is one of the two factors. Quoting any single number for what an observer's age is worth is quoting a choice of example.

    A tolerance with an observer in it

    A delivery tolerance is written in ΔE₀₀ against the 1931 observer, and six departures of that observer combine to about three of the same units on an ordinary saturated sample. A one-unit tolerance is being asked to contain a three-unit uncertainty that nothing in its budget mentions.

    part 14 · difference
  41. The length of one grey ramp, cut into more and more steps. A neutral ramp from L 1 to L 100 cut into between one and ten thousand equal steps, each step measured and the steps added, in four units, both axes logarithmic. ΔE*ab and the model's Euclidean J′a′b′ give the same length at every step count, 99 and 96. ΔE₀₀ settles at 74.6 once the steps are small. The power-corrected ΔE′ does not settle: 25 in one step, 137 in a hundred, 755 in ten thousand, growing as the number of steps to the power 0.37.

    A distance raised to a power has no length

    CAM16-UCS's colour difference is its Euclidean distance raised to the power 0.63 and multiplied by 1.41. That is still a metric — the triangle inequality holds on every one of four thousand random triples — and it has no length. A grey ramp from black to white measures 25 units in one step, 137 in a hundred and 755 in ten thousand, growing as the number of steps to the power 0.37, and halving the size of a step triples the number of steps that fit.

    part 15 · difference
  42. The angle between the lens and the macular pigment, before and after adaptation. On each of 120 surfaces the angle, in the local metric, between what an older lens does to the reading and what a denser macular pigment does, binned in ten-degree steps. Read without adaptation, where both filters yellow the observer's white along with everything else, the two point nearly the same way: a median of 8 degrees. Read after each observer has adapted to its own white, the median is 156, and the two together cost less than the larger alone on 115 of the 120.

    Two yellow filters cancel on a slope

    An older lens and a denser macular pigment both take blue out of the light, and read before adaptation they move a colour in nearly the same direction, eight degrees apart. Once each eye has adapted to its own white they point a median 156 degrees apart on smooth reflectances and together cost less than the lens alone. On surfaces with a narrow absorption band they still sit 26 degrees apart and add. What decides it is the width of the surface's own features.

    part 15 · difference
  43. The angle between the two filters against how completely the eye has adapted. The angle, in the local metric, between what an older lens does to a reading and what a denser macular pigment does, on 120 smooth reflectances, as the degree of adaptation runs from nought to one. The median angle is 8 degrees unadapted and 156 at complete adaptation, and almost all of the turn happens in the last tenth: it passes a right angle at a degree of 0.928. The marks are the degrees CIECAM16 gives five rooms — an overcast sky 1.00, an office 0.94, a lit living room 0.86, a dim room 0.75, a cinema 0.66 — so only the outdoor one is at the end of the dial.

    Two filters cancel only in a bright enough room

    An older lens and a denser macular pigment cancel each other once an eye has adapted — and that result belongs to the end of a dial nobody stands at. Read at the degree of adaptation CIECAM16 gives an ordinary room, the two barely cancel; in a living room they add, and in a cinema they cost six times what they cost under the sky. The room has to be about as bright as an office before the cancelling begins at all.

    part 16 · difference
  44. The same pairs, held at one colour difference, read in a unit that knows the room. 23 pairs of reflectances built to sit at exactly ΔE₀₀ 1.000 under D65, read in CAM16-UCS as the adapting luminance runs from a third of a candela a square metre to ten thousand, in an average surround. ΔE₀₀ has no argument for the room, so in that formula every pair stays at 1.000 all the way across — the flat line. In the model's unit the same pairs rise from a median of 0.76 to 1.30, and they do not rise together: at the bright end they run from 1.11 to 1.65.

    A tolerance has no light level

    Twenty-three pairs built at exactly one colour difference stay at exactly one in every room, because the formula has no argument for the room. Read in the unit that does have one, the same pairs are 0.72 in a cinema, 1.04 in an office and 1.30 in direct sun — and inside any one room they spread by half again, so no single conversion between the two units exists at all.

    part 16 · difference
  45. What is left of one colour difference when the two colours alternate. 23 pairs built at exactly ΔE₀₀ 1.000, alternated at a rate, with each part of the difference scaled by its own temporal channel and the formula then applied unchanged. At rest every pair is the flat line at one. By 7 hertz the median is 1.11 and the pairs run from 0.57 to 3.04 — a factor of 5.3 between pairs the formula calls identical. By sixty hertz the largest of them is 0.15.

    A difference has no rate

    A colour difference formula answers for two patches that are both there and stay. Alternate the same two colours and the difference is not scaled but taken apart: the colour half is gone by fifteen hertz and the lightness half is four times louder at eight, so twenty-three pairs the formula calls identical run over a factor of six at the rate the eye is best at, and are worth nothing at all above sixty.

    part 16 · difference
  46. Every pair of departures, before adaptation and after it. The fifteen pairs of the six audited observer departures. Each row runs from the angle between that pair's two deviations with no adaptation to the angle with complete adaptation; an angle past ninety degrees is a pair pointing apart, which is where a pair can cost less together than the larger of the two costs alone. 3 pairs gain that behaviour as the eye adapts, 3 keep it, 5 lose it and 4 never have it. The pair followed here — the lens against the macular pigment — is in the smallest group that is not empty, and every result quoted from it generalises in the wrong direction.

    Adaptation turns more pairs off than on

    One pair of observer departures was followed across the degree of adaptation and found to cancel only in a bright enough room. The same calculation takes any two, and run over all fifteen pairs it says something the single pair does not: adaptation is a rotation rather than a mechanism for making departures oppose each other. Five pairs lose their cancellation as the eye adapts, three gain it, three keep it and four never have it — and the pair everybody quotes is one of the three it turns on.

    part 17 · difference
  47. Six departures, and three ways of adding them up. The six audited observer departures on 120 smooth reflectances, across the dial. Summing them assumes they all point the same way and is an overestimate everywhere; taking the largest alone assumes only one matters and is an underestimate everywhere. Quadrature — the usual way of combining contributions taken to be independent — assumes they are mutually perpendicular, and the measured combination crosses it at a degree of 0.8618. Below that the departures are on balance pointing together and quadrature is too small; above it they are on balance pointing apart and quadrature is too large. It is exactly right in one room.

    Quadrature is exact in one room

    An observer allowance is built by adding the departures in quadrature, which assumes they are mutually perpendicular. Over fifteen pairs their angles run from 18 degrees to 179 and hardly any are perpendicular. Measured against the real combination, quadrature is too small in a cinema by eight per cent and too large under the sky by fourteen, crossing at an adapting luminance of 22 candelas a square metre — and on individual surfaces it is out by a third in both directions in every room.

    part 17 · difference
  48. Where a surface's band sits decides the room it needs. Each of 168 surfaces at its own crossing — the degree of adaptation at which the part adaptation has yet to remove falls to the size of the part it will leave — against where that surface's absorption band sits. The line joins the median at each band centre and the rooms are marked across. A surface absorbing at 470 nm crosses at 0.883 and one absorbing at 670 nm at 0.972. Both of the filters this is about absorb in the blue, so a surface with a blue band is where the two differ in shape and has a large residual, while a surface with a red band is nearly invisible to both and its whole deviation is the shared yellowing of the observer's white.

    The room a surface needs is written in its band

    Whether two yellow filters cancel on a surface depends on the room, and each surface has its own crossing — the degree of adaptation at which the shared yellowing falls to the size of what is left underneath. Those crossings run from 0.68 to 0.99, and where a surface's absorption band sits accounts for almost all of the spread while how much light it returns accounts for almost none. The reds need a room brighter than a graphic-arts viewing booth, which is brighter than any room a sample is judged in.

    part 17 · difference
  49. Twenty-three pairs at one ΔE₀₀, read in two units that know the light level. Twenty-three pairs of surface colours, each exactly one ΔE₀₀ apart, on a display whose white runs from 1.5 to 10,000 cd/m² across, with a background at a fifth of the white. ΔE₀₀ has no argument for the light and stays at one. The median ΔEITP rises from 1.01 to 2.75 and flattens near the top, and the median CAM16-UCS distance from 0.76 to 1.20.

    Two units with a light level disagree about lightness

    ΔE₀₀ has no argument for how bright a display is. Two colour differences do: CAM16-UCS takes the room's adapting luminance, and ΔEITP — the difference defined for high-dynamic-range television — takes the stimulus's own absolute luminance. Twenty-three pairs at exactly one ΔE₀₀ grow in both as the display brightens, 2.1 times in ΔEITP and 1.5 in CAM16-UCS from a 5 to a 5,000 cd/m² white. But in ΔEITP the lightness part grows fastest, 2.7 times, and in CAM16-UCS it does not grow at all.

    part 18 · difference
  50. How each unit balances lightness against chroma, as a display brightens. Twelve pairs built to differ in lightness alone and twelve built to differ in chroma alone, each at exactly one ΔE₀₀, read in both units at nine display levels. Up is the median lightness pair's reading divided by the median chroma pair's, so a falling curve means chroma differences becoming relatively more visible. Both fall. ΔEITP's median runs from 0.91 at a 1.5-candela white to 0.81 at 10,000, a fall of 11 per cent; CAM16-UCS's from 1.13 to 0.87, a fall of 23 per cent. Neither turns: both units say chroma differences gain on lightness differences as a display brightens, and CAM16-UCS says it twice as strongly.

    The units part by hue, not by light level

    Two colour differences with a light level in them were compared on a display running from 5 to 5,000 cd/m², and a prediction was drawn from how each divided a difference between lightness and chroma. Built into pairs that differ in lightness alone and in chroma alone, both units say the same thing about light level: as a display brightens, chroma differences gain on lightness differences — ΔEITP by a tenth, CAM16-UCS by a quarter. Where they part is hue. The appearance model moves every colour's balance by the same factor; ΔEITP moves the violets, reds and cyan-blues the other way, and at nine of twelve base colours the two units disagree about the direction.

    part 19 · difference
  51. What a lit room takes, and where it takes it. On a display whose white is 1,000 cd/m², how much of the ΔEITP a one-unit lightness step is given survives a veiling luminance reflected off the screen, against where on the lightness scale the step sits. At L 2 — a deep shadow — one candela of reflected light removes 22 per cent of the difference and three candelas remove 46. At L 90 the same veils remove nothing measurable. The shadows the unit counts most are the ones a room removes first.

    The shadows a unit counts are the ones a room removes

    ΔEITP's growth with display brightness is largest in the dark greys, and dark greys are where a lit room's light reflected off the screen sits. One candela a square metre of veiling luminance removes 22 per cent of the difference the unit gives a step at the bottom of the scale on a 1,000-candela display and nothing measurable at the top. The same veil raises the growth the unit reports across display levels from a factor of six to a factor of seventeen, because it destroys a dim display's shadows first.

    part 19 · difference
  52. The appearance model's lightness-to-chroma balance, as the room takes a share of the adaptation. The median lightness pair's reading over the median chroma pair's, for twelve base colours, against the display's white, in a room of 20 cd/m². Solid: CAM16-UCS, with the viewer taking all, three quarters, half, a quarter and none of the adaptation from the display — darker lines take more from the display. Dashed: ΔEITP, which no room enters. With the display alone the model's balance falls 23 per cent; with half from the room, 13; with none from the display it does not move.

    A lit room brings the units' medians together

    As a display brightens, CAM16-UCS says chroma differences gain a quarter on lightness differences and ΔEITP says a tenth. All of the appearance model's movement comes from what the viewer is adapted to, and every calculation had the viewer adapted to the display alone. Give the room its share of the adaptation and the model's movement shrinks at every step: with a 20 cd/m² room supplying two thirds of it, the two units' medians fall by the same amount. What does not shrink is their disagreement about direction. The model still moves every colour the same way, ΔEITP still moves violets, reds and cyan-blues the other way, and in a lit room that becomes the whole of what separates them.

    part 20 · difference
  53. How wrong a declared veil makes the unit, for four true veils. On a 100 cd/m² display, the worst error over grey steps from L 2 to L 90 — the size of the natural logarithm of the declared reading over the true one — against the veil declared, for rooms putting 0.1, 0.3, 1 and 3 cd/m² on the screen. Each curve reaches nought at its own true veil and rises on both sides. The flat stretch at the left is declaring almost nothing, which is declaring none: 0.22 for a true veil of 0.1, 0.54 for a true veil of 0.3, 1.14 for a true veil of 1, 1.89 for a true veil of 3.

    A guessed veil halves the error

    A colour difference that takes a display's absolute luminance leaves out the light a room reflects off the screen, and on an ordinary display in an ordinary room that makes it wrong about the darkest greys by a factor of three. Giving the unit the veil as a declared argument fixes that when the veil is known. The worry was that it never would be — that a guessed argument is no better than none. It is better: any declared veil up to about twice the true one beats declaring none, and one middling guess for every room halves the worst error. What a guess cannot do is reach ten per cent; that needs the veil known within a sixth, which is what a luminance meter aimed at a black screen gives.

    part 20 · difference

All series