The collection

Every essay — page 6

Page 6 of 40, continuing through the fields in the same order.

What light is What the eye does Matching and measuring Difference and uniformity What the brain does What a scene does What a camera does Where the model breaks What it takes to deliver it

SeriesObserversNamed objectsRefutationsSearch

Difference and uniformity

How far apart two colours are, whether the space you measured in was uniform, and how MacAdam's ellipses settle the question by measurement.
The worst triple found, under ΔE2000. Three colours, plotted on the a–b plane of CIELAB. Going from a to c directly is 123.645; going via b is 60.528, which is 51.0 per cent shorter. A distance cannot behave that way, and this one is the formula every colour tolerance in industry is written in. The colours are far apart, which is where the violation is largest; the same search confined to tolerance scale finds a smaller one that has not gone away.

A difference is not a distance

Two earlier essays here said that CIEDE2000 violates the triangle inequality and left it at that. Searching for the violation finds a detour half the length of the direct route, a smaller one inside a five-unit ball, and a second defect nobody mentions — ΔE94 is not even symmetric.
9 figures
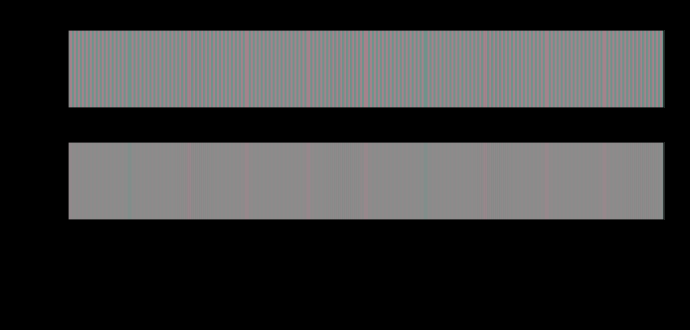
A chromatic line screen at 10.0 cycles per degree. The upper strip is the pattern as delivered and the lower one is the same pattern after each opponent channel has been low-passed at its own cutoff. Against a flat field of the same mean, the delivered pattern differs by up to ΔE00 14.22 and the filtered one by 7.77 — a ratio of 1.8. Every number quoted elsewhere for a difference of this kind is the first one.

A difference has no size

A colour difference formula answers a question about two large patches seen side by side. Applied to a pattern, it reports fourteen units where the eye is left with less than one — and the ratio depends on nothing but how finely the difference is spread.

6 figures
How often two colour-difference formulae disagree about which pair is worse. Pairs of colours sampled in CIELAB, compared two at a time. A rank inversion is a case where one formula calls pair A worse and the other calls pair B worse; no monotone rescaling of either can remove one. The left bar of each group is the rate over the whole space and the right bar is the rate among pairs sitting near a tolerance of ΔE 1, where the decision is actually made — and it is between 35 and 44 per cent, against a coin flip at fifty.

Which of two is worse

Two colour-difference formulae disagree about which of two pairs is the larger difference in thirteen per cent of comparisons overall — and in forty-three per cent of comparisons among pairs sitting near a tolerance of one unit, which is where every acceptance decision is actually made.
7 figures
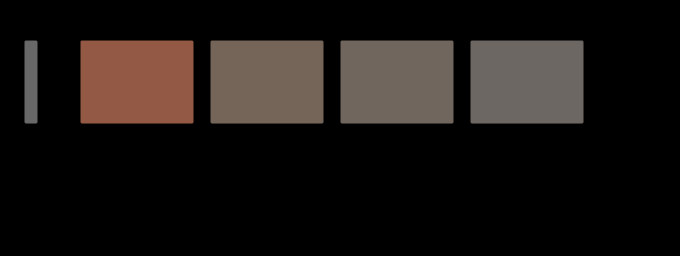
One colour difference, at four places in the visual field. The same pair of colours — ΔE00 22.0 at the fovea — with each of its three components divided by that channel's own threshold scaling at the stated eccentricity. What is left at 20° is 4.4, and its hue has turned by 26 degrees, because the red–green part is divided by more than the blue–yellow part. The swatches are the predicted colours, drawn where a reader will look straight at them; the figure states a prediction it cannot stage.

A difference has no place

A colour difference formula answers a question about two patches somebody is looking straight at. Move the same pair ten degrees into the periphery and a third of it is left — and it has turned twenty-four degrees of hue, because the three channels give out at three different rates.

9 figures
One tolerance decision, at four spectral distances. Every column is a pair of samples ΔE00 1.0 apart for the observer a colorimeter models — solved to that value by bisection, so the instrument would report the same number for all four. What differs is how far apart the two spectra are, which is achieved by adding a metameric black the reference observer cannot see. The bands are what two hundred people report: from 1.13 at the ninety-fifth percentile when the spectra are the same shape to 2.32 when they are not, and the worst case reaches 3.7. No specification records the quantity on the horizontal axis.

A tolerance is a probability

A colorimeter reports one number and a specification compares it with another, and both are computed for an observer who does not exist. Handed to two hundred people, the same pair at ΔE00 1.0 is read from 0.8 to 3.7 — and which of those two ranges applies depends on something no specification records.

7 figures
The three constants a specification does not quote. ΔE2000 is defined with three parametric factors in it — kL, kC and kH — which the CIE leaves to the industry using the formula rather than fixing. Graphic arts uses ones throughout; the textile standard weighs lightness at half, which is kL = 2. Applied to 4000 pairs at a tolerance of 1, the two settings accept 46 and 75 per cent, and 29 per cent of pairs change verdict — a larger disagreement than any between the formulae themselves. The reference conditions the ones assume are diffuse illumination at 1000 lux, a mid-grey surround, samples abutting, subtending over four degrees, differing by under five units, with no visible texture.

Three constants nobody quotes

CIEDE2000 is defined with three parametric factors in it, the CIE leaves them to the industry using the formula, and the two settings in ordinary use differ by a factor of two in one of them. Twenty-nine per cent of acceptance decisions change between the two — a larger disagreement than any between the formulae themselves.

8 figures
Which of two reproductions is better depends on which statistic is asked. A specification for a proof or a print run is written against a set and has to reduce the set to one number. Here are two candidates: the one with the lower mean has the higher ninety-fifth percentile, so the mean prefers A and the tail prefers B. Across 2000 pairs of candidates generated the same way, the two statistics disagree about the winner 30 per cent of the time. Both numbers are honest; only one of them is what somebody notices.

A mean is not a difference

A specification for a proof, a profile or a print run is written against a set of colours and has to reduce that set to one number. The mean and the ninety-fifth percentile disagree about which of two reproductions is better in thirty per cent of cases, and both numbers are honest.

7 figures
A halftone tint away from the centre of gaze, two ways. The upper curve raises the threshold by the E2 rule and leaves the filter alone, which is the multiplication the last phase guessed at. The lower one also moves the cutoff, because eccentricity magnifies the whole spatial scale — implemented as the substitution that makes it exact, a screen of ruling r seen through a filter whose cutoff has been divided by s being a screen of ruling r·s seen at the fovea. The horizontal line is threshold. The screen is visible where you are looking and gone by 3°, while the product prediction has it visible across the whole page.

A tint at the edge of a page

The last phase left this join open and guessed at its answer — how visible a halftone tint is away from the centre of gaze should be the product of two effects it had measured separately. It is not the product. At five degrees the guess is fifty-three times too generous, and by twenty it is out by eight orders of magnitude.

8 figures
One tolerance decision, about pairs that agree less and less about the spectrum. Every point is a pair of samples that the reference observer reports as exactly ΔE00 1.0 apart — the same number, the same decision, the same line in the same specification. Along the axis is how far apart their two reflectances are. Up the side is the 95th percentile of what two hundred other eyes report. It runs from 1.13 to 2.32. The document records the horizontal line and not the axis it is plotted against.

A tolerance needs a second number

Two samples one colour difference apart can be read almost identically by everybody or two units apart by the worst-off twentieth, and which of those it is depends on how far apart their spectra are — a quantity every spectrophotometer has already measured and none of them prints. Adding it as a second field predicts the population three times better, and at the tolerances where it matters it is right about a third of the decisions the difference alone gets wrong.

8 figures
How fine a screen each channel can see. A halftone screen at 35 per cent coverage, 45 degrees, seen by each of the eye's three spatial channels. The bar is the ruling at which it drops below that channel's own threshold. The luminance channel is still seeing it at 55 cycles per degree; the two chromatic ones have lost it by 15 and 10. The dashed line is an ordinary press ruling at reading distance, and only one channel is above it. A halftone is a luminance object, which is why the ink whose dots are nearly the lightness of the paper is the one nobody worries about.

A halftone is a luminance object

The eye's three spatial channels resolve a screen at 55, 15 and 10 cycles per degree, so at any ruling a press actually runs only one of them can see it at all. The corollary corrects a guess already published here — rotating a screen matters more to the chromatic channels, not less — but only at rulings so coarse that nobody prints there.

9 figures
A tolerance of one unit, re-measured under every light in the census. Every one of the 23 pairs behind this figure is at exactly ΔE00 1.000 under D65 by construction. Each bar is what those same pairs measure under another light, after the observer has adapted to it: the line is the median and the bar spans the pairs. A tolerance is written as a property of a pair and it is not one — the light multiplies both members, and the difference between two products is not the product of the difference. The widest row is a lens at twenty against a lens at seventy, spanning 0.81 to 1.57.

One unit in another room

Twenty-three pairs built at exactly ΔE00 1.000 under D65, re-measured under every change of light this site models with the observer adapted to each, come out anywhere between 0.64 and 1.57. A tolerance is written as a property of a pair and it is a property of a pair and a room.

7 figures
How much of a whiteness figure is the sheet, and how much is the lamp. Each bar is how many points of CIE whiteness a stock has above an unbrightened sheet of the same base, measured with an ultraviolet-included instrument. The dark part is what survives when the ultraviolet is removed — the part that is a property of the paper. On average 82 per cent of the scale is the pale part, which is a property of the instrument's lamp. A whiteness figure without a measurement condition beside it is therefore not a measurement of a sheet; it is a measurement of a sheet and a lamp, quoted as though it were the first.

Whiteness is mostly the lamp

The CIE whiteness formula ranks white samples the way people do, which is what it was built for and is not in question. What is in question is what it is a measurement of — take the ultraviolet out of the instrument and 82 per cent of the scale collapses, because the part that separates a premium sheet from an ordinary one was contributed by the lamp.

7 figures