Concept

Calibration — where it appears

Measuring what a device does and correcting what is sent to it, which can fix nothing that happens outside the signal path. It cannot correct for the room, the observer or the substrate, which is where most of the disagreement between two devices actually lives.

Named by 35 essays across 8 fields — each of them below, with the objects they name alongside it.
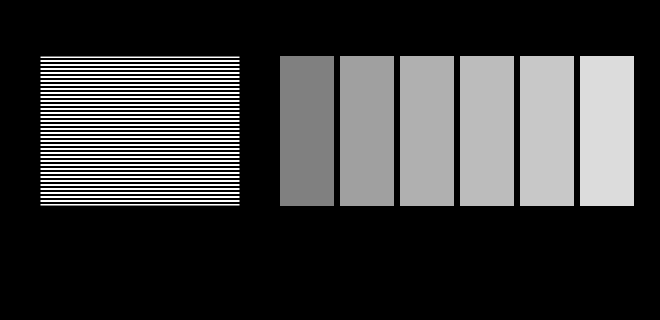
A gamma probe: which grey matches a half-white dither?. The striped block on the left is half white and half black, so it carries half the luminance of white. Stand back until the stripes blur and find the patch that matches it. On an sRGB display the answer is code 188, not 128 — code 128 has only 22 per cent of white's luminance.

The display is an unknown

This site is displayed on the very apparatus it is about, and it knows almost nothing about that apparatus. Two figures here stop assuming and ask instead — a probe for the transfer function and a probe for the gamut.

limits · Limits
The tone scale of one display, in four rooms. Code value along the bottom, the lightness it comes out at up the side. The curves are the same display: what changes is the light falling on the screen, which adds a fixed luminance to every pixel. The signal value that means black arrives at L* = 11.7 at 600 lux, against 0.9 in the dark — the lightness of a dark grey card, from a pixel that is switched off.

The screen is not the room

A thousand-to-one display in an ordinary office is a hundred-and-thirty-seven-to-one display, and the signal value that means black comes out at the lightness of a dark grey card. Nothing is wrong with the panel. Light falls on the screen and comes back off it, and the two per cent it returns is added to every pixel — most of all to the ones with nothing else in them.

applied · Delivery
A lamp switched on, and what it is still doing minutes later. The junction warms from ambient to 80 °C with a time constant of 150 seconds, and three quoted slopes act as it does: the die's peak moves, the die loses efficiency, and the converter loses quantum yield. The output falls 25 per cent and the colour moves ΔE00 2.6. Nine tenths of the way takes 405 seconds. The vertical mark is the eye's own slow adaptation constant, 60 seconds, for scale.

A lamp switched on is not the lamp measured

A luminaire takes about seven minutes to reach nine tenths of its working temperature, loses a quarter of its output on the way, and moves ΔE00 2.6 while it does. That is slower than every clock in the eye — so for the first minutes after a switch is thrown, both ends of the measurement are moving, and every appearance claim here has assumed one of them was still.

light · Light
The same twenty-four samples, measured two standard ways. How far apart a 45°/0° instrument and a sphere with its gloss port closed are, on samples running from three per cent reflectance to seventy. The whole of the difference is the interface reflection — four per cent of the light, returned without ever meeting a pigment, thrown away by one geometry and collected by the other. It is the same four points in every row, which is why the disagreement is a property of how dark the sample is rather than of what colour it is: ΔE00 8.7 on the darkest samples against 1.93 on the lightest.

An instrument has a geometry

Every reflectance here arrives through a model with a bandpass, a sampling interval and no position at all. Real instruments say where they were standing, and the two standard answers disagree by ΔE00 8.35 on a dark gloss sample — a difference that adds rather than multiplies, and that no adaptation removes.

matching · Gamut
What a camera matrix reports on its own chart, and what it delivers off it. The same camera fitted on charts of increasing chromatic range. The left bar of each pair is the mean error on the chart the matrix was fitted to, which is the number a profile comes with; the right bar is the error on a saturated set it never saw. At the thinnest chart the fit reports 0.19 ΔE00 and delivers 1.65, a factor of 8.6. The gap closes as the chart widens, and it closes because the chart improves rather than because the camera does.

The chart decides the profile

A camera's colour matrix is nine numbers fitted to a set of patches somebody chose, and the number that comes with it is the error on those patches. On a chart with no chromatic range that number is 0.19 ΔE00 and the matrix delivers 1.65 — and a second matrix, indistinguishable on the chart, delivers 2.03.

imaging · Capture
A camera matrix fitted under each light, used under each light. Mean ΔE00 over the same surfaces, with the matrix fitted under the row's light and the scene under the column's. The diagonal is what a profile's data sheet quotes and is between 1.0 and 1.2 everywhere. Off it the numbers rise steeply: the matrix fitted under illuminant A reports 1.17 there and delivers 9.34 under a 9000 K daylight, a factor of 8.0. Nothing about the camera changes between cells.

A matrix is fitted under one light

A camera's colour matrix is nine numbers determined by a chart photographed under a particular illuminant, and the error it quotes is the error under that illuminant. Fitted under a tungsten lamp and used under a cold sky it delivers eight times as much — and the two-matrix scheme every real profile uses turns out not to be a compromise at all.

imaging · Capture
What each fitted thing in these essays carries, what its data fix, and what is left. Three columns per row: how many numbers the model has, how many the stated data determine, and the difference — the dimension of the family that fits equally well. The third column is the one nobody publishes. A zero there does not mean the model is right; it means it is determined, which is a much weaker property and is compatible with being determined badly, as the camera row is.

A fit can be exact and empty

Every fitted object here reports one number, the residual on the data it was fitted to, and every one of them has two more that nobody publishes — how many of its parameters the data actually determine, and how large the family of equally good answers is. The third column is where the failures live.

limits · Limits
What the next thousand patches buy a printer profile. A profile is a table, exact at its nodes and interpolated everywhere else. Each mark is a grid: the horizontal axis is how many patches somebody had to print and measure, the vertical is the worst error found between the nodes. Going from 135 patches to 3645 — 27.0× the work — buys 8.4× the accuracy. The error falls with the square of the spacing and the count rises with its cube.

A profile is a fit between its nodes

A printer profile is a table, exact at every patch that was printed and interpolated everywhere else — and everywhere else is where every job lives. Going from a hundred and thirty-five patches to three and a half thousand is twenty-seven times the work for eight times the accuracy, and the exponents say that is as good as it gets.

applied · Delivery
What six of this collection's published numbers do when the unit changes. Six quantities, from six calculations that share nothing: a change of light after an observer has adapted, a camera profile's error, the gap between the two standard observers, a metameric pair under the lamp that breaks it, the same image on two papers, and an observer two seconds into a new room. Each is recomputed under all six units and every unit is calibrated onto ΔE2000's scale first, so the bar is not a change of units in the ordinary sense. The bar is the ratio of the largest reading to the smallest, and it runs from 1.71 to 2.30. Five of the six are printed in ΔE2000 by the essays that report them; the sixth is printed in CAM16-UCS, because the model it comes out of defines that unit.

A choice with no magnitude

An audit can multiply a width by 1.25 and report an elasticity. It cannot multiply CIEDE2000 by anything. Auditing a structural choice needs a different instrument, and building one shows that six published numbers in this collection each carry a factor of about two of unit-choice — after the change of scale has been taken out.

limits · Limits
The adaptation census in six units, calibrated onto one scale. Each line is one of the fourteen changes of light in the adaptation census, drawn across the six units the results could have been published in. Every unit is multiplied by the single factor that best carries it onto ΔE2000 over a reference sample of surface pairs, so the vertical axis means the same thing in every column and a sloping line is a disagreement rather than a change of scale. The levels move by up to a factor of two. More to the point, the lines cross: ΔEok puts 10 of the 91 pairs of rows in the other order, and CAM16-UCS, the only appearance unit here, puts the fewest — 2.

The census in six units

Recomputing every change of light in the adaptation census under six colour-difference formulae, with the scale factor divided out, leaves a table whose levels move by up to a factor of three point seven. The rows that move most are the mild ones, which is the opposite of what a reader would guess and is a property of where each formula was fitted.

light · Light
How far each unit is from being a rescaling of the one this collection publishes in. One row per unit on the menu. The bar is the root-mean-square scatter about that unit's own best rescaling of ΔE2000, over 374 pairs of surfaces differing by a fraction of a unit to about ten. A bar of zero would mean the unit is ΔE2000 in different money — every printed number would change and no conclusion would. ΔE2000's own row is zero by construction and is the check that the table is computed the right way round. The two units that divide a chroma difference by the chroma it was measured at, ΔE94 at 15 per cent and CAM16-UCS at 24, are closer to it than the three that do not, which run from 28 to 35. The split is by weighting and not by whether the unit is a matching difference or an appearance one.

The weighting is the disagreement

Five colour-difference formulae, three decades and two committees, and the single property that predicts which of them agree is whether a chroma difference gets divided by the chroma it was measured at. It sorts the menu exactly, it cuts across the distinction between a matching difference and an appearance one, and it halves the census's largest sensitivity.

difference · Metric
The census along the line from ΔE76 to ΔE94, and past it. ΔE94 is ΔE76 with two weighting constants in it, and at zero those constants make every weight exactly one, so the two formulae are joined by a line rather than separated by a choice. The horizontal axis is how much of the published weighting is applied: 0 is exactly ΔE76, 1 is exactly ΔE94, and 3 is three times more weighting than anybody has proposed. The falling curve is the census's mean elasticity to how saturated its test set is, which drops from 1.11 to 0.74 — most of the fall happening before the published value is reached. The other curve is Kendall's τ against ΔE2000's ranking, and it peaks at w = 0.5, not at 1: the weighting that best reproduces the published ordering is about half the published weighting. There is no value of this dial that reaches ΔE2000, whose rotation term is not on this line at all.

A dial through a discrete menu

ΔE*94 is ΔE*ab with two weighting constants in it, and at zero those constants make every weight exactly one — so the two ends of the oldest disagreement in colour difference are joined by a line rather than separated by a choice. Walking it gives a derivative where a menu gives only a spread, and the derivative says the published weighting is on the far side of the interesting part.

difference · Metric
Which steps of the census ranking a change of unit reverses. Every adjacent pair in the published census ranking that at least one unit puts the other way round. The bar counts how many of the five other units reverse it. The marker on the left says whether the test set had already declared the pair unresolved — a gap smaller than twice its own paired standard error, which is a statement about sampling over 125 surfaces and shares no arithmetic with a change of ruler. The two pairs every unit reverses are both flagged, which is the agreement. The pair at the bottom is the disagreement: the test set resolves it at 9.1 standard errors and four of the five units reverse it anyway, because a sampling error cannot see a change of ruler and a change of ruler cannot see a sampling error.

Two instruments and one ranking

A sampling error over a hundred and twenty-five surfaces and a change of colour-difference formula share no arithmetic at all, and they were asked the same question of the same table. Every adjacency the whole menu reverses had already been flagged as unresolved. And one the test set settles at nine standard errors is reversed by four of the five formulae, which is what makes them two instruments rather than one.

limits · Limits
Where on the scale the units disagree. The reference pairs split into bands by how far apart they are in ΔE2000, with each unit's root-mean-square relative departure from the published one plotted per band. Every unit is calibrated once, over the whole sample, so a band is not refitted and the shape is the effect rather than an artefact of fitting. Every one of the five falls: the disagreement is proportionally largest on the pairs that are closest together, which is the opposite of what being fitted to threshold data would suggest. The appearance unit is the extreme case, at 91 per cent on the narrowest band and 17 on the widest, because CAM16-UCS raises its distance to the power 0.63 and a power below one inflates small differences against large ones. In absolute terms every curve here runs the other way — the widest band disagrees by 1.16 to 2.37 ΔE₀₀-equivalent against 0.14 to 0.68 on the narrowest — so which reading is right depends on whether the published quantity is a level or a ratio. This is the mechanism behind the census's own behaviour, where the mildest rows spread furthest across the menu.

The disagreement is at the near end

Every colour-difference formula on the menu was fitted to threshold data, so the expectation is that they agree about pairs an observer can only just tell apart and diverge on large differences. They do the opposite. Proportionally the disagreement is largest at the near end, by a factor of six for the appearance unit, and the cause is an exponent of 0.63.

difference · Metric
What six of this collection's published numbers do when the unit changes. Six quantities, from six calculations that share nothing: a change of light after an observer has adapted, a camera profile's error, the gap between the two standard observers, a metameric pair under the lamp that breaks it, the same image on two papers, and an observer two seconds into a new room. Each is recomputed under all six units and every unit is calibrated onto ΔE2000's scale first, so the bar is not a change of units in the ordinary sense. The bar is the ratio of the largest reading to the smallest, and it runs from 1.71 to 2.30. Five of the six are printed in ΔE2000 by the essays that report them; the sixth is printed in CAM16-UCS, because the model it comes out of defines that unit.

The observers differ by a unit's worth

The gap between the 1931 and 1964 standard observers is the one quantity in this collection's audit with no published number under it — nothing here reports it as a single figure over a stated set. It also has the second-largest dependence on which colour-difference formula is used, running from 1.60 to 3.55 across the menu.

matching · Gamut
MacAdam's twenty-five ellipses, measured in each unit. The uniformity instrument used here, applied to units rather than to spaces. The upper bar is anisotropy — the mean over the twenty-five of the largest radius divided by the smallest, where 1 would be a circle. The lower is spread — the largest mean radius divided by the smallest across all twenty-five, which asks whether a step of the same size means the same thing in different parts of the diagram. Reading down the three CIELAB-based formulae in the order they were published, the anisotropy falls 3.42 → 2.89 → 2.74 and the spread rises 3.24 → 3.59 → 4.12: the weighting divides a difference by the chroma it was measured at, which equalises directions at a point and unequalises magnitudes between points. Neither number is scaled, so no calibration is applied here. CAM16-UCS is ahead on both.

A unit rests on a space that was ranked

This collection ranks three colour spaces by how nearly they make MacAdam's ellipses circles, and CIELAB comes last. It then publishes every difference it computes in a formula built on CIELAB. Turning the same instrument on the formulae rather than the spaces shows the repair works — and that it buys roundness by paying in evenness.

matching · Gamut
Pairs built to sit exactly on a ΔE2000 tolerance, read in every other unit. Twenty-four pairs of surfaces, each constructed by walking one member along a fixed direction until the difference is exactly 1.0 ΔE2000 under D65. The bar spans what those same pairs read in each unit, after calibration, with the tick at the mean. ΔE2000's own row is a point at 1.0 by construction. Every other unit spreads them: ΔE*uv reads them from 0.69 to 1.75, so a contract written at "one unit" accepts and rejects a different set of deliveries depending on which unit it means. CAM16-UCS rejects all twenty-four: it reads the closest of them at 1.43.

A tolerance is a boundary through pairs

Twenty-four pairs of surfaces built to sit exactly on a ΔE2000 tolerance of one read from 0.69 to 1.93 in the other five units. A contract quoting "one unit" without naming the formula does not become slightly wrong in another; it accepts and rejects a different set of deliveries, and in one case rejects every single one.

applied · Delivery
Two sensitivities from two libraries, under every unit. Two quantities that share no code, no test set and no physical question: how much the adaptation census's residual depends on how saturated its surfaces are, and how much a camera profile's reported error depends on how saturated its test chart is. The first is a mean over fourteen changes of light built from cosine combinations; the second is one number about one silicon sensor scored on Gaussian bumps. Under the published unit they sit at 0.687 and 0.656. Across the whole menu they move together, from about 0.5 under the appearance unit to about 1.15 under plain CIELAB, staying within 12 per cent of each other at the worst point. Two numbers agreeing once is a coincidence; two curves agreeing at six points across a factor of two and a half is a shared mechanism, and the mechanism is the compression the unit applies to a chroma difference.

The coincidence was a mechanism

Two sensitivities from two libraries with no shared code came out two per cent apart, and the claim made about them was that they share a mechanism rather than a number. That claim has a colour-difference formula inside it, so it can be tested by changing the formula — and both curves move together across the whole menu, from 0.5 to 1.15.

imaging · Capture
A camera matrix refitted to minimise each unit, rather than solved in XYZ. Every camera profile here, and as far as can be told every camera profile anybody ships, is a linear least-squares solve in XYZ. That is an objective and it is on nobody's menu: it weights a difference by how large the tristimulus values are. Each row here refits the same 3×3 by direct search to minimise one of the six units instead. The upper bar is how much better the fit gets in that unit; the lower is how far the matrix itself moves, as a relative Frobenius norm. Both matter and they do not agree: CAM16-UCS moves the matrix least, at 0.34 per cent, for the largest improvement of the six, while ΔE*94 moves it 6.8 times as far for less. A score that changes is a report changing; a matrix that changes is the camera rendering different pixels.

The objective nobody chose

Every camera profile here, and as far as can be told everywhere, is a linear least-squares solve in tristimulus space. That is an objective and it is on nobody's menu — it weights an error by how bright the patch is. Refitting the same matrix to minimise a real colour-difference formula improves the fit in all six, and moves the matrix, which means different pixels rather than a different report.

imaging · Capture
What six of this collection's published numbers do when the unit changes. Six quantities, from six calculations that share nothing: a change of light after an observer has adapted, a camera profile's error, the gap between the two standard observers, a metameric pair under the lamp that breaks it, the same image on two papers, and an observer two seconds into a new room. Each is recomputed under all six units and every unit is calibrated onto ΔE2000's scale first, so the bar is not a change of units in the ordinary sense. The bar is the ratio of the largest reading to the smallest, and it runs from 1.71 to 2.30. Five of the six are printed in ΔE2000 by the essays that report them; the sixth is printed in CAM16-UCS, because the model it comes out of defines that unit.

A model judged in another model's unit

An appearance shift is a change in what an observer would report, not a change in a stimulus, so measuring one with a matching difference means first asking what stimulus a settled observer would need to be shown to give the same report. That step is not bookkeeping — it is the whole distinction the field rests on, and it costs a factor of 1.7 across the menu.

brain · Appearance
What six of this collection's published numbers do when the unit changes. Six quantities, from six calculations that share nothing: a change of light after an observer has adapted, a camera profile's error, the gap between the two standard observers, a metameric pair under the lamp that breaks it, the same image on two papers, and an observer two seconds into a new room. Each is recomputed under all six units and every unit is calibrated onto ΔE2000's scale first, so the bar is not a change of units in the ordinary sense. The bar is the ratio of the largest reading to the smallest, and it runs from 1.71 to 2.30. Five of the six are printed in ΔE2000 by the essays that report them; the sixth is printed in CAM16-UCS, because the model it comes out of defines that unit.

Three choices reached

Two rounds ago this collection named three things it rested on and could not audit — a unit, a diagonal and a template. All three are now reached, and the interesting part is not the three answers but that four of the round's own predictions were refused by the arithmetic and one of its measurements was wrong in a way only a cross-check caught.

limits · Limits
The collection's adaptation census, with its surfaces departed. Each row is one of the fourteen changes of light in this site's adaptation census, and the bar is what a von Kries gain leaves behind. The open marks are the published numbers; the filled ones are the same computation with every one of the hundred and twenty-five test surfaces replaced by what an instrument with an aperture, or a room with a direction in it, actually reports. Nothing moves by more than 9 per cent. A departure that does not depend on the light is very largely absorbed by the observer's own gain, because it changes the reflectance and the gain is applied afterwards. The fourth departure is not on this chart and cannot be: a fluorescent sample has a different curve under every light, so there is no set of reflectances to hand the census at all.

The chart was measured, not photographed

A camera profile is fitted so that the camera's response maps onto the chart's tristimulus values, and those values came out of a spectrophotometer. So the profile's target carries the instrument's departures and the camera does not — a mildly translucent chart read through a four-millimetre aperture supplies targets 2.55 ΔE₀₀ from the truth, which is twice the profile's own fitting error.

imaging · Capture
The conditions under which an observer's departure is exactly zero. A departure of the observer is the pairing of something belonging to the observer with something belonging to the stimulus, so emptying either factor empties the product. The axis is logarithmic in what is left when the condition is imposed. Six rows empty the stimulus's factor — a perfectly neutral sample is the same colour for every observer, at any age and any field size — and two empty the observer's, since a gain on each cone and a change of basis are both absorbed exactly. All eight are identities rather than small numbers. The last two are the same two conditions imposed in a published cone space rather than in the observer's own, and they are worth eight and thirteen units: the identity is about the eye, and the arithmetic everybody uses is in somebody else's coordinates.

A neutral is everyone's colour

Two eyes differing by fifty years of lens yellowing, by a factor of three in macular pigment and by six nanometres of long-wavelength peak agree about a grey card to four parts in ten thousand billion. The agreement is an identity rather than a coincidence, and it says exactly what an observer disagreement is a disagreement about.

eye · Cones
The arguments a standard observer does not have. Seven choices inside a set of colour-matching functions, each with the shape it takes and what it is worth in ΔE₀₀ on a red pigment under a 6500 K radiator. Six are measurements: a field size, an age, a macular density, a cone optical density, three peak wavelengths and a rod contribution. The seventh is not — a change of basis is a change of curves and not a change of observer, and its entry is exactly zero because the space an experiment measures is what an observer is. Printing that zero beside the others is the clearest statement of what the other six are measurements of.

An observer is a contract

Six departures, all above a delivery tolerance, none dominant, and no reader matching the standard on any of them. That would be a demolition if the standard observer were a description of an eye. It is not — it is an agreement about what a number means, and an agreement is not falsified by being unlike anybody.

limits · Limits
The conditions under which an observer's departure is exactly zero. A departure of the observer is the pairing of something belonging to the observer with something belonging to the stimulus, so emptying either factor empties the product. The axis is logarithmic in what is left when the condition is imposed. Six rows empty the stimulus's factor — a perfectly neutral sample is the same colour for every observer, at any age and any field size — and two empty the observer's, since a gain on each cone and a change of basis are both absorbed exactly. All eight are identities rather than small numbers. The last two are the same two conditions imposed in a published cone space rather than in the observer's own, and they are worth eight and thirteen units: the identity is about the eye, and the arithmetic everybody uses is in somebody else's coordinates.

The instrument is one observer exactly

A spectrophotometer has no observer uncertainty. It computes through the 1931 tables to the last bit, reproducibly, forever — which is its whole value and is also why it cannot report the three colour differences of observer spread between itself and whoever is looking at the sample.

applied · Delivery
Each departure over forty-two surfaces rather than one. The same six departures measured over a family of forty-two analytic reflectances — an absorption band of stated centre, width and depth — with the smallest, the median, the ninety-fifth percentile and the largest marked. Every one of them spans more than a factor of three, and the ranking between them is not stable across the family: what decides a departure's size is which sample it is asked about, because a departure is a pairing and the sample is one of the two factors. Quoting any single number for what an observer's age is worth is quoting a choice of example.

The chart was measured by an observer too

A camera profile is fitted so that the camera's numbers reproduce the chart's measured tristimulus values. Those values were computed through the 1931 observer, so the fit inherits every departure in this round — and the fit's own residual, at 0.19 ΔE₀₀ on the chart, is fifteen times smaller than the term it cannot see.

imaging · Capture
The arguments a standard observer does not have. Seven choices inside a set of colour-matching functions, each with the shape it takes and what it is worth in ΔE₀₀ on a red pigment under a 6500 K radiator. Six are measurements: a field size, an age, a macular density, a cone optical density, three peak wavelengths and a rod contribution. The seventh is not — a change of basis is a change of curves and not a change of observer, and its entry is exactly zero because the space an experiment measures is what an observer is. Printing that zero beside the others is the clearest statement of what the other six are measurements of.

A sensor has no lens

A camera is a fourth observer and it is the only one with none of the six arguments this round measured. It does not age, it has no macular pigment, its response does not broaden with density and its peaks do not vary — so it is perfectly reproducible and is not any of the observers it is fitted to reproduce.

imaging · Capture
One infrared-cut filter, crossed at four angles. The transmittance of the same interference filter for light crossing it at the centre of a frame and at three steeper angles, from 560 to 760 nm. Its half-transmission edge is at 665 nm straight on and moves to 658, 646 and 630 nm, following the edge wavelength times the square root of one minus the squared sine of the angle over the square of the stack's effective index, 1.8. The deepest reds are what it takes away, and a lamp decides how much light there was in them.

The corner of the frame has another filter

A camera's infrared-cut filter is an interference stack, and light crossing it at an angle sees its edge moved towards the blue — from 665 nm at the centre of a frame to 646 at twenty-five degrees. The corner's red channel loses a tenth of its response under daylight and a sixth under tungsten. A grey-card gain map makes the corner exactly right under the lamp it was made under; under a tungsten lamp the same grey is 2.6 colour differences wrong, under a white LED 4.2, and even under its own lamp the coloured patches are not corrected, because a moved edge is not a gain.

imaging · Capture
Three corrections for the corner of a frame, each made under daylight. The mean colour difference over twenty-four coloured patches between the centre of a frame and its corner, against the angle light arrives at, after three corrections each fitted under daylight, D65 and used under it: a grey-card gain map, a correction confined to the red channel's row, and a full three-by-three matrix. All three leave the grey exact. At 25° the gain map leaves 1.86, the red row 0.93 and the matrix 0.90; at 35°, 3.81, 1.95 and 1.81. Six more numbers buy almost nothing, because the moved edge is in one channel.

A corner is corrected by one row

A grey-card gain map makes the corner of a frame exactly right on grey and leaves coloured patches 1.86 colour differences wrong at twenty-five degrees. A three-by-three matrix fitted at that position halves it — and six of its nine numbers do nothing, because the moved filter edge is in one channel. The three that matter rebuild the lost red from green and blue, they carry to another lamp better than a gain map in eleven cases of twelve, and in the twelfth, a row fitted under tungsten and used in daylight, they leave the grey 9.2 off.

imaging · Capture
Two matrices blended by colour temperature, under fourteen lamps. For each lamp, with the neutral held exact as a converter holds it: the mean colour difference over twelve test surfaces with a matrix fitted under that lamp (the short bar) and with the tungsten and daylight matrices blended at the weight its correlated colour temperature gives (the long bar). Smooth lamps on or near the locus sit within 6 per cent of their own matrix. The lamps with lines or narrow bands in them sit a median of 2.2 times theirs, from 1.38 for a broadband tube to 5.2 for a three-emitter source.

Two matrices do not reach a white LED

A camera profile's two matrices, blended by the scene's colour temperature, are as good as a matrix fitted anywhere along daylight. Under a white LED or a fluorescent tube the same blend leaves colours twice as far off as a matrix fitted under that lamp, and no weight inside the profile's range repairs it. What decides it is not how far the lamp sits from the Planckian locus — a triphosphor tube sits nearly on it and fares worst — but whether its spectrum has lines in it, which a white balance reading cannot see.

imaging · Capture
The error between a profile's nodes is a bias, not a scatter. Two quantities against the lattice size: the mean colour difference between the nodes, and the mean signed lightness error. If the interpolation erred in both directions the second would be near zero while the first was not. They lie on each other — 0.136 against 0.133 at a nine-step lattice — so the whole of what a profile does between its patches is to lighten. It errs light because a press's response is convex in ink coverage: the first drop of ink removes more light than the last, and a straight line between two points on a convex curve lies above it. At three steps 400 of 400 samples err light.

A profile interpolates light

A profile is exact at its patches and wrong between them, and how wrong has been measured twice. Which way it is wrong has not. At a nine-step lattice the mean signed lightness error between the nodes is +0.136 against a mean colour difference of 0.133 — the error is not a scatter but a bias, and it lightens. The repair costs nothing measured and is forbidden by how a profile is checked: let the table be wrong at its own patches.

applied · Delivery
The confusion matrix, and which corner the common lamps are in. Twelve fixtures sorted two ways. Down the page is what their spectra are; across is what flicker says. The two corners on the diagonal are 7 fixtures the classifier gets right. The 3 missed are structured lamps that do not flicker — a white LED and a warm LED on constant drivers, and a three-emitter fixture — and those are the lamps most modern interiors are lit by. The 2 false alarms are smooth lamps that do flicker: a halogen lamp on mains and a tinted radiator, both of which a photograph of a room is quite likely to contain.

Flicker sorts lamps the wrong way

A camera cannot see a spectral line in its own white, so the essay on the two-matrix profile named the classifiers a device might have instead, and the first of them was flicker. Flicker is measurable, and it measures the wrong thing. It sorts lamps by how their power is delivered while the matrix needs them sorted by how their spectrum is shaped, and the two are independent: a white LED on a constant driver is perfectly steady and strongly structured, and it is what most indoor photographs are lit by.

imaging · Capture
How far each lamp's sensor reading is from what the camera predicts, with RGB + clear. Fourteen lamps, six smooth and eight structured, each scored by how far an ambient-light sensor with red, green, blue and clear channels reads from what the camera's white predicts through a map fitted on smooth radiators and daylights. The smooth lamps score at most 0.057 and the structured at least 0.133; the dashed line is the threshold at the gap's geometric middle, 0.087. The lights the map was fitted on score at most 0.0113. Every lamp falls on its own side of the line.

Two sensors disagree about deep red, not lines

A phone's ambient-light sensor and its camera read the same lamp differently, and the difference sorts fourteen lamps into smooth and structured without a single mistake — where flicker made five. It is not reading their lines. Almost all of it comes from the sensor's clear channel collecting deep red the camera's infrared cut throws away, so daylight with its far red trimmed is called structured and a white LED with a far-red emitter is called smooth.

imaging · Capture
The calibration error a narrow fourth channel survives, by where it is placed. For a red, green and blue ambient sensor with one more channel 10 nm wide, centred from 450 to 640 nm: the first calibration error at which some lamp of fourteen is misclassified. Dashed: the channel pooled into the whole residual, as the ambient sensor's disagreement was read; its best is ±1.50 per cent. Solid: the channel read on its own, as its departure from what the camera's white predicts for it; its best is ±4.0 per cent, at 450 nm. Crosses mark centres where the channel read alone does not separate the lamps at all. The two horizontal lines are the red, green and blue design (±1 per cent) and the design with a clear channel (±4 per cent).

A narrow channel has to be read on its own

An ambient sensor with a clear channel tells structured lamps from smooth ones by reading deep red, and one without it reads structure but breaks at one per cent of calibration error. A narrow fourth channel between the camera's peaks was proposed to have both. Pooled into the sensor's disagreement with the camera, it reads structure and breaks at one and a quarter per cent — no better than the design it was meant to rescue. Read on its own, as its departure from what the camera predicts for it, a channel at 450 nm holds to four per cent, the clear channel's figure, and far red does not move it.

imaging · Capture
Four ways to correct the corner, under each of four lamps, at 25°. The mean colour error left on the chart's coloured patches at the corner of the frame, under each lamp, after: the red row fitted under that lamp; one red row fitted on the chart under all four lamps with the grey held under daylight; a grey-card gain map calibrated under daylight; and the worst of the other lamps' rows used by mistake. daylight: 0.93, 1.33, 1.86, 4.91; tungsten: 0.99, 1.45, 1.87, 3.26; white LED: 0.36, 1.39, 3.28, 1.77; fluorescent: 0.37, 1.56, 3.09, 2.45. The pooled row holds every lamp between 1.33 and 1.56.

One row for every lamp costs the lamps that lose least

A corner correction fitted under one lamp is right under that lamp and can be badly wrong under another, so a converter unsure of its lamp was offered a single row fitted under several at once. Pooled over four lamps, one row holds every lamp's corner between 1.33 and 1.56 colour differences — no lamp worse than a grey-card map, and none near the 4.91 a wrong row can leave. The price falls on the white LED and the fluorescent tube, which it leaves four times worse than their own rows, because they lose the least red at the corner and the pooled row is built to repair the lamps that lose the most. Two rows, one per class of lamp, keep almost all of both.

imaging · Capture

Named alongside it

The objects these essays reach for when they reach for this one.

Colour differenceColour matrixTest setCamera rawIdentifiabilityCamera profileLeast-squaresChromatic adaptationCIEDE2000Held-out validationObserver metamerismQuality control

All concepts