The collection

Every essay — page 23

Page 23 of 40, continuing through the fields in the same order.

What light is What the eye does Matching and measuring Difference and uniformity What the brain does What a scene does What a camera does Where the model breaks What it takes to deliver it

SeriesObserversNamed objectsRefutationsSearch

Matching and measuring

CIE XYZ, chromaticity, and gamut — a system for predicting when two lights match, frequently mistaken for a system that predicts how they look.

The sRGB transfer function, and the gamma 2.2 curve it is not. Code value against relative luminance. The sRGB function is piecewise — a short linear segment near black, then a 2.4 power law with an offset — and it is close to but not the same as a plain 2.2 power law. Half-way along the axis of stored values sits at 21 per cent luminance, and half the luminance of white is at code 188.

A hex code is not a colour

Six hexadecimal digits identify three numbers. Turning three numbers into a colour needs a colour space, a transfer function, a white point and a display, and leaving any of them unstated is the everyday version of every confusion in colour management.
9 figures
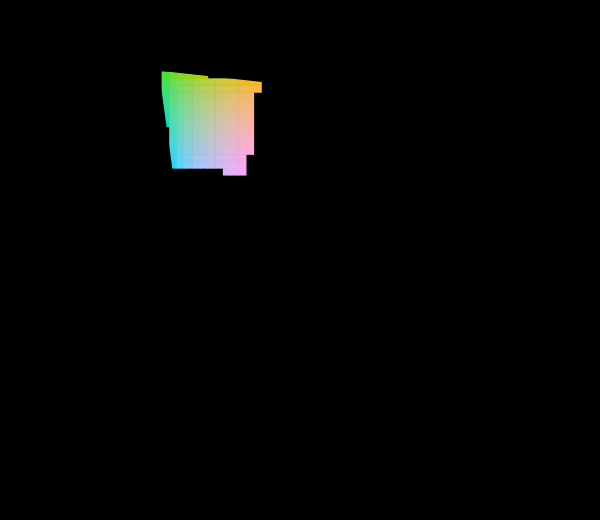
The 1976 uniform chromaticity diagram, with the unreachable region marked. The u′v′ diagram: the same spectral locus and the same sRGB primaries as the 1931 picture, projectively transformed. Straight lines stay straight, so mixtures and the gamut triangle survive; what changes is the distribution of area, and the green region that dominates the 1931 diagram is much reduced. 8% of the cells sampled inside the locus are reachable at Y = 0.55; the rest are hatched.

The diagram was replaced in 1976

The CIE knew the 1931 diagram was badly distorted and published a better one. Half a century later almost every chromaticity plot in print is still the old one, and both are still printed filled edge to edge with colours no display can show.

7 figures
Three lightness scales, seventy years apart. Munsell value, CIELAB's L* and CIECAM16's J against luminance, all rescaled to run 0 to 100. Each is somebody's answer to how evenly spaced lightness steps map onto light. They put the midpoint of the scale at 19.8%, 18.4% and 28.0% of the white's luminance respectively — close enough to be three measurements of one thing, far enough apart to be three measurements rather than one restated twice.

Colour by catalogue

A colour order system arranges physical samples on a regular lattice so a person can find one and name it. The space it samples is not regular, and everything interesting about such systems is what happens at that mismatch.

9 figures
A 20 nm bandpass, and what it does to the sample. The true reflectance, the same reflectance as a 20 nm instrument reporting every 20 nm returns it, and the slit function responsible, drawn at its own scale around 550 nm. The reconstruction is what every calculation downstream will use, and it differs from the truth by ΔE 2.97 under D65. Nothing in the file the instrument writes marks which values were measured and which were interpolated.

What the instrument reports

A spectrophotometer sees a sample through a slit of finite width, at a finite number of wavelengths. What it writes down is the truth convolved with its own bandpass, and nothing in the file says which values were measured and which were invented.
9 figures
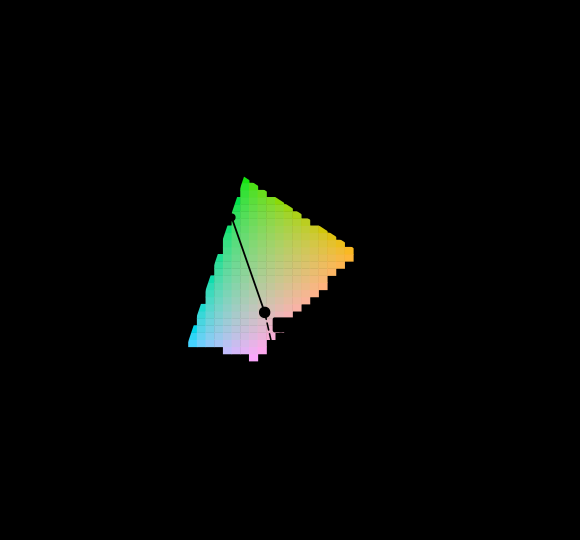
Dominant wavelength as a construction on the diagram, against equal-energy E. A ray is drawn from the white point through each sample and continued until it leaves the diagram. The sample at (0.28, 0.52) leaves through the spectral locus at 537 nm, at excitation purity 0.43. The sample at (0.36, 0.19) leaves through the line of purples, so it has no dominant wavelength at all and is written 544c nm — the crossing on the opposite side, marked with a c. The hatched region is colour this display cannot show and is not drawn as though it could.

Not every colour has a wavelength

The question every reader arrives with is which wavelength a colour is. For close to a third of the directions on the chromaticity diagram the honest answer is that there is none, and the construction colorimetry offers instead is a statement about a diagram rather than about light.
7 figures
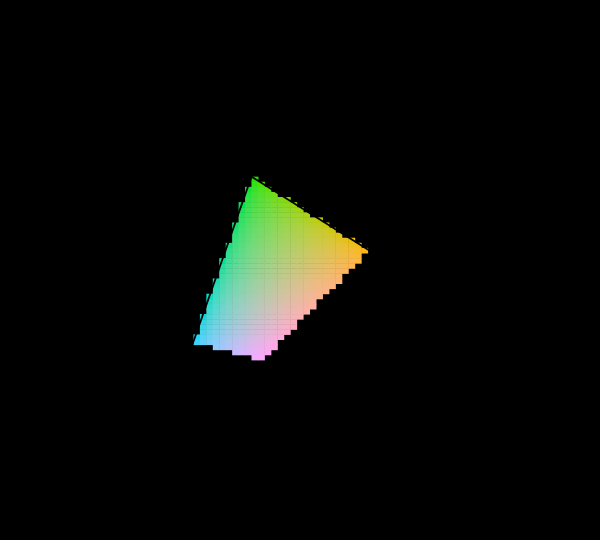
sRGB, Display P3 and Rec. 2020 compared on the chromaticity diagram. Three nested triangles inside the horseshoe. sRGB covers 74 per cent of the area P3 covers. Rec. 2020's red and green primaries sit on the spectral locus itself, within 0.000 and 0.006 of it, meaning they are monochromatic.

Six numbers make a space

An RGB colour space is eight numbers — three primary chromaticities, a white point, and a transfer function — and everything else about it is derived. Deriving it rather than copying the matrix is the difference between having a colour space and having a table somebody else computed.

6 figures
What a coarse wavelength grid costs, by source. Colour error against grid size, for four sources through one reflectance. Daylight survives every grid tested: 0.67 ΔE00 even at 40 nm. A source with lines in it does not — the narrowband source reaches 16.2. The grid is not a property of the arithmetic; it is a claim about what the light has in it.

Five nanometres is a choice

Every integral here is taken in five-nanometre steps, and the interval has never had to be defended. Coarsening it to twenty costs daylight two hundredths of a colour difference and a fluorescent tube six and a half — and which way of coarsening is used decides a further factor of six.
8 figures
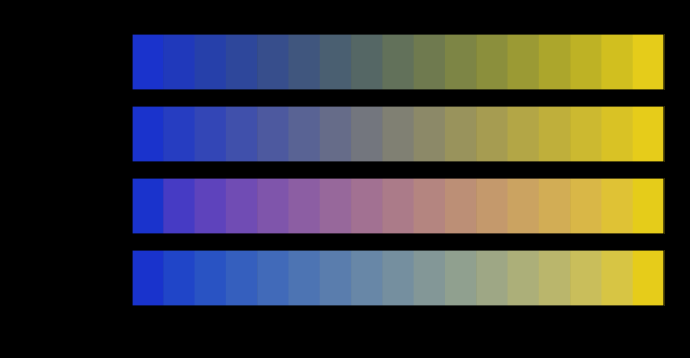
One pair of colours, blended in four spaces. Every row starts and ends at the same two colours and visits different ones in between. The chroma of the middle falls furthest in linear light, by 83 units below the straight line between the endpoints' chromas — the grey dead zone that every blue-to-yellow gradient has and that no endpoint mentions. Any colour a route visits that this display cannot show is hatched rather than clipped.

A gradient is a path

Two colours fix the ends of a blend and nothing else. The middle is decided by the space the interpolation happens in, and four spaces in daily use put the halfway point of one ordinary gradient as much as thirty-seven units of colour difference apart.

7 figures
Grassmann's four laws, exact — and the two things that break them. For a linear observer every one of the four is exact and the residual is floating point, which is the control that makes the two failures below measurements rather than artefacts. Rods break a cone-metameric match by 23 per cent of a rod excitation at dusk; bleaching breaks it by 0.59 per cent of a cone excitation in the sun. Both are stated as fractions of a receptor's own response, so they can be put on one scale.

The laws that make colour add up

Colorimetry is an integral, and an integral assumes matching is linear. Grassmann's four laws are exact for a linear observer, to floating point — and they fail at both ends of the light range, by two different mechanisms, leaving colorimetry an operating band of three and a bit decades that no standard states.

9 figures
One match, and what it says about the observer making it. The anomaloscope: a monochromatic 589 nm yellow set against a mixture of 545 and 670 nm. Only two cone classes respond at those wavelengths, so the match is two equations in two unknowns and has one solution for any observer whose two pigments differ. The bar is the fraction of the accepted band; the mark is the solution. A normal observer accepts 0.7 per cent of the scale; an observer whose two pigments are the same accepts all of it, because their two equations are one equation twice. Nothing here is fitted to clinical data: the pigments are the same template used for every observer here, at stated peaks, and the match is the solution of the linear system.

One match names the observer

A yellow at 589 nanometres set against a mixture of 545 and 670 is two equations in two unknowns. It has one solution for a normal observer, a solution somewhere else for an anomalous one, and no unique solution at all for a dichromat — whose two equations are one equation twice.
7 figures
A colour-order system's chips, sorted by what they would be called. A regular lattice in lightness, chroma and hue — the idealisation of a swatch book, and regular by construction because a person has to be able to find a page. Named, it comes apart: 1320 chips inside the gamut divide into 198 for grey and 66 for blue. And 22 per cent of one-step moves in the lattice change the name, so a page of a swatch book is not a page of a vocabulary.

A catalogue is not a vocabulary

A colour order system is a regular lattice, because a person has to be able to find a page. Sorted by what its chips would be called, that lattice comes apart into piles differing by a factor of three — and a fifth of all one-step moves in it change the name.

6 figures
A fourth primary, swept — every setting an exact match, none of them the same. Four primaries matching three numbers leave one degree of freedom. Along the horizontal axis it is the fourth primary's share of the white's luminance; at each value the other three powers are solved exactly, so every point on this plot is a floating-point-exact match for the reference member — worst residual 1.3e-15 — and no colorimeter can tell them apart. What the population sees runs from 13.7 ΔE00 at the ninety-fifth percentile to 17.3, a factor of 1.26. The best setting is the largest share the arithmetic admits, so what stops it is not colour but the requirement that four powers stay positive.

Four primaries have a choice

Three primaries matching three numbers have one answer. Four have a family of them, every member exact to floating point for the observer they were solved for — and the members are not equally good for anybody else, so a display with a fourth primary has a setting that is robust to who is looking at it and a setting that is not.

9 figures