Theme

The thread: Matching is not appearance — page 3

CIE XYZ predicts when two lights will match under identical viewing conditions. It was never a model of how anything looks, and most of the confusion in applied colour comes from using it as one.
One tolerance decision, at four spectral distances. Every column is a pair of samples ΔE00 1.0 apart for the observer a colorimeter models — solved to that value by bisection, so the instrument would report the same number for all four. What differs is how far apart the two spectra are, which is achieved by adding a metameric black the reference observer cannot see. The bands are what two hundred people report: from 1.13 at the ninety-fifth percentile when the spectra are the same shape to 2.32 when they are not, and the worst case reaches 3.7. No specification records the quantity on the horizontal axis. Difference and uniformity

A tolerance is a probability

A colorimeter reports one number and a specification compares it with another, and both are computed for an observer who does not exist. Handed to two hundred people, the same pair at ΔE00 1.0 is read from 0.8 to 3.7 — and which of those two ranges applies depends on something no specification records.

The three constants a specification does not quote. ΔE2000 is defined with three parametric factors in it — kL, kC and kH — which the CIE leaves to the industry using the formula rather than fixing. Graphic arts uses ones throughout; the textile standard weighs lightness at half, which is kL = 2. Applied to 4000 pairs at a tolerance of 1, the two settings accept 46 and 75 per cent, and 29 per cent of pairs change verdict — a larger disagreement than any between the formulae themselves. The reference conditions the ones assume are diffuse illumination at 1000 lux, a mid-grey surround, samples abutting, subtending over four degrees, differing by under five units, with no visible texture. Difference and uniformity

Three constants nobody quotes

CIEDE2000 is defined with three parametric factors in it, the CIE leaves them to the industry using the formula, and the two settings in ordinary use differ by a factor of two in one of them. Twenty-nine per cent of acceptance decisions change between the two — a larger disagreement than any between the formulae themselves.

Which of two reproductions is better depends on which statistic is asked. A specification for a proof or a print run is written against a set and has to reduce the set to one number. Here are two candidates: the one with the lower mean has the higher ninety-fifth percentile, so the mean prefers A and the tail prefers B. Across 2000 pairs of candidates generated the same way, the two statistics disagree about the winner 30 per cent of the time. Both numbers are honest; only one of them is what somebody notices. Difference and uniformity

A mean is not a difference

A specification for a proof, a profile or a print run is written against a set of colours and has to reduce that set to one number. The mean and the ninety-fifth percentile disagree about which of two reproductions is better in thirty per cent of cases, and both numbers are honest.

A halftone tint away from the centre of gaze, two ways. The upper curve raises the threshold by the E2 rule and leaves the filter alone, which is the multiplication the last phase guessed at. The lower one also moves the cutoff, because eccentricity magnifies the whole spatial scale — implemented as the substitution that makes it exact, a screen of ruling r seen through a filter whose cutoff has been divided by s being a screen of ruling r·s seen at the fovea. The horizontal line is threshold. The screen is visible where you are looking and gone by 3°, while the product prediction has it visible across the whole page. Difference and uniformity

A tint at the edge of a page

The last phase left this join open and guessed at its answer — how visible a halftone tint is away from the centre of gaze should be the product of two effects it had measured separately. It is not the product. At five degrees the guess is fifty-three times too generous, and by twenty it is out by eight orders of magnitude.
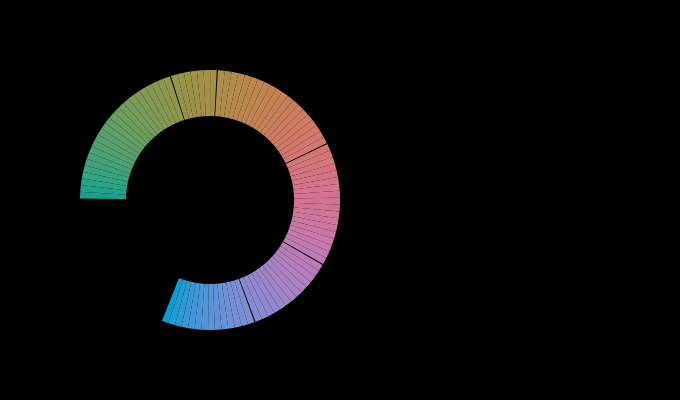
The hue circle cut into names, at L 60 and C 40. Left, the arcs each name claims, drawn at the colour of their midpoints; right, the same arcs measured in ΔE00 by integrating the difference along the ring rather than in degrees. The widest is 5.3 times the narrowest in degrees and 4.5 times in colour difference, so the metric accounts for 15 per cent of the inequality and no more. Only the eight chromatic terms compete on this ring: at this chroma the achromatic three would otherwise take the region where no basic English term sits, which is a defect of the model and is named in the essay. Where the model breaks

There is no word for that colour

The naming model built this phase gives a saturated cyan the name green, calls part of a chromatic ring grey, and puts one of the eleven focal colours outside what a display can show. Each failure is a measurement rather than a disclaimer, and together they say what a vocabulary is that eleven points and a distance are not.

The colour of a beam, against the angle it leaves at. A conformal converter — an even layer laid straight onto the die — makes light leaving at θ cross 1/cos θ times as much of it, so it is more completely converted and the beam is warmer at its edge. From the axis to 75° the correlated colour temperature falls by 556 K and the whole difference is ΔE00 16.4. The flat line is the same emitters under a dome, whose path length is the same in every direction by construction: no angular colour at all, exactly, which is what a remote converter is sold for. What light is

A lamp has a direction

A white LED is a blue die under a converter, and light leaving at an angle has travelled further through the converter than light leaving straight up. So the mixture is different in every direction, the beam is bluer in the middle than at its edge, and the number on the box is one direction's worth of a device that has no single colour.

A lamp switched on, and what it is still doing minutes later. The junction warms from ambient to 80 °C with a time constant of 150 seconds, and three quoted slopes act as it does: the die's peak moves, the die loses efficiency, and the converter loses quantum yield. The output falls 25 per cent and the colour moves ΔE00 2.6. Nine tenths of the way takes 405 seconds. The vertical mark is the eye's own slow adaptation constant, 60 seconds, for scale. What light is

A lamp switched on is not the lamp measured

A luminaire takes about seven minutes to reach nine tenths of its working temperature, loses a quarter of its output on the way, and moves ΔE00 2.6 while it does. That is slower than every clock in the eye — so for the first minutes after a switch is thrown, both ends of the measurement are moving, and every appearance claim here has assumed one of them was still.

A surface in a room, from the moment the light goes on. How far a blue surface is from the colour it will settle at, second by second, for an observer who walked in from the snow as the lamp was switched on. It starts ΔE00 27 away, is still 6.1 away after a minute — the point at which the eye is conventionally said to have adapted — and does not fall under a unit until 295 seconds. What light is

The room settles after the eye does

Four clocks run in a room and only three of them are in the observer. The slowest is the lamp, which takes four hundred seconds to reach nine tenths of its colour change — so a minute after the light goes on, when the eye is conventionally said to have settled, most of what is left is the lamp, and three quarters of that could not be adapted away by an observer of any speed.

The appearance model's three rooms, read as three moments. CIECAM16's degree of adaptation is a function of the surround and the adapting luminance and of nothing else — the model has no time in it. Solving for the moment at which an observer who will adapt completely has got that far turns each of the three tabulated surrounds into a reading on a clock. At 100 candelas per square metre they are 106, 49, 21 seconds. They are presented as three rooms. They are also one observer, in one room, at three times in the first two minutes. What the brain does

A viewing condition is a moment

CIECAM16's degree of adaptation is a function of the surround and the adapting luminance and of nothing else, because the model has no time in it. Solving for when an observer who will adapt completely has got that far turns the standard's three surrounds into three clock readings — 107, 50 and 21 seconds — and the two readings are distinguishable by waiting.

How much of the gamut changes name, and what changed it. The eleven basic terms are quoted as centroids in CIELAB, and a colour is named by which one it is nearest. Two things nobody records decide the answer. Changing the distance function renames 20.5 per cent of the displayable gamut. Changing the room — the same colours, the same words, a different surround, through the appearance model — renames up to 26.8 per cent. The centroids were measured in one viewing condition and are applied here in every essay as though a name were a region of a space with no room in it. What the brain does

A name moves with the room

Eleven basic colour terms are quoted as centroids in CIELAB and a colour is named by which one it is nearest. Two things nobody records decide the answer — which distance function is used, which renames a fifth of the displayable gamut, and which room the colour is in, which renames more than a quarter of it.

A corner moves the spectrum and the viewing condition at once. A coloured patch in a corner of coloured walls, against how enclosed the corner is. The top curve is what a colorimeter set up at the door reports: light that has bounced carries the surrounding reflectance again, so the patch is lit by something the room is not. The middle curve is what is left once the patch is read against the corner's own white — most of it goes, because a corner is a change of illuminant and that is what chromatic adaptation is for. The bottom curve is the other thing a corner is: a brighter place, 1.76 times the light, which moves the appearance through the Hunt effect with the white point held still and cannot be adapted away at all. What a scene does

A corner moves both terms

The interreflection essays compute what a corner does to a spectrum, which is one of the two things a corner does. It is also a brighter place with a differently coloured background — a viewing condition, not a stimulus — and adaptation removes most of the first and none of the second. At an enclosure of six tenths that is 63 per cent of seven units gone and a further unit arriving from the extra light alone.

Every claim here that was computed with one model, recomputed with two. Each row is a claim one of these essays makes. The bar is how many times the two-model answer differs from the one-model answer, on a logarithmic scale. 3 of 13 have no bar at all: the first model's answer for them is exactly zero, not because it computed zero but because it has no variable for the quantity. Those are the rows where a second model did not correct an answer — it supplied one. Where the model breaks

What a second model changed

Thirteen claims here, each computed with one model and recomputed with two. Ten of them move by half again or more. Three of them do not move at all in the ordinary sense — the first model's answer is exactly zero, not because it computed zero but because it has no variable for the quantity — and every one of those three is a join that supplied a state or a device rather than a spread.

Every change of light this site models, and how much of it a gain removes. Each row is a change of illumination. The pale bar is how far it moves an ordinary surface for an observer who does not adapt; the solid bar at its left end is what is left after the observer has applied the one gain adaptation gives them, which is the ratio of the two whites in the CAT16 basis and is not fitted to anything. Sorted by the fraction left rather than by the size of the change, because the two orderings are different: the largest change here is removed almost entirely and the worst row is a change less than a third its size. Where the model breaks

What no adaptation can remove

A change of light is exactly a 3×3 matrix on tristimulus values, and adaptation is a diagonal one. Putting every change of illumination this site models through that distinction sorts them by how much of themselves they leave behind, and the smallest residual in the census belongs to a filter inside the eye.

Every published adaptation transform, and one computed from daylight, on every change. What each basis leaves an adapted observer with, row by row. Darker is worse. The last column is not a published transform: it is the basis in which a change from D65 to D50 is exactly diagonal, computed in closed form from the two spectra with nothing fitted. It is far the best on the daylight rows and it is beaten on the discharge lamps, which is the trade the published transforms are sitting in — they were fitted to data containing both kinds of light and are therefore optimal for neither. Over the census as a whole the winner is Bradford at ΔE00 1.14. What the brain does

A gain needs a basis

Adaptation scales three signals, and which three is a choice. The basis in which a change from D65 to D50 is exactly diagonal can be computed in closed form from the two spectra, it beats every published transform on daylight by a factor of five, and it loses to all of them on a fluorescent tube.

How much of what a display can show each name owns. Every point on a 5-unit CIELAB lattice inside the sRGB gamut is given to its nearest centroid under ΔE00, and the shares counted. They run from 21.1 per cent for purple to 4.6 for blue, a factor of 4.6. The three terms that carry no chroma at all — black, grey and white — hold 20 per cent between them. A share here is a statement about the names and about the gamut they are counted over, and the gamut is sRGB. What the brain does

A name in the model's own words

The eleven basic colour terms move when the room does, and the obvious objection is that they were being measured in a space with no room in it. Quoting them in an appearance model's own coordinates instead does not shrink the renaming — it grows it by four per cent — and the space alone renames an eighth of the gamut with the room held still.

What reaches the retina, and why the observer's table stops at 360 nanometres. The transmittance of the eye's own optics across the short-wave band, at three ages, with the brightener's absorption shaded underneath. The upper curve is an eye whose lens has been removed — the cornea alone, opaque below about 295 nanometres and transparent above it. The photopigments absorb perfectly well in this band; what stops the light is a piece of optics in front of them, which is why the short-wave limit of colour vision moves with age and can be removed surgically. A twenty-year-old receives 21 times as much of the band a brightener works in as a seventy-year-old does. What the eye does

The eye stops at the lens

Neither standard observer is tabulated below 360 nanometres, and the reason is not that the photopigments stop absorbing there. It is that the light never arrives — the cornea and the crystalline lens take it — so the short-wave limit of human colour vision is a piece of optics, it moves by a factor of twenty across a lifetime, and it can be surgically removed.

How blue the sheet reads, and how much of that is the room. Chroma in an appearance model, with the observer adapted to the light the sheet is under. The three markers on each row are an average, a dim and a dark surround; the open marker at the left is the same sheet with the ultraviolet removed. Every stock is close to neutral without the excitation and carries real chroma with it, at a hue of about 295 degrees — blue-violet — so the colour is the fluorescence and not the substrate. And it falls by nearly half between a bright room and a dark one, which makes how blue a sheet looks a property of where it is being looked at. What the brain does

A brighter white still looks white

Colorimetry says a brightened sheet is nine units of b* from neutral, which sounds like a visible blue. An appearance model with the observer adapted to the room says it carries eleven units of chroma at a hue of 295 degrees — genuinely blue-violet — and that the number falls by nearly half between a bright room and a dark one. What it cannot say is why anybody calls the result white.

MacAdam's ellipses, drawn on one diagram. The twenty-five measured discrimination ellipses at 10× actual size, on CIE xy (1931). Mean axis ratio 2.95 — one would mean every contour is a circle — and a size spread of 10.42 between the largest and the smallest. Both numbers depend on the plane, which is why the 1976 revision existed; neither can be taken to one, which is why the revision did not finish the job. Difference and uniformity

No diagram makes them circles

Every chromaticity diagram is a projective picture of the same measurement, so how badly MacAdam's ellipses fail to be circles can be minimised over the whole family of them. The best plane there is still leaves the average ellipse twice as long as it is wide — which makes the residual a fact about the eye rather than about anybody's choice of primaries.

The same formula, applied after six different changes of basis. CIELAB's arithmetic — divide by a white, take a cube root, difference the results — run on six of the bases the matching data leave free. A linear change of basis leaves every match alone; a cube root does not commute with one, so the space, and therefore every colour difference computed in it, depends on which basis was in place before the nonlinearity. CIELAB's own choice gives an axis ratio of 3.44 and the best row here is LMS (confusion points) at 2.60. Difference and uniformity

A difference needs a basis too

A linear change of coordinates leaves every colour match exactly where it was. A cube root does not commute with one — so a lightness–chroma space, and every colour difference computed in it, is a property of the basis that happened to be in place before the nonlinearity. CIELAB's basis was chosen in 1931 for reasons that had nothing to do with difference.

How short of determining the light a photograph is, as the scene grows. Each cell is the number of unknowns left over after every equation the image supplies: three sensors, a three-dimensional illuminant, and reflectances confined to a linear model of the dimension on the left. At one and two dimensions more surfaces close the gap. At three the gap never closes, because each further surface adds three equations and three unknowns; at four it widens. The count is arithmetic and has no algorithm in it. What a scene does

An image does not determine the light

A photograph of a scene under one illuminant gives three numbers per surface and asks for the illuminant plus three numbers per surface. The count closes only if reflectances lie in a two-dimensional model, and no number of surfaces helps — at three dimensions the alternative scenes can be written down, and they reproduce every sensor response exactly.

What each fitted thing in these essays carries, what its data fix, and what is left. Three columns per row: how many numbers the model has, how many the stated data determine, and the difference — the dimension of the family that fits equally well. The third column is the one nobody publishes. A zero there does not mean the model is right; it means it is determined, which is a much weaker property and is compatible with being determined badly, as the camera row is. Where the model breaks

A fit can be exact and empty

Every fitted object here reports one number, the residual on the data it was fitted to, and every one of them has two more that nobody publishes — how many of its parameters the data actually determine, and how large the family of equally good answers is. The third column is where the failures live.

Where each published matrix puts the confusion points, whether or not it meant to. Every matrix from tristimulus values to cone responses commits itself to three confusion points, because the point is the direction the other two rows annihilate. The first row is the construction from the measured points and returns them exactly. The rest were chosen for other reasons and land elsewhere — Hunt–Pointer–Estévez, which this collection uses everywhere, misses the deuteranope's point by 1.28 in chromaticity. The worst here is 4.09. What the brain does

The cones an appearance model uses

CIECAM16 adapts in three axes whose rows are labelled L, M and S, and they were fitted to corresponding-colour experiments rather than measured on receptors. Run the dichromat construction backwards on them and they commit to a deuteranope confusion point 1.45 away in chromaticity from the measured one — which is a test the axes were never asked to pass.

Four different bases, one adaptation model, one number. The middle row of the basis built from the confusion points multiplied by 0.21, 1, 3.7 and 11 in turn, with the resulting adaptation residual drawn as a bar in each case. The four bars are the same height to 9e-16 of a ΔE00, because the row's scale cancels exactly between the gain and the inverse. Three of the nine numbers a colour match leaves free are invisible to an adaptation model, which is why the six the dichromat data supply determine it outright with nothing left to fit. What the eye does

The three numbers a gain cannot see

Colour matching leaves nine numbers free. Three dichromat confusion points fix six of them and three choices of unit fix the rest — and it turns out that a von Kries gain is exactly blind to those last three. So the dichromat data do not merely constrain an adaptation basis. They determine it, with nothing left over to fit.

How cone-like a basis is, against how well it adapts. Each basis placed by how far its own implied deuteranope confusion point falls from the measured one (horizontal) and by how much an adapted observer is left with in it (vertical). The construction from the confusion points sits at zero on the horizontal by definition and near the top on the vertical. Nothing near the left of the picture is near the bottom: the closer a basis is to the receptors, the more a von Kries gain leaves behind. The unconstrained winner sits at 1.63 on the horizontal, further from the measurement than any published transform except CAT02 and Bradford. What the eye does

The best axes are not receptors

If the axes that make a von Kries gain work were nearly the cone fundamentals, the published adaptation transforms would be cone-like and their departures would be slack in a fit. They are not. Minimise the residual over all nine free numbers and the winner sits further from the measured dichromat confusion points than any of them.

136 essays on this thread, page 3 of 6 · all threads · all essays