Theme

The thread: The instrument is the reader — page 9

This is the one subject where the page is displayed on the apparatus under discussion, and the reader's own eye is the measuring device. Several figures here are experiments rather than illustrations.
What choosing a space to divide the white out in is worth. Three pairs of routes to the same colour, over forty-two surfaces: dividing the white out in tristimulus values, in a published cone space, and in the observer's own cones. The first two agree to 0.59 ΔE₀₀ at the median. Either of them differs from the observer's own cones by more than fifteen. That is why the two exact conditions in this round are exact only in the eye's own coordinates: the identity belongs to the receptors, and every published arithmetic works in a basis somebody else chose. What the brain does

The appearance model takes XYZ

CIECAM16 predicts how a colour looks, and its input is three tristimulus values computed through a standard observer. Everything this round measures happens before the model is called, so an appearance prediction inherits six observer departures and a choice of cone space before it begins.

The two tabulation choices over forty-two surfaces, under a 6500 K thermal radiator. Each column is one choice, measured over a family of forty-two analytic reflectances rather than on a single example: an absorption band of stated centre, width and depth. The four marks are the smallest, the median, the ninety-fifth percentile and the largest cost in ΔE₀₀, logarithmically. Under a smooth light the range is worth 9.1 times the step at the median, so a collection wanting one repair should widen its range rather than refine its step — and under a fluorescent tube the ranking reverses outright. What the brain does

The grid under the census

The adaptation census is computed on eighty-one wavelengths from 380 to 780 nanometres. Under the daylight and blackbody sources it uses, the range is worth about half a colour difference on ordinary surfaces and the step about a twentieth — so the census carries a tabulation term as well as an observer one, and they are not the same size.

The share of each light outside 380–780 nanometres, as power and as visual product. Two measurements of the same truncation. The upper bar is the fraction of the light's radiant power that lies outside the range; the lower is the fraction of the product of light, sample and observer — which is what a colour is made of. A thermal radiator puts a fifth of its power outside and about a thousandth of its colour, because the observer is zero where most of that power is. The gap between the two bars is the observer's own tails doing their job, and reading the upper number as though it were the lower is how a range gets argued about without being measured. What light is

A lamp is two audits at once

A lamp's ultraviolet content decides what its tabulation costs and its blue content decides what its observer costs, and the two run in opposite directions with colour temperature. So no lamp is good for both audits and no lamp is bad for both, and a single figure of merit for either is a figure of merit for one property of a spectrum.

The pairing against the direct computation, for each departure that admits both. Each departure can be computed twice: directly, by taking the difference between the fuller model and the integral one, and as a pairing — an inner product of the sample's deviation with the light's. The bar is how far apart the two answers are, relative to the answer, on a logarithmic axis. The three directional rows agree to a part in a thousand billion, which is the arithmetic of one shared quadrature. The lateral row agrees to three parts in a hundred thousand, and the gap there is the radial quadrature rather than the identity: the two integrals are taken over different grids. The pairing is not an approximation to the departure. It is the departure, written so that its two factors are separate. Where the model breaks

Three audits and one shape

The tabulation, the observer and the scene solver have nothing in common as subjects. Each turned out to hold a departure that is a pairing of two deviations, vanishes exactly when either is empty, and had been invisible because its parameter had no call site. Three subjects, one shape, and the shape is the round's result.

The conditions under which an observer's departure is exactly zero. A departure of the observer is the pairing of something belonging to the observer with something belonging to the stimulus, so emptying either factor empties the product. The axis is logarithmic in what is left when the condition is imposed. Six rows empty the stimulus's factor — a perfectly neutral sample is the same colour for every observer, at any age and any field size — and two empty the observer's, since a gain on each cone and a change of basis are both absorbed exactly. All eight are identities rather than small numbers. The last two are the same two conditions imposed in a published cone space rather than in the observer's own, and they are worth eight and thirteen units: the identity is about the eye, and the arithmetic everybody uses is in somebody else's coordinates. Where the model breaks

The conditions are the result

The round measured about twenty departures and established ten conditions. The departures are numbers that depend on a sample, a light and a construction; the conditions are exact, they hold under every substitution tried, and they are what a reader can act on. A size is a measurement and a condition is a mechanism.

Which of the collection's published quantities a departure can be pushed through. The six quantities the previous round recomputed under six different colour-difference units, and whether the same treatment works for a departure. Two do: the adaptation census and the metameric pair both take reflectances and a light, which is what a departure acts on. Four do not, and the reasons are different in each case rather than a single obstacle. A unit is a function applied to the answers, so it can be swapped at the end of any computation; a departure changes the object at the start, so it has to be accepted by every stage in between. That is the practical difference between auditing a convention and auditing a structure. Where the model breaks

What this round could not reach

Three audits, about twenty departures and ten conditions, and a longer list of things that were named and not measured. Every item on it is specific, most of them are an afternoon's work, and the reason none was done is the same in every case — the round ran out of round.

The arguments a standard observer does not have. Seven choices inside a set of colour-matching functions, each with the shape it takes and what it is worth in ΔE₀₀ on a red pigment under a 6500 K radiator. Six are measurements: a field size, an age, a macular density, a cone optical density, three peak wavelengths and a rod contribution. The seventh is not — a change of basis is a change of curves and not a change of observer, and its entry is exactly zero because the space an experiment measures is what an observer is. Printing that zero beside the others is the clearest statement of what the other six are measurements of. What a camera does

A sensor has no lens

A camera is a fourth observer and it is the only one with none of the six arguments this round measured. It does not age, it has no macular pigment, its response does not broaden with density and its peaks do not vary — so it is perfectly reproducible and is not any of the observers it is fitted to reproduce.

One surface dimmed sixteen times, and the two things that happen to it. A single surface, dimmed by successive halvings, with the lens age departure measured on it at every level. The tristimulus deviation falls by exactly the dimming factor — 16 times over the sweep, to the last bit, because the colour integral is linear in the stimulus. What a unit of that deviation is worth rises by 8.2 times over the same sweep. The colour difference the audit reports is the product of the two, and it falls by only 1.95. Matching and measuring

A deviation is not a difference

The previous round priced twenty departures in colour differences and treated each number as a property of the thing that departed. Every one of them is a product of two factors — how far the reading moved, which is linear and belongs to the departure, and what a unit of that movement is worth where it landed, which is not linear and belongs to the colour. Dimming one surface sixteen times scales the first by exactly sixteen and the second by eight.

What a code lattice costs, and where. Twelve thousand colours quantised to 8 bits per channel through the sRGB transfer function and read back, with lightness across the bottom and the colour difference the rounding cost up the side. The mean is 0.191 and the worst case is 1.15, a factor of 6.0. The bars are band means, and they rise: the encoding spends its codes in the shadows, so the top of the ramp is where the lattice is coarsest against a metric that does not compress as hard. Matching and measuring

A lattice has no derivative

Every departure priced here was priced by perturbing something and reading the answer, which requires the thing being perturbed to have a derivative. A file written on a code lattice does not have one — its output is flat almost everywhere and jumps on a set of measure zero — so quantisation can be bounded and never propagated. The bound is 1.15 colour differences at eight bits per channel against a mean of 0.19, and it is worst where the encoding spends fewest codes.

Three exchanges, two of which move the colour. The documented pipeline is a white balance, a colour matrix, a tone curve and a clip. Each bar is what happens when two neighbours change places, over 30 surfaces the modelled sensor captures: the filled bar is the mean and the tick is the worst patch. Exchanging the balance and the matrix costs 9.2 colour differences at the mean and 13.2 at the worst. Exchanging the curve and the clip costs exactly nothing, and that is a theorem rather than a small number: a monotone curve onto the unit interval commutes with clamping to it. What a camera does

The order is not in the documentation

A raw converter performs a white balance, a colour matrix, a tone curve and a clip, and every account of the process lists them in that order without saying the order decides anything. Exchanging the first two moves the picture by nine colour differences at the mean and thirteen at the worst patch. The twenty-four arrangements collapse into five outcomes running out to sixty-five, and nothing a converter ships says which of them it is.

Where the mosaic is filled in, along one row through an edge. A Bayer row across a step from 0.9 to 0.08, in units of the sensor's own ceiling, reconstructed in linear light and reconstructed after the tone curve, with the second undone so the two are compared at the same point in the chain. Away from the edge they agree to 8.3e-14, because a constant interpolates to itself under any curve. At the edge they differ by 5.78 colour differences. Interpolating encoded values pulls an edge towards its dark side. What a camera does

One step has no choice

Four of a raw converter's operations can be arranged twenty-four ways. The reconstruction cannot be arranged at all — a colour matrix needs three numbers and a mosaic site has one, so filling in the mosaic is forced to the front by arithmetic rather than by convention. What is not forced is whether it happens in linear light or after the curve, and that decision costs 5.8 colour differences at an ordinary edge and nothing at all four sites away from it.

A stop taken in raw, and the same lightness reached afterwards. Each row is a stop of exposure applied to the raw values, against a gain applied after the whole pipeline and solved so that an eighteen per cent grey comes out at the same lightness. The two are then the same brightness by construction and differ by 4.2 colour differences at the mean and 11.1 at the worst patch. A stop is a scalar in front of the curve and is not a scalar behind it. What a camera does

A stop is not a stop afterwards

Doubling the light is exactly a factor of two in raw values and in tristimulus values, which is the one thing about exposure everybody is sure of. A stop taken after the tone curve is a factor of something else, and matching the two on an eighteen per cent grey leaves the rest of the frame between three and four colour differences apart at the mean and up to eleven at the worst patch. The gain that matches one stop is 2.47 rather than 2.

The same highlight, clipped in two places. A ramp running from inside the sensor's range to 1.6 times over it, clipped at the sensor and clipped after the matrix. Below the ceiling the two are identical to the floating-point floor. Above it they part, reaching 21.0 colour differences and 78 degrees of hue. Clipping late keeps a highlight neutral and clipping early keeps its hue, and converters do both. What a camera does

Two converters and one highlight

The clip is the only step in a raw pipeline that destroys information rather than moving it, and it is the step whose position varies most between converters. Below the sensor's ceiling its position changes nothing at all, exactly. Above it, clipping at the sensor and clipping after the matrix land twenty-one colour differences and seventy-eight degrees of hue apart, and which hues are affected is a property of the camera's own dyes.

Where averaging the model's answers is and is not averaging its argument. Each row takes a spread of situations, averages the model's predictions across them, and compares that against the model's prediction for the average situation. The bar is the gap as a share of the spread itself. Over the differences between observers it is 1.4 per cent — the model is very nearly linear there. Over the range of adapting luminance one room covers in a day it is 59 per cent, and from indoors to outdoors 74. What the brain does

Where the model's curve does not matter

This round has been about what a nonlinearity does to an average, and CIECAM16 is the most nonlinear thing in the collection. Over the spread a population of observers produces, the average of its predictions is its prediction for the average to within 1.4 per cent — the nonlinearity is there and the excursion is too small to reach it. Over the range of adapting luminance one room covers in a day, the same gap is 59 per cent of the spread, and from indoors to outdoors 74.

The budget's three numbers, and the units they are in. The published three-stage budget's own figures, with each one's unit named, beside the same stage re-measured in a single unit over the same colours. Two of the three are colour differences between stimuli and the third is a distance between appearances, and the budget adds them. The fourth row is a stage the budget has no entry for: the colours the separation cannot reach even after the mapping has moved them, which comes to 1.45. What it takes to deliver it

The budget adds two units

This collection publishes a three-stage error budget for a colour-management chain and prints its sum. Two of the three stages are colour differences between stimuli and the third is a distance between appearances, and the conversion between those is not a constant. Re-measured in one unit over the same colours the chain has four stages rather than three, its end-to-end error is 5.05 against a sum of 7.66, and the profile's contribution where a job actually lands is 3.2 times its published average.
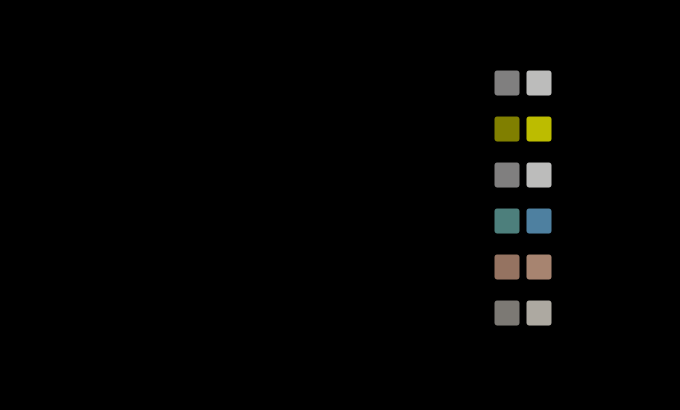
The same blend, taken on the stored values and on the light. Six pairs blended at 50 per cent, once by averaging the values as they are stored and once by averaging the light they stand for. Every resize, every antialiased edge and every transparency composite in an ordinary pipeline does the first. The two land 15.8 colour differences apart at the mean and 19.3 on a red against a green, and the stored-value blend is the darker on all six, by up to 23 units of lightness. What it takes to deliver it

An average on the stored values

A resize, an antialiased edge, a transparency composite and a chroma subsample are all averages, and in almost every pipeline they are taken on the numbers as stored. The numbers as stored are encoded, the encoding is a compression, and a half-and-half blend of black and white taken that way lands 18.7 colour differences from the half-and-half blend of the light — 22.7 units of lightness darker, on every pair, always in the same direction.

The same colour, delivered from two documents. A ramp of chroma, mapped into a press's gamut under the perceptual intent from two source solids: the whole of sRGB, and the same solid with its chroma limited, which is what a document containing only muted colours amounts to. Under a colorimetric intent the two answers are identical to the floating-point floor. Under the perceptual one they are 0.69 apart at the mean and 2.64 at the worst, on colours the destination could hold either way. What it takes to deliver it

An intent is not a function of the colour

A rendering intent is chosen per job and applied per pixel, which suggests it is a function of the colour. The colorimetric ones are, exactly — the same colour from two documents comes out identical to the floating-point floor. The perceptual one is not — it compresses the whole source solid into the destination, so the same colour delivered from a wide document and from a muted one lands 2.6 colour differences apart, on colours the destination could hold either way.

Out to the device and back, once and again. Each intent applied 3 times in succession to the same ramp. The upper bar is what the first pass moves and the lower is what the second moves. relative-colorimetric is idempotent — the second pass moves nothing, to the floating-point floor — and the other two are not: perceptual moves another 2.73 and saturation moves another 3.09. A file converted twice is not a file converted once. What it takes to deliver it

A second conversion is not a repeat

A colour converted to a device and back is described as lossy where the device cannot hold it and exact where it can, which suggests that a colour surviving one round trip survives any number. One of the four intents is idempotent to the floating-point floor. The other two are not — a perceptual conversion moves a ramp 3.70 colour differences on its first pass and another 2.73 on its second, and after three passes it is still moving by 2.42.

The angle between the lens and the macular pigment, before and after adaptation. On each of 120 surfaces the angle, in the local metric, between what an older lens does to the reading and what a denser macular pigment does, binned in ten-degree steps. Read without adaptation, where both filters yellow the observer's white along with everything else, the two point nearly the same way: a median of 8 degrees. Read after each observer has adapted to its own white, the median is 156, and the two together cost less than the larger alone on 115 of the 120. Difference and uniformity

Two yellow filters cancel on a slope

An older lens and a denser macular pigment both take blue out of the light, and read before adaptation they move a colour in nearly the same direction, eight degrees apart. Once each eye has adapted to its own white they point a median 156 degrees apart on smooth reflectances and together cost less than the lens alone. On surfaces with a narrow absorption band they still sit 26 degrees apart and add. What decides it is the width of the surface's own features.

How far the answer for the average is from the average answer, over eight spreads. For each spread of inputs, the distance between the mean of the model's answers and its answer for the mean input, as a share of the spread of the answers. Over a population of observers it is 1.4 per cent. Over surfaces it is 21 on smooth natural reflectances, 27 on a banded family with lightness in it, and 9 on a set of pale surfaces. Over the light one room sees in a day it is 59. What the brain does

The average surface does not look average

Over a population of observers the appearance model is so nearly linear that the mean of its answers is its answer for the mean, to 1.4 per cent of the spread. Over the surfaces in a scene it is not. On 240 smooth reflectances the gap is 21 per cent of the spread, and the mean surface looks 4.2 units lighter than the surfaces look on average. The grey that matches the average light is a 47 per cent reflectance; the grey that matches the average look is a 43 per cent one.

One infrared-cut filter, crossed at four angles. The transmittance of the same interference filter for light crossing it at the centre of a frame and at three steeper angles, from 560 to 760 nm. Its half-transmission edge is at 665 nm straight on and moves to 658, 646 and 630 nm, following the edge wavelength times the square root of one minus the squared sine of the angle over the square of the stack's effective index, 1.8. The deepest reds are what it takes away, and a lamp decides how much light there was in them. What a camera does

The corner of the frame has another filter

A camera's infrared-cut filter is an interference stack, and light crossing it at an angle sees its edge moved towards the blue — from 665 nm at the centre of a frame to 646 at twenty-five degrees. The corner's red channel loses a tenth of its response under daylight and a sixth under tungsten. A grey-card gain map makes the corner exactly right under the lamp it was made under; under a tungsten lamp the same grey is 2.6 colour differences wrong, under a white LED 4.2, and even under its own lamp the coloured patches are not corrected, because a moved edge is not a gain.

A black level slightly wrong, through the balance, under daylight. A grey ramp from half a per cent to seventy-two per cent reflectance, with a pedestal error of a tenth, three tenths and one per cent of white left in all three raw channels before the white balance, against the same ramp with none. The horizontal axis is the grey's reflectance, logarithmic. At a three-tenths error a two per cent grey is 2.4 colour differences off, most of it chroma, and a seventy-two per cent grey 0.21. An equal offset in the raw channels is not equal after three different gains. What a camera does

A black level is multiplied by the balance

Every raw value carries a pedestal that is subtracted before anything else, and a white balance is then a different gain in each channel. Subtracting a constant and multiplying by one commute only when the constant is zero or the gains are equal. So a pedestal left three thousandths of white too high becomes 2.4 colour differences in a two per cent grey, most of it chroma, in the colour the lamp starves — and pushing that shadow four stops in editing makes it 8.9. An offset in proportion to the lamp's own white is the exception, and it is exactly grey.

A soft proof exact for one observer, as two hundred others see it. Each display is driven to match each of thirty printed patches exactly for the reference observer, so for that observer screen and print are the same colour to fourteen decimal places. The bars are what two hundred observers drawn from the population make of the same pairs: the median observer's difference, median over the patches, and the ninety-fifth percentile observer's: 1.8 and 4.8 on the wide-gamut LCD, 2.0 and 5.4 on the OLED, 3.1 and 7.5 on the laser projector. The narrower a display's primaries, the larger both become. What it takes to deliver it

A soft proof is exact for one reader

A display can be driven to match a printed patch exactly for the standard observer — three equations, three unknowns, agreement to fourteen decimal places. Two hundred observers drawn from a realistic population see the same screen and print a median of 2.1 colour differences apart on an OLED panel and 5.4 apart at the ninety-fifth percentile. On a laser projector the ninety-fifth percentile is 7.5. The patch that fails worst is unprinted paper, and in the chain's own unit the ninety-fifth percentile reader's stage is larger than every one of the four stages a delivery chain is budgeted for.

How far the chain falls short of its sum, and how much of that is the unit. For each rendering intent, three ratios of the chain's end-to-end error to the sum of its four stages. The lowest bar is the published one, in the power-corrected unit. The middle bar is what that unit reports for a chain whose stages point the same way and add exactly — the exponent on its own. The top bar is the same chain measured in the model's own Euclidean space. Under the colorimetric intent the published ratio is 0.66, the exponent alone gives 0.74 and the chain in a space that can add 0.84: 77 per cent of the shortfall is the unit. What it takes to deliver it

A chain measured in a unit that cannot add

A delivery chain's four stages, measured in the power-corrected appearance difference, sum to 7.66 while the chain end to end measures 5.05, and the shortfall was read as the stages partly cancelling. A chain whose four stages lay in a straight line and added exactly would still read 0.74 of its sum in that unit, because a distance raised to the power 0.63 cannot add. Measured in the model's own Euclidean space the same chain reaches 0.84 of its sum. Three quarters of the published shortfall was the exponent.

258 essays on this thread, page 9 of 11 · all threads · all essays